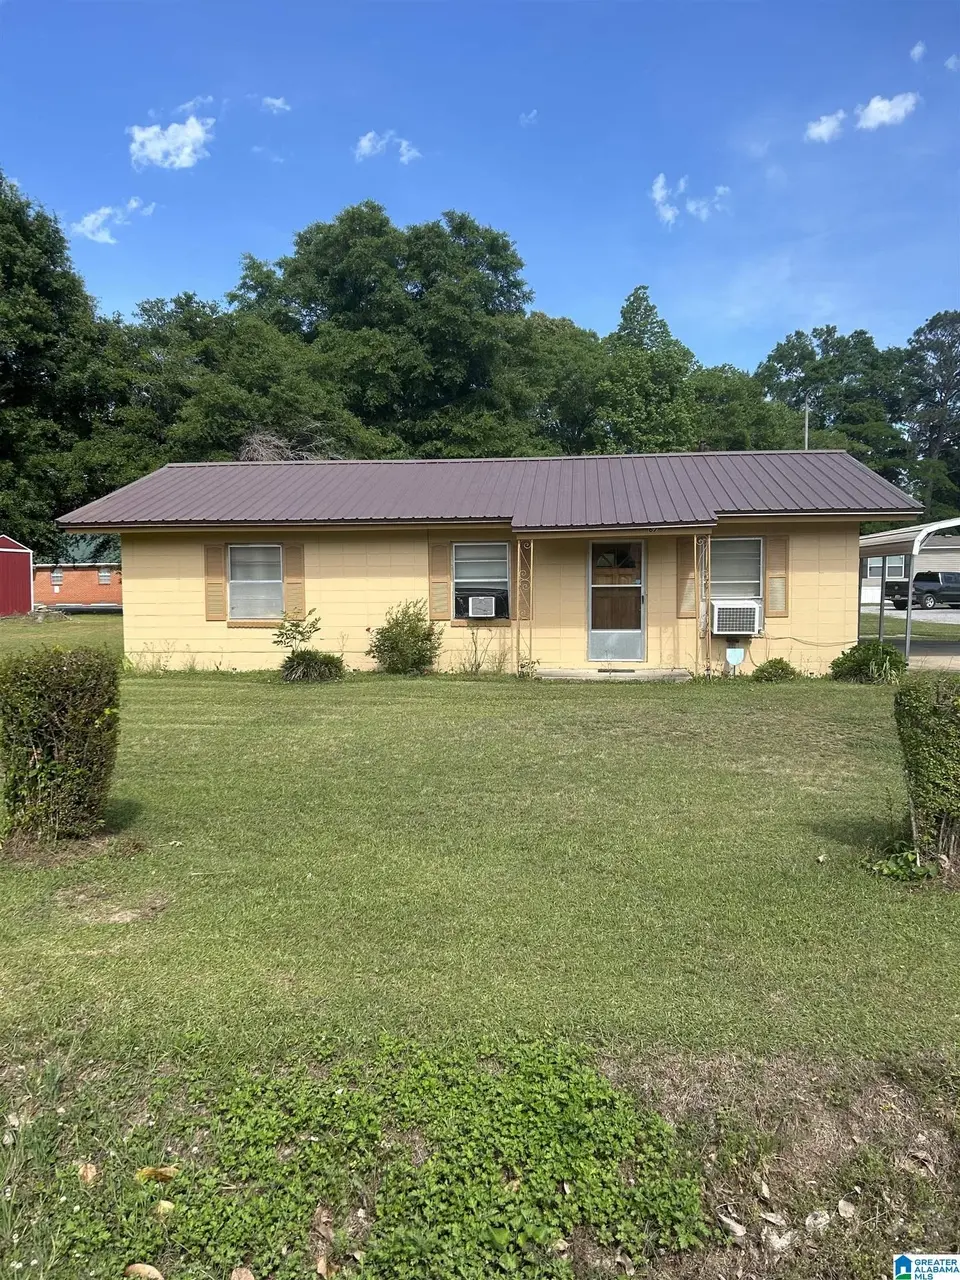
67 Pineview Dr · Maplesville, AL
Flood risk 1/10 · Minimal
- FEMA flood zone
- X (unshaded)
- Chance of flooding over 30 yrs
- 0.0%
- Est. flood insurance / yr
- $473 – $860
Fire risk 4/10 · Minor
- Est. fire insurance / yr
- $916 – $1,700
Heat risk 7/10 · Major
- Hot days now (above 107°F)
- 7 days/yr
- Hot days in 30 yrs
- 21 days/yr
Wind risk 6/10 · Moderate
- Chance of severe wind over 30 yrs
- 67.0%
Air-quality risk 2/10 · Minimal
- Unhealthy air days now
- 1 days/yr
- Unhealthy air days in 30 yrs
- 2 days/yr
Risk factors via First Street. Map © Google.
Why this score? — see what drove the B grade
The composite is a weighted blend of 9 inputs, each scored 0–100. Each bar is that input's sub-score; the figure is the points it added to the 100-point composite (weight × sub-score).
- Cash flow +30.0/30.0
- 1% rule +10.0/10.0
- DSCR +10.0/10.0
- Appreciation +7.3/10.0
- ARV discount +5.8/15.0
- Livability +2.9/5.0
- Rent growth +2.5/5.0
- Condition / age +2.2/5.0
- Schools +2.1/10.0
$54,000
🖨 Deal sheet (PDF) 📄 Offer letter ✓ Due diligence
Listing remarks
Great investment property! Sold as is!
Key facts
- 0.66 acre lot
- Parking
- Built 1969
Property features AI
Finance
- Other: Property sits on approximately 0.66 acres; Subdivision: PINEVIEW
Exterior
- Parking: Driveway parking; One carport space
- Utilities: Public water; Connected sewer; Electric water heater; Internet service available
- Home design: Existing construction; Concrete/block construction; Slab foundation
- Construction: Concrete/block exterior; Slab foundation
- Exterior features: City view; No pool, deck, patio, or garden/patio noted; Not waterfront
Interior
- Kitchen: Electric stove
- Bedrooms: Master bedroom on main level; Additional bedrooms on main level (total of 3 bedrooms listed)
- Flooring: Carpet; Vinyl
- Bathrooms: One full bathroom with tub/shower combo on main level
- Heating & cooling: No heating; No air conditioning
- Interior features: Ceilings: other (see remarks); No built-in interior features listed
- Laundry & utility: Main-level laundry area with washer hookup; Dryer hookup (electric); Pull-down attic access
Neighborhood map
What this means for you Summary
Snapshot
- This is a 3-bed/1.0-bath single-family listed at $54k. Condition is rated fair.
Deal economics
- At list price, monthly cash flow is $314 ($4k/yr) — positive.
- The deal already cash-flows at list — no discount required.
- Meets the 1% rule at list price ($870 rent vs $54k).
Location & tenants
- Location reads 57/100 on livability (#383 in AL) — a working-class tenant base; expect higher turnover. Strengths: cost of living A+, housing A+; Watch: employment C-, crime D+, amenities F.
- Chilton County (rural): math 15% / reading 34% proficiency, ranked #94 of 129 in AL (top 73%) — low school quality limits family demand, transient renter base, plan for 1-2y turnover.
- Zoned schools: Clanton Elementary School (math 37% / reading 55%, grade D-, #164 of 627 statewide, top 26%, 1,028 students, 67% FRL); Clanton Middle School (math 7% / reading 35%, grade F, #188 of 257 statewide, top 74%, 478 students, 74% FRL); Chilton County High School (math 17% / reading 17%, grade F, #195 of 305 statewide, top 68%, 783 students, 69% FRL) — zoned schools average 70% FRL vs 54% district-wide (15 pts higher); higher-poverty schools than district average — tighter screening recommended.
- Market conditions: 16 active listings in the ZIP; 25 units permitted in Chilton County in 2024 (0 in 5+ unit buildings).
Forward outlook
- In year one you build about $3k of equity ($373 loan paydown + $2k appreciation (4.5% local appreciation)).
- Chilton County population projected at -10% by 2050 — secular population decline; favor cash flow + early exit over multi-decade hold.
- At projected returns (4.5% appreciation + 3.0% rent growth), your $15k cash investment doubles in ~3 years — after that, you're playing with house money.
Negotiation context
- Only 1 days on market — expect competitive offers; lowballing is unlikely to land.
Risks & watch-outs
- Climate carrying-cost: major wind risk, 67% chance of damaging wind over 30y; extreme-heat days projected 7→21/yr by 2055 (HVAC capex compounding) — expect insurance premiums to compound above CPI over the hold.
Questions for the listing agent
- Have any recent inspections been done? Can we get a copy of the seller's disclosures and any deferred-maintenance estimates?
- Built in 1969 — when were the roof, HVAC, electrical panel, plumbing, and water heater last replaced?
- Is there a deadline driving the sale (1031 exchange, divorce, estate, relocation)? That informs how much negotiation room exists.
- Schools are F-rated, which usually means shorter tenancies and higher turnover. Who's the typical renter profile here, and what's been the actual vacancy rate?
- Crime grade is D in this area — have there been break-ins, vandalism, or insurance claims at this property in the last 3 years? What carrier currently insures it and at what premium?
- What's the average days-on-market for RENTAL listings here right now (not sales)? A rising rental-DOM trend means longer vacancies and softer asking-rent achievability than the comps imply.
- What's the recent tenant-quality profile in this submarket — average credit score on applications, eviction rate, late-payment / NSF rate, and stable-employment percentage? A property-management company in the area should have these aggregated.
- How much new for-sale + rental construction is in the pipeline within 1–3 miles? Heavy new supply typically softens prices + rents 12–24 months out; constrained supply supports both.
Investment metrics
- 1% rule
- 1.61% ✓
- Cap rate
- 13.27%
- Cash-on-cash
- 24.92%
- DSCR
- 2.11
- GRM
- 5.2
CMA / ARV
- ARV (on-the-fly)
- $52,000
- Comps found
- 1
Show comp detail 1 sale within ~0.75 mi
| Address | Dist | Beds/Ba | Sqft | Sold | Price | $/sf | Match |
|---|---|---|---|---|---|---|---|
| 67 Pineview Dr | 0.00mi | 3/1.0 | 1,000 (0%) | 1mo | $52,000 | $52 | 100 |
Match score weights: distance 35% · size 25% · config 20% · recency 20%. Top-matched comps best support the ARV.
Projected returns pro-forma
4.55% appreciation · 3.0% rent growth · sell at horizon
- IRR
- 33.8%
- Equity multiple
- 3.05×
- Total profit
- $31,069
- Equity at exit
- $29,125
- IRR
- 32.6%
- Equity multiple
- 6.12×
- Total profit
- $77,360
- Equity at exit
- $49,086
Cash invested: $15,120 (down + closing). Projections, not guarantees.
Landlord ↔ Tenant lean methodology
- Overall (STATE)
- 90 Strongly Landlord-Friendly
- State Alabama
- 90 Strongly Landlord-Friendly · R+15
- County
- — inherits STATE
- City
- — inherits STATE
ZIP-level market 36750
- Home prices YoY
- 2.6%
- Active inventory
- 16
- Price-to-rent
- 5.2×
Monthly cashflow live
- Estimated rent
- $870 medium interval (Pro) →
- Mortgage (P&I)
- −$283
- Tax est. 1.5%
- −$68 /mo · $810/yr
- Insurance
- −$22
- HOA
- −$0
- Vacancy / Maint / Mgmt
- −$183
- Net cashflow
- $314
Break-even live
Sensitivity live
| Price | -10% $351 | -5% $333 | +0% $314 | +5% $295 | +10% $277 |
|---|---|---|---|---|---|
| Rent | -10% $245 | -5% $280 | +0% $314 | +5% $348 | +10% $383 |
| Rate | -1.0pp $341 | -0.5pp $328 | base $314 | +0.5pp $300 | +1.0pp $286 |
UW: 25.0% down · 7.5% · 30yr · 1.5% tax · 5.0% vac · 8.0% maint · 8.0% mgmt
Financing live
Cash to close
- Down payment
- $13,500
- Closing costs
- $1,620
- Reserves months
- —
- Total cash needed
- —
Loan-product check · same deal, 3 products live
Conventional
25% down · 7.5% · 30yr
- Down + closing
- —
- Monthly P&I
- —
- Monthly cashflow
- —
- DSCR
- —
- Eligible?
- —
Personal DTI + credit; lowest rate.
DSCR
20% down · 8.5% · 30yr
- Down + closing
- —
- Monthly P&I
- —
- Monthly cashflow
- —
- DSCR
- —
- Eligible?
- —
No personal income docs; deal must DSCR.
Hard money
10% down · 12.0% · 12mo
- Down + closing
- —
- Monthly P&I
- —
- Monthly cashflow
- —
- DSCR
- —
- Eligible?
- —
Short-term bridge; refi at stabilization.
Listing history 2 events
-
2026-05-11status Pending
-
2026-05-09historical $54,000
ⓘ Source: listings_history table (triggers on properties + properties_extension) + one-shot
backfill from property_details.listing_events for pre-trigger history.
Climate risk First Street
- Flood 1/10 Low FEMA zone X (unshaded) · 0% chance over 30 yrs
- Wildfire 4/10 Moderate
- Heat 7/10 Severe 7 d/yr ≥107°F today · 21 d/yr by 30 yrs out
- Wind 6/10 Major 67% chance of damaging wind over 30 yrs
- Air quality 2/10 Low 1 unhealthy d/yr today · 2 by 30 yrs out
Nearby sold comps map
Loading sold comps map…
Walkable amenities ~0.75 mi
Loading nearby amenities…
Taxation est. · year 1
- Rental income
- $10,438
- − Mortgage interest
- −$3,025
- − Property taxes
- −$810
- − Insurance
- −$270
- − Repairs & maintenance
- −$835
- − Management
- −$835
- − Depreciation
- −$1,571
- Taxable income
- $3,092
- Est. tax owed @ 24.0%
- −$742
- After-tax cash flow
- $3,026/yr
For passive investors: Depreciation is non-cash, so a rental often shows a tax loss while cash-flowing — sheltering income. Rental losses are passive: they offset passive income freely, and up to $25,000/yr can offset ordinary (W-2) income if you actively participate and your MAGI is under $100k (phasing out to $0 by $150k); unused losses carry forward. On sale, claimed depreciation is recaptured at up to 25%, and gains may owe capital-gains tax (a 1031 exchange can defer both). Figures are a year-1 estimate at your 24.0% rate — not tax advice; consult a CPA.
Condition & rehab AI · 2 photos
This single-family home requires significant repairs and maintenance, including roof replacement, siding and painting, HVAC replacement, and landscaping improvements. These updates would significantly increase its resale and rental value.
Repairs flagged
- Major roof — Signs of wear and discoloration suggest significant damage and potential leaking.
- Major siding — The siding shows significant wear and discoloration, indicating it may need repainting or replacement.
- Major flooring — The exterior flooring appears to be in poor condition, with visible wear and potential tripping hazards.
- Major HVAC units — The HVAC units appear to be old and may need replacement or repair.
- Major landscaping — The landscaping is sparse and in need of maintenance, with overgrown grass and weeds visible.
Value-add opportunities
- Both roof replacement — Re-roofing would significantly improve the home's appearance and functionality.
- Both siding and painting — Repainting and replacing the siding would enhance the home's curb appeal and value.
- Both HVAC replacement — Replacing the HVAC units would improve comfort and energy efficiency, making the home more attractive to buyers and renters.
- Both landscaping and yard maintenance — A well-maintained yard and landscaping would improve the home's curb appeal and attract more potential buyers and renters.
Renovation cost estimate screening
| Repair item | Severity | Est. cost |
|---|---|---|
| roof · Signs of wear and discoloration suggest significant damage and potential leaking. | Major | $15,000–50,000 |
| siding · The siding shows significant wear and discoloration, indicating it may need repainting or replacement. | Major | $15,000–50,000 |
| flooring · The exterior flooring appears to be in poor condition, with visible wear and potential tripping hazards. | Major | $15,000–50,000 |
| HVAC units · The HVAC units appear to be old and may need replacement or repair. | Major | $15,000–50,000 |
| landscaping · The landscaping is sparse and in need of maintenance, with overgrown grass and weeds visible. | Major | $15,000–50,000 |
| Total estimated repair cost · 5 items | $75,000–250,000 |
Value-add ROI direction
- Both roof replacement — Re-roofing would significantly improve the home's appearance and functionality. ↑
- Both siding and painting — Repainting and replacing the siding would enhance the home's curb appeal and value. ↑
- Both HVAC replacement — Replacing the HVAC units would improve comfort and energy efficiency, making the home more attractive to buyers and renters. ↑
- Both landscaping and yard maintenance — A well-maintained yard and landscaping would improve the home's curb appeal and attract more potential buyers and renters. ↑
ⓘ Cost ranges are severity-bucket heuristics (US national rule-of-thumb). Get contractor quotes + a written scope before underwriting a rehab budget.
Schools (NCES district)
- District
- Chilton County
- NCES district ID
- 0100660
- Math proficiency
- 15% ▼ -26.00%
- Reading proficiency
- 34% ▼ -5.00%
- Median HH income
- $41,269
- Composite
- 20.73/100
- National rank
- #8520
- State rank
- #94 of 129 in AL
Livability — Maplesville
- Score
- 57/100
- State rank
- #383
- US rank
- #21870
Category grades
Schools grade is shown separately in the Schools card above.
Census & demographics
- Census place
- Maplesville, AL
- Population (ZIP)
- 3,009
Population outlook (Chilton County) Hauer SSP2
- Today (2025)
- 44,064 people
- By 2030
- 43,694 · -0.8%
- By 2040
- 42,168 · -4.3%
- By 2050
- 39,667 · -10.0%
- By 2075
- 31,397 · -28.7%
- By 2100
- 21,319 · -51.6%
Race, ethnicity, and origin ACS 2023
- Neighborhood character
- Predominantly White (69%)
- Race & ethnicity
- White 69% Black 22% Hispanic / Latino 5% Pacific Islander 5% Two or more races 3%
- Hispanic origin (detail)
- Mexican 5%
- Common ancestry
- Italian 1% Iranian 1%
- Foreign-born
- 3% · Canada
- Languages at home
- 95% English-only · Spanish 5%
Political lean MEDSL · Chilton
- 2024 margin
- Solid R (+72.1) · D 13.7% · R 85.8%
- 2008→2024 swing
- -14.3pp toward R · 2008: -57.8pp · 2024: -72.1pp
- All cycles
- 2024: R+72.1 2020: R+67.4 2016: R+66.6 2012: R+60.3 2008: R+57.8
Not yet ingested
- Civics
- —
Market trends
- HPI YoY
- ▲ 4.55%
- Current HPI
- 182.0762
- Rent YoY
- —
- Metro
- —
- State GDP YoY
- ▲ 2.94%
- F500 in state
- 4
Industry mix (Fortune 500 HQ in AL)
| Industry | F500 HQs | Revenue |
|---|---|---|
| Financial Services | 1 | $8B |
|
||
| Healthcare | 1 | $5B |
|
||
Price history
2 events — show timeline
- 2026-05-11 Pending — Greater Alabama MLS
- 2026-05-09 Coming Soon $54,000 Greater Alabama MLS
Cash-flow waterfall
monthlySold comps — $/sqft
last 12 mo · ≤1 miLoading sold comps…