42 Galloway Dr · Concord, CA
Flood risk 1/10 · Minimal
- FEMA flood zone
- X (unshaded)
- Chance of flooding over 30 yrs
- 0.0%
- Est. flood insurance / yr
- $507 – $1,088
Fire risk 3/10 · Minor
- Est. fire insurance / yr
- $659 – $1,223
Heat risk 4/10 · Minor
- Hot days now (above 96°F)
- 7 days/yr
- Hot days in 30 yrs
- 14 days/yr
Wind risk 1/10 · Minimal
- Chance of severe wind over 30 yrs
- —
Air-quality risk 9/10 · Severe
- Unhealthy air days now
- 18 days/yr
- Unhealthy air days in 30 yrs
- 19 days/yr
Risk factors via First Street. Map © Google.
Why this score? — see what drove the D grade
The composite is a weighted blend of 9 inputs, each scored 0–100. Each bar is that input's sub-score; the figure is the points it added to the 100-point composite (weight × sub-score).
- Cash flow +19.4/30.0
- DSCR +6.1/10.0
- 1% rule +5.1/10.0
- Schools +3.8/10.0
- Condition / age +3.8/5.0
- Rent growth +3.2/5.0
- Livability +3.2/5.0
- ARV discount +0.0/15.0
- Appreciation +0.0/10.0
$265,000
🖨 Deal sheet (PDF) 📄 Offer letter ✓ Due diligence
Listing remarks MLS
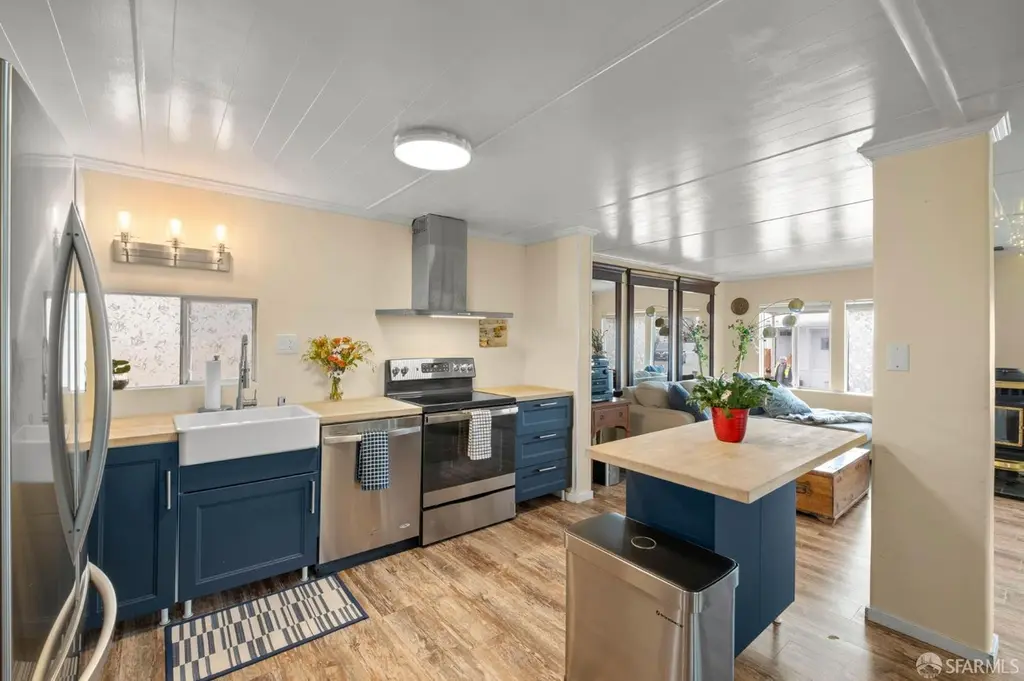
Welcome Home! This spacious 2 bedroom 2 bathroom, DOUBLE WIDE Manufactured home, is situated on a CORNER lot and is one of the LARGEST LOTS in the park! Fenced in yard offers tons of PRIVACY and space to entertain. Enter into your cozy living room and dining area. Kitchen features stainless steel appliances and granite counters with a breakfast bar. Previously a 3 bedroom home. The 3rd bedroom was converted to make a MASTER SUITE, it can easily be converted back to 3 bedrooms! Home shows pride of ownership. Concord Mobile Home Park is Top rated! This family park is well maintained and has 2 community pools, a clubhouse and car wash area!! MUST get pre approved with park manager. THIS IS A MUST SEE!!
Key facts
- Mature fruit trees
- Two sparkling pools
- Clubhouse
Tags
Property features AI
Finance
- HOA & community: No association fee listed; Pets allowed (dogs OK; limits on number and size)
Exterior
- Parking: Covered parking; Carport for 2 vehicles; 2 parking spaces total
- Utilities: Public water; Public sewer
- Home design: Manufactured in park (double wide)
- Construction: Double wide manufactured home; Model: Budger; Year built: unknown
- Exterior features: Located in Concord Mobile Home Park; Board approval and rental restrictions apply
Interior
- Kitchen: Dishwasher; Electric cooktop
- Bedrooms: 3 bedrooms
- Bathrooms: 2 full bathrooms
- Heating & cooling: Pellet stove; Wall furnace; Ceiling fan(s); Has heating and cooling
- Interior features: Updated/remodeled condition; Pellet stove fireplace; Wall furnace heating; Ceiling fans; Cooling (other)
- Laundry & utility: Indoor laundry with washer and dryer
Neighborhood map
What this means for you Summary
Snapshot
- This is a 3-bed/2.0-bath manufactured listed at $265k. Condition is rated good.
Deal economics
- At list price, monthly cash flow is $294 ($4k/yr) — positive.
- The deal already cash-flows at list — no discount required.
- Meets the 1% rule at list price ($3k rent vs $265k).
- Recommended offer: $261k (1.5% below list) — sets the bar for market timing.
- Cap rate 7.6% vs local median 2.8% in Concord — top-decile yield for the area; either an underpriced asset or a hidden risk that comps aren't pricing in. Stress-test before assuming the spread holds.
Location & tenants
- Location reads 65/100 on livability (#397 in CA) — a middle-class / working-renter tenant base. Strengths: employment A+, health & safety A+, housing B; Watch: crime F, amenities F, commute F.
- Mt. Diablo Unified (suburban): math 36% / reading 45% proficiency, ranked #202 of 517 in CA (top 39%) — families likely to look elsewhere, expect single-tenant / working-renter base with shorter leases.
- Zoned schools: Woodside Elementary (math 32% / reading 27%, grade F, #856 of 1,571 statewide, top 57%, 278 students, 32% FRL); Oak Grove Middle (math 8% / reading 19%, grade F, #468 of 498 statewide, top 94%, 720 students, 81% FRL); Ygnacio Valley High (math 12% / reading 32%, grade F, #950 of 1,170 statewide, top 82%, 1,172 students, 82% FRL) — zoned schools average 65% FRL vs 37% district-wide (28 pts higher); higher-poverty schools than district average — tighter screening recommended.
- Zoned-school proficiency averages 22% at this address vs 40% district-wide (-19 pts) — the specific schools serving this property underperform the Mt. Diablo Unified average; the district grade overstates school quality for this exact location.
- Market conditions: Rents rising (+2.8%/yr); 134 active listings in the ZIP; 40 comparable units currently listed for rent nearby; rentals at typical pace (median 17d on market — plan ~3-4 weeks tenant-placement turnaround); high-income renter base; 2,169 units permitted in Contra Costa County in 2024 (896 in 5+ unit buildings).
Forward outlook
- Local home prices are declining (-3.0%/yr); year-one equity from $2k of loan paydown is wiped out by about $8k of value loss. Plan a longer hold.
- Contra Costa County population projected at +26% by 2050 — long-run rental-demand tailwind backs the buy-and-hold thesis.
Negotiation context
- It's been on market 17 days — a 2% lower offer ($261k) is reasonable based on typical stale-listing flexibility.
- 4 sale attempts since 4y ago with the ask held roughly flat each time — persistent listings suggest the price (not the market) is what's stuck; bring a comps-based counter.
- Current owner paid $205k; 29% above their basis — modest negotiation headroom, anchor on the comps not their cost.
Questions for the listing agent
- Is there a deadline driving the sale (1031 exchange, divorce, estate, relocation)? That informs how much negotiation room exists.
- Crime grade is F in this area — have there been break-ins, vandalism, or insurance claims at this property in the last 3 years? What carrier currently insures it and at what premium?
- The area grade is low — what's the realistic commute time and amenity access for the typical tenant pool here? Any planned neighborhood developments (good or bad) we should know about?
- What's the average days-on-market for RENTAL listings here right now (not sales)? A rising rental-DOM trend means longer vacancies and softer asking-rent achievability than the comps imply.
- What's the recent tenant-quality profile in this submarket — average credit score on applications, eviction rate, late-payment / NSF rate, and stable-employment percentage? A property-management company in the area should have these aggregated.
- How much new for-sale + rental construction is in the pipeline within 1–3 miles? Heavy new supply typically softens prices + rents 12–24 months out; constrained supply supports both.
Investment metrics
- 1% rule
- 1.01% ✓
- Cap rate
- 7.62%
- Cash-on-cash
- 4.75%
- DSCR
- 1.21
- GRM
- 8.2
CMA / ARV
- ARV (on-the-fly)
- $218,400
- Comps found
- 9
Show comp detail 9 sales within ~0.75 mi
| Address | Dist | Beds/Ba | Sqft | Sold | Price | $/sf | Match |
|---|---|---|---|---|---|---|---|
| 100 Welcome Ave | 0.25mi | 2/2.0 (-1) | 1,200 (0%) | 9mo | $170,000 | $142 | 76 |
| 36 Helen Ave #36 | 0.22mi | 3/2.0 | 1,100 (-8%) | 0mo | $239,000 | $217 | 76 |
| 20 Terrace Dr | 0.04mi | 2/2.0 (-1) | 1,152 (-4%) | 18mo | $180,000 | $156 | 72 |
| 19 Terrace Dr | 0.13mi | 2/2.0 (-1) | 1,154 (-4%) | 19mo | $285,000 | $247 | 66 |
| 26 David Dr | 0.19mi | 3/2.0 | 1,020 (-15%) | 3mo | $170,000 | $167 | 64 |
| 131 Laila Ln | 0.11mi | 2/2.0 (-1) | 1,080 (-10%) | 16mo | $248,000 | $230 | 60 |
| 1080 San Miguel Rd #127 | 0.38mi | 2/2.0 (-1) | 1,100 (-8%) | 9mo | $200,000 | $182 | 56 |
| 45 Terrace Dr | 0.11mi | 2/2.0 (-1) | 1,368 (+14%) | 14mo | $285,000 | $208 | 55 |
| 69 Terrace Dr | 0.15mi | 2/2.0 (-1) | 1,368 (+14%) | 15mo | $200,000 | $146 | 52 |
Match score weights: distance 35% · size 25% · config 20% · recency 20%. Top-matched comps best support the ARV.
Projected returns pro-forma
-3.0% appreciation · 2.77% rent growth · sell at horizon
- IRR
- -9.1%
- Equity multiple
- 0.67×
- Total profit
- $-24,827
- Equity at exit
- $39,512
- IRR
- 0.0%
- Equity multiple
- 1.00×
- Total profit
- $83
- Equity at exit
- $22,912
Cash invested: $74,200 (down + closing). Projections, not guarantees.
Landlord ↔ Tenant lean methodology
- Overall (STATE)
- 18 Strongly Tenant-Friendly
- State California
- 18 Strongly Tenant-Friendly · D+13
- County
- — inherits STATE
- City
- — inherits STATE
ZIP-level market 94518
- Rents YoY
- 2.8%
- Active inventory
- 134
- Price-to-rent
- 8.2×
Monthly cashflow live
- Estimated rent
- $2,690 high interval (Pro) →
- Mortgage (P&I)
- −$1,390
- Tax est. 1.5%
- −$331 /mo · $3,975/yr
- Insurance
- −$110
- HOA
- −$0
- Vacancy / Maint / Mgmt
- −$565
- Net cashflow
- $294
Break-even live
Sensitivity live
| Price | -10% $477 | -5% $385 | +0% $294 | +5% $202 | +10% $110 |
|---|---|---|---|---|---|
| Rent | -10% $81 | -5% $187 | +0% $294 | +5% $400 | +10% $506 |
| Rate | -1.0pp $427 | -0.5pp $361 | base $294 | +0.5pp $225 | +1.0pp $155 |
UW: 25.0% down · 7.5% · 30yr · 1.5% tax · 5.0% vac · 8.0% maint · 8.0% mgmt
Financing live
Cash to close
- Down payment
- $66,250
- Closing costs
- $7,950
- Reserves months
- —
- Total cash needed
- —
Loan-product check · same deal, 3 products live
Conventional
25% down · 7.5% · 30yr
- Down + closing
- —
- Monthly P&I
- —
- Monthly cashflow
- —
- DSCR
- —
- Eligible?
- —
Personal DTI + credit; lowest rate.
DSCR
20% down · 8.5% · 30yr
- Down + closing
- —
- Monthly P&I
- —
- Monthly cashflow
- —
- DSCR
- —
- Eligible?
- —
No personal income docs; deal must DSCR.
Hard money
10% down · 12.0% · 12mo
- Down + closing
- —
- Monthly P&I
- —
- Monthly cashflow
- —
- DSCR
- —
- Eligible?
- —
Short-term bridge; refi at stabilization.
Rent comps 40 comps
| Address | Beds | Baths | Sqft | Rent | $/sqft | DOM | Units | Dist |
|---|---|---|---|---|---|---|---|---|
| 1070 San Miguel Rd Concord, CA | 1.0–2.0 | 1.0–1.5 | 890 | $2,590 | $2.91 | 21d | 1 | 0.31mi |
| 2043 Sierra Rd #11 Concord, CA | 2.0 | 1.5 | 904 | $2,100 | $2.32 | 25d | 1 | 0.64mi |
| 2039 Sierra Rd Concord, CA | 3.0 | 2.0 | 1098 | $2,895 | $2.64 | 25d | 1 | 0.66mi |
| 1036 Oak Grove Rd Concord, CA | 1.0–2.0 | 1.0–1.5 | 810 | $2,600 | $3.21 | 25d | 2 | 0.67mi |
| 1036 Oak Grove Rd Concord, CA | 1.0–2.0 | 1.0–1.5 | 826 | $2,600 | $3.15 | 0d | 4 | 0.67mi |
| 2751 Monument Blvd Concord, CA | 1.0–2.0 | 1.0 | 676 | $2,045 | $3.03 | 4d | 1 | 0.69mi |
| 1236 Detroit Ave Concord, CA | 2.0 | 1.0 | 750 | $2,430 | $3.24 | 6d | 1 | 0.76mi |
| 1050 Oak Grove Rd Concord, CA | 1.0–2.0 | 1.0 | 740 | $2,325 | $3.14 | 3d | 3 | 0.79mi |
| 2925 Monument Blvd Concord, CA | 2.0–3.0 | 1.5 | 1084 | $3,055 | $2.82 | 0d | 6 | 0.80mi |
| 1220 Pine Creek Way #1 Concord, CA | 3.0 | 1.5 | 1261 | $2,950 | $2.34 | 25d | 1 | 0.80mi |
| 1160 Meadow Ln Concord, CA | 1.0–2.0 | 1.0–1.5 | 740 | $2,240 | $3.02 | 13d | 9 | 0.92mi |
| 1750 Diane Ct Concord, CA | 2.0 | 1.0 | 900 | $2,325 | $2.58 | 25d | 1 | 0.98mi |
| 1866 Robin Ln Unit 6 Concord, CA | 2.0 | 1.0 | 700 | $2,200 | $3.14 | 22d | 1 | 0.99mi |
| 1883 Robin Ln #1 Concord, CA | 2.0 | 1.0 | 950 | $2,600 | $2.74 | 25d | 1 | 1.00mi |
| 1195 Heather Ct Unit A Concord, CA | 2.0 | 1.0 | 980 | $2,700 | $2.76 | 5d | 1 | 1.02mi |
| 1818 Laguna St Concord, CA | 1.0–2.0 | 1.0 | 750 | $2,350 | $3.13 | 0d | 14 | 1.03mi |
| 1835 Robin Ln Concord, CA | 2.0 | 2.0 | 800 | $2,100 | $2.62 | 6d | 1 | 1.05mi |
| 1835 Robin Ln Unit 11 Concord, CA | 2.0 | 2.0 | 800 | $2,100 | $2.62 | 25d | 1 | 1.06mi |
| 1590 Frisbie Ct Unit 6 Concord, CA | 2.0 | 1.0 | 850 | $2,195 | $2.58 | 16d | 1 | 1.07mi |
| 1500 Ellis St Concord, CA | 2.0 | 1.0–2.0 | 664 | $2,350 | $3.54 | 0d | 5 | 1.09mi |
| 1660 Haller Ct Concord, CA | 2.0 | 1.0 | 880 | $2,125 | $2.41 | 23d | 1 | 1.09mi |
| 1841 Laguna St Concord, CA | 2.0 | 1.0 | 925 | $2,372 | $2.56 | 25d | 5 | 1.10mi |
| 1441 Detroit Ave Concord, CA | 1.0–2.0 | 1.0–2.0 | 738 | $2,391 | $3.24 | 3d | 11 | 1.11mi |
| 1167 Saint Matthew Pl Concord, CA | 2.0 | 1.0 | 850 | $2,295 | $2.70 | 6d | 1 | 1.11mi |
| 1631 Frisbie Ct Concord, CA | 2.0 | 1.0 | 750 | $2,100 | $2.80 | 6d | 1 | 1.11mi |
| 1631 Frisbie Ct Concord, CA | 2.0 | 1.0 | 750 | $2,100 | $2.80 | 25d | 1 | 1.11mi |
| 1641 Frisbie Ct Concord, CA | 2.0 | 1.0 | 900 | $2,325 | $2.58 | 25d | 1 | 1.12mi |
| 1301 Traynor Rd Concord, CA | 3.0 | 1.0 | 1024 | $3,395 | $3.32 | 0d | 1 | 1.12mi |
| 1555 Galindo St Concord, CA | 1.0–3.0 | 1.0–2.5 | 1045 | $4,535 | $4.34 | 0d | 13 | 1.14mi |
| 2520 Ryan Rd Concord, CA | 2.0 | 2.0 | 1012 | $2,750 | $2.72 | 25d | 1 | 1.17mi |
| 3055 Treat Blvd Concord, CA | 2.0 | 2.0 | 973 | $2,500 | $2.57 | 25d | 1 | 1.22mi |
| 1500 Pine St Concord, CA | 1.0–2.0 | 1.0 | 735 | $2,200 | $2.99 | 11d | 1 | 1.23mi |
| 1590 Detroit Ave Concord, CA | 2.0 | 1.0 | 878 | $2,500 | $2.85 | 25d | 1 | 1.23mi |
| 1730 Adelaide St Concord, CA | 2.0 | 1.0 | 940 | $2,105 | $2.24 | 0d | 1 | 1.26mi |
| 1790 Ellis St #12 Concord, CA | 2.0 | 2.0 | 1025 | $2,650 | $2.59 | 25d | 1 | 1.26mi |
| 1704 Clayton Rd Concord, CA | 1.0–2.0 | 1.0 | 750 | $2,250 | $3.00 | 25d | 1 | 1.28mi |
| 1770 Adelaide St Concord, CA | 1.0–2.0 | 1.0 | 800 | $1,999 | $2.50 | 19d | 1 | 1.29mi |
| 1776 Grant St Concord, CA | 1.0–2.0 | 1.0–2.0 | 878 | $4,207 | $4.79 | 0d | 12 | 1.31mi |
| 1650 Pine St Concord, CA | 1.0–2.0 | 1.0–2.0 | 878 | $2,300 | $2.62 | 16d | 27 | 1.33mi |
| 1100 Victory Ln Concord, CA | 2.0 | 1.0 | 800 | $2,295 | $2.87 | 0d | 1 | 1.34mi |
Listing history 11 events
-
2026-06-21days on market $265,000 Active 17 DOM
-
2026-06-18days on market $265,000 Active 14 DOM
-
2026-06-17days on market $265,000 Active 13 DOM
-
2026-06-16days on market $265,000 Active 12 DOM
-
2026-06-15days on market $265,000 Active 11 DOM
-
2026-06-13days on market $265,000 Active 9 DOM
-
2026-06-13days on market $265,000 Active 8 DOM
-
2026-06-10days on market $265,000 Active 5 DOM
-
2026-06-08days on market $265,000 Active 4 DOM
-
2026-06-07remarks 699-char remark
-
2026-06-07$265,000 Active 3 DOM
ⓘ Source: listings_history table (triggers on properties + properties_extension) + one-shot
backfill from property_details.listing_events for pre-trigger history.
Climate risk First Street
- Flood 1/10 Low FEMA zone X (unshaded) · 0% chance over 30 yrs
- Wildfire 3/10 Moderate
- Heat 4/10 Moderate 7 d/yr ≥96°F today · 14 d/yr by 30 yrs out
- Wind 1/10 Low
- Air quality 9/10 Extreme 18 unhealthy d/yr today · 19 by 30 yrs out
Nearby sold comps map
Loading sold comps map…
Walkable amenities ~0.75 mi
Loading nearby amenities…
Taxation est. · year 1
- Rental income
- $32,277
- − Mortgage interest
- −$14,844
- − Property taxes
- −$3,975
- − Insurance
- −$1,325
- − Repairs & maintenance
- −$2,582
- − Management
- −$2,582
- − Depreciation
- −$7,709
- Taxable loss
- −$741
- Est. tax savings @ 24.0%
- +$178
- After-tax cash flow
- $3,700/yr
For passive investors: Depreciation is non-cash, so a rental often shows a tax loss while cash-flowing — sheltering income. Rental losses are passive: they offset passive income freely, and up to $25,000/yr can offset ordinary (W-2) income if you actively participate and your MAGI is under $100k (phasing out to $0 by $150k); unused losses carry forward. On sale, claimed depreciation is recaptured at up to 25%, and gains may owe capital-gains tax (a 1031 exchange can defer both). Figures are a year-1 estimate at your 24.0% rate — not tax advice; consult a CPA.
Condition & rehab AI · 12 photos
This well-maintained, updated mobile home offers a good condition with minimal repairs needed. It's move-in ready with a good curb appeal and potential for further value through exterior painting and window replacement.
Value-add opportunities
- Resale Paint exterior — Enhances curb appeal and value
- Resale Replace frosted glass windows — Improves natural light and aesthetics
- Both Replace flooring — Hardwood floors are in good condition but could be refreshed
Renovation cost estimate screening
Value-add ROI direction
- Resale Paint exterior — Enhances curb appeal and value ↑
- Resale Replace frosted glass windows — Improves natural light and aesthetics ↑
- Both Replace flooring — Hardwood floors are in good condition but could be refreshed ↑
ⓘ Cost ranges are severity-bucket heuristics (US national rule-of-thumb). Get contractor quotes + a written scope before underwriting a rehab budget.
Schools (NCES district)
- District
- Mt. Diablo Unified
- NCES district ID
- 0626370
- Math proficiency
- 36% ▼ -2.00%
- Reading proficiency
- 45% ▼ -5.00%
- Median HH income
- $77,494
- Composite
- 37.5/100
- National rank
- #4401
- State rank
- #202 of 517 in CA
Livability — Concord
- Score
- 65/100
- State rank
- #397
- US rank
- #13519
Category grades
Schools grade is shown separately in the Schools card above.
Census & demographics
- Census place
- Concord, CA
- County
- Contra Costa County · 1,059,880 people
- City population
- 125,693
- Metro
- San Francisco-Oakland-Berkeley, CA
- Population (ZIP)
- 27,345
- Household income
- $112,094
- Rent vs Own
- Severe rent burden
- 1071.0
Population outlook (Contra Costa County) Hauer SSP2
- Today (2025)
- 1,287,720 people
- By 2030
- 1,364,937 · +6.0%
- By 2040
- 1,506,209 · +17.0%
- By 2050
- 1,624,373 · +26.1%
- By 2075
- 1,853,193 · +43.9%
- By 2100
- 1,901,231 · +47.6%
Race, ethnicity, and origin ACS 2023
- Neighborhood character
- Diverse neighborhood (Simpson 0.67)
- Race & ethnicity
- White 48% Hispanic / Latino 29% Two or more races 18% Asian 13% Black 2% Native American 1%
- Hispanic origin (detail)
- Mexican 17%
- Common ancestry
- Lithuanian 2% Italian 2% Slovak 2%
- Foreign-born
- 26% · Canada, China, Jamaica
- Languages at home
- 64% English-only · Spanish 20% Other Indo-European 5% Chinese 4%
Political lean MEDSL · Contra Costa
- 2024 margin
- Solid D (+38.0) · D 67.3% · R 29.4% · Other 3.3%
- 2008→2024 swing
- +0.2pp no change · 2008: 37.8pp · 2024: 38.0pp
- All cycles
- 2024: D+38.0 2020: D+45.3 2016: D+43.5 2012: D+33.7 2008: D+37.8
Not yet ingested
- Civics
- —
Market trends
- HPI YoY
- ▼ -817.60%
- Current HPI
- 149.0257
- Rent YoY
- ▲ 2.77%
- Metro
- San Francisco-Oakland-Berkeley, CA
- State GDP YoY
- ▲ 3.21%
- F500 in state
- 116
Industry mix (Fortune 500 HQ in CA)
| Industry | F500 HQs | Revenue |
|---|---|---|
| Technology | 27 | $1,492B |
|
||
| Financial Services | 3 | $174B |
|
||
| Retail | 3 | $44B |
|
||
| Insurance | 3 | $26B |
|
||
| Media / Entertainment | 2 | $115B |
|
||
| Pharmaceuticals / Biotech | 2 | $62B |
|
||
Price history
+21.0% since first listed6 events — show timeline
- 2026-06-04 Listed $265,000 San Francisco MLS
- 2026-03-01 Relisted — San Francisco MLS
- 2026-02-15 Contingent — San Francisco MLS
- 2026-01-22 Listed $250,000 San Francisco MLS
- 2022-03-31 Sold (MLS) $205,000 San Francisco MLS
- 2022-02-14 Listed $219,000 San Francisco MLS
Cash-flow waterfall
monthlySold comps — $/sqft
last 12 mo · ≤1 miLoading sold comps…