1300 Michigan Ave Trlr 32 · Iron Mountain, MI
Flood risk No data
- FEMA flood zone
- —
- Chance of flooding over 30 yrs
- —
- Est. flood insurance / yr
- —
Fire risk No data
- Est. fire insurance / yr
- —
Heat risk No data
- Hot days now (above threshold)
- —
- Hot days in 30 yrs
- —
Wind risk No data
- Chance of severe wind over 30 yrs
- —
Air-quality risk No data
- Unhealthy air days now
- —
- Unhealthy air days in 30 yrs
- —
Risk factors via First Street. Map © Google.
Why this score? — see what drove the B grade
The composite is a weighted blend of 9 inputs, each scored 0–100. Each bar is that input's sub-score; the figure is the points it added to the 100-point composite (weight × sub-score).
- Cash flow +30.0/30.0
- ARV discount +13.2/15.0
- 1% rule +10.0/10.0
- DSCR +10.0/10.0
- Livability +3.7/5.0
- Schools +2.9/10.0
- Rent growth +2.5/5.0
- Condition / age +2.5/5.0
- Appreciation +0.0/10.0
$25,000
🖨 Deal sheet 📄 Offer letter ✓ Due diligence
Listing remarks
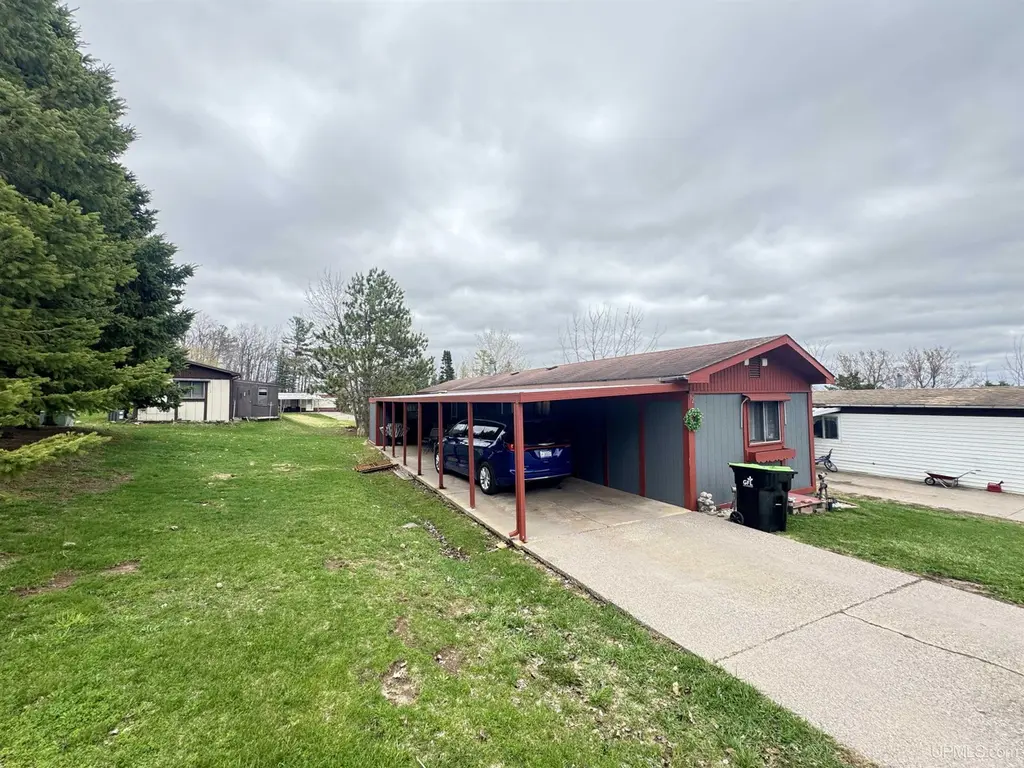
Two bedroom one and a half bathroom home in the Park Ridge mobile home park in Iron Mountain Michigan for sale! This park has had many recent updates including a playground and community club house added in recent years. This home has had many updates sitting at 980 SQ FT including newer floors, siding, water meter, and paint. Bathrooms have also been made hanicap accessible. Call your Realtor today to setup a showing
Key facts
- Garage
- Built 1973
- Listed 51 days
Property features AI
Finance
- Other: Accessible central living area; Accessible full bathroom; Located in Breitung Township, Iron Mountain area; Directions: At park entrance go straight; home will be on the right
- Financial info: Rental amount listed at $587 (lease/rent information)
- HOA & community: Community clubhouse; Playground; Private entry; Some pet restrictions
Exterior
- Parking: Carport; Garage available (1 garage parking space); Additional parking for 3 or more vehicles
- Utilities: Public water; Public sanitary sewer; 100 Amp electric service; Gas water heater; Natural gas fuel
- Home design: Manufactured single-wide home; Located in an MH park (Park Ridge); One-story; Built in 1973; Manufactured home
- Construction: Hard board exterior; Piers foundation
- Exterior features: Patio; Paved street access; Dead-end location
Interior
- Kitchen: Range/Oven; Refrigerator
- Bedrooms: Bedrooms located on the first floor
- Bathrooms: One full bathroom; One lavatory (two total lavatories); Master bedroom with half bath/lavatory
- Heating & cooling: Forced air heating; Central A/C
- Interior features: Window treatments
- Laundry & utility: Washer; Dryer; Poured foundation (basement type listed as poured)
Neighborhood map
What this means for you Summary
Snapshot
- This is a 2-bed/1.0-bath manufactured listed at $25k.
Deal economics
- At list price, monthly cash flow is $524 ($6k/yr) — positive.
- The deal already cash-flows at list — no discount required.
- Meets the 1% rule at list price ($882 rent vs $25k).
- Recommended offer: $24k (3.0% below list) — sets the bar for market timing.
- Cap rate 31.5% vs local median 4.3% in Iron Mountain — top-decile yield for the area; either an underpriced asset or a hidden risk that comps aren't pricing in. Stress-test before assuming the spread holds.
Location & tenants
- Location reads 73/100 on livability (#225 in MI) — a middle-class / working-renter tenant base. Strengths: cost of living A+, housing A+, health & safety A+; Watch: schools C-, crime C-, employment D.
- Iron Mountain Public Schools (town): math 24% / reading 44% proficiency, ranked #316 of 540 in MI (top 58%) — families likely to look elsewhere, expect single-tenant / working-renter base with shorter leases.
- Market conditions: 72 active listings in the ZIP; 42 units permitted in Dickinson County in 2024 (0 in 5+ unit buildings).
Forward outlook
- Local home prices are declining (-3.0%/yr); year-one equity from $173 of loan paydown is wiped out by about $750 of value loss. Plan a longer hold.
- Dickinson County population projected at -14% by 2050 — secular population decline; favor cash flow + early exit over multi-decade hold.
- At projected returns (-3.0% appreciation + 3.0% rent growth), your $7k cash investment doubles in ~2 years — after that, you're playing with house money.
Negotiation context
- It's been on market 51 days — a 3% lower offer ($24k) is reasonable based on typical stale-listing flexibility.
Questions for the listing agent
- It's been on market 51 days. Have you received any prior offers? Is the seller open to a 3% concession, seller financing, or rate buy-down credit?
- Built in 1973 — when were the roof, HVAC, electrical panel, plumbing, and water heater last replaced?
- Is there a deadline driving the sale (1031 exchange, divorce, estate, relocation)? That informs how much negotiation room exists.
- What's the average days-on-market for RENTAL listings here right now (not sales)? A rising rental-DOM trend means longer vacancies and softer asking-rent achievability than the comps imply.
- What's the recent tenant-quality profile in this submarket — average credit score on applications, eviction rate, late-payment / NSF rate, and stable-employment percentage? A property-management company in the area should have these aggregated.
- How much new for-sale + rental construction is in the pipeline within 1–3 miles? Heavy new supply typically softens prices + rents 12–24 months out; constrained supply supports both.
Investment metrics
- 1% rule
- 3.53% ✓
- Cap rate
- 31.45%
- Cash-on-cash
- 89.86%
- DSCR
- 5.00
- GRM
- 2.4
CMA / ARV
- ARV (median comp)
- $28,602
- List price
- $25,000
- Delta
- -12.59%
- Verdict
- UNDERPRICED
- Comps
- 3 within 2.0 mi
Projected returns pro-forma
-3.0% appreciation · 3.0% rent growth · sell at horizon
- IRR
- 90.5%
- Equity multiple
- 5.19×
- Total profit
- $29,349
- Equity at exit
- $3,728
- IRR
- 93.5%
- Equity multiple
- 10.80×
- Total profit
- $68,602
- Equity at exit
- $2,162
Cash invested: $7,000 (down + closing). Projections, not guarantees.
Landlord ↔ Tenant lean methodology
- Overall (STATE)
- 62 Landlord-Friendly
- State Michigan
- 62 Landlord-Friendly · EVEN
- County
- — inherits STATE
- City
- — inherits STATE
ZIP-level market 49801
- Home prices YoY
- -27.8%
- Active inventory
- 72
- Price-to-rent
- 2.4×
Monthly cashflow live
- Estimated rent
- $882 medium interval (Pro) →
- Mortgage (P&I)
- −$131
- Tax est. 1.5%
- −$31 /mo · $375/yr
- Insurance
- −$10
- HOA
- −$0
- Vacancy / Maint / Mgmt
- −$185
- Net cashflow
- $524
Break-even live
UW: 25.0% down · 7.5% · 30yr · 1.5% tax · 5.0% vac · 8.0% maint · 8.0% mgmt
Financing live
Cash to close
- Down payment
- $6,250
- Closing costs
- $750
- Reserves months
- —
- Total cash needed
- —
Loan-product check · same deal, 3 products live
Conventional
25% down · 7.5% · 30yr
- Down + closing
- —
- Monthly P&I
- —
- Monthly cashflow
- —
- DSCR
- —
- Eligible?
- —
Personal DTI + credit; lowest rate.
DSCR
20% down · 8.5% · 30yr
- Down + closing
- —
- Monthly P&I
- —
- Monthly cashflow
- —
- DSCR
- —
- Eligible?
- —
No personal income docs; deal must DSCR.
Hard money
10% down · 12.0% · 12mo
- Down + closing
- —
- Monthly P&I
- —
- Monthly cashflow
- —
- DSCR
- —
- Eligible?
- —
Short-term bridge; refi at stabilization.
Listing history 18 events
-
2026-06-18days on market $25,000 Active 51 DOM
-
2026-06-17days on market $25,000 Active 50 DOM
-
2026-06-17price $25,000 Active 49 DOM
-
2026-06-16days on market $30,000 Active 49 DOM
-
2026-06-15days on market $30,000 Active 48 DOM
-
2026-06-13days on market $30,000 Active 46 DOM
-
2026-06-12days on market $30,000 Active 45 DOM
-
2026-06-09days on market $30,000 Active 42 DOM
-
2026-06-08days on market $30,000 Active 41 DOM
-
2026-06-07days on market $30,000 Active 40 DOM
-
2026-06-07days on market $30,000 Active 39 DOM
-
2026-06-04days on market $30,000 Active 36 DOM
-
2026-06-02days on market $30,000 Active 35 DOM
-
2026-06-01days on market $30,000 Active 34 DOM
-
2026-05-31days on market $30,000 Active 33 DOM
-
2026-05-31days on market $30,000 Active 32 DOM
-
2026-05-13price $39,900 421-char remark
-
2026-04-27$42,500 Active 421-char remark
ⓘ Source: listings_history table (triggers on properties + properties_extension) + one-shot
backfill from property_details.listing_events for pre-trigger history.
Nearby sold comps map
Loading sold comps map…
Walkable amenities ~0.75 mi
Loading nearby amenities…
Taxation est. · year 1
- Rental income
- $10,587
- − Mortgage interest
- −$1,400
- − Property taxes
- −$375
- − Insurance
- −$125
- − Repairs & maintenance
- −$847
- − Management
- −$847
- − Depreciation
- −$727
- Taxable income
- $6,265
- Est. tax owed @ 24.0%
- −$1,504
- After-tax cash flow
- $4,787/yr
For passive investors: Depreciation is non-cash, so a rental often shows a tax loss while cash-flowing — sheltering income. Rental losses are passive: they offset passive income freely, and up to $25,000/yr can offset ordinary (W-2) income if you actively participate and your MAGI is under $100k (phasing out to $0 by $150k); unused losses carry forward. On sale, claimed depreciation is recaptured at up to 25%, and gains may owe capital-gains tax (a 1031 exchange can defer both). Figures are a year-1 estimate at your 24.0% rate — not tax advice; consult a CPA.
Schools (NCES district)
- District
- Iron Mountain Public Schools
- NCES district ID
- 2619410
- Math proficiency
- 24% ▼ -7.00%
- Reading proficiency
- 44% ▼ -5.00%
- Median HH income
- $40,676
- Composite
- 28.55/100
- National rank
- #6729
- State rank
- #316 of 540 in MI
Livability — Iron Mountain
- Score
- 73/100
- State rank
- #225
- US rank
- #5664
Category grades
Schools grade is shown separately in the Schools card above.
Census & demographics
- Census place
- Iron Mountain, MI
- Population (ZIP)
- 11,606
Population outlook (Dickinson County) Hauer SSP2
- Today (2025)
- 25,175 people
- By 2030
- 24,647 · -2.1%
- By 2040
- 23,176 · -7.9%
- By 2050
- 21,605 · -14.2%
- By 2075
- 18,429 · -26.8%
- By 2100
- 14,394 · -42.8%
Race, ethnicity, and origin ACS 2023
- Neighborhood character
- Predominantly White (93%)
- Race & ethnicity
- White 93% Two or more races 3% Hispanic / Latino 2% Black 1% Native American 1%
- Common ancestry
- Lithuanian 8% Romanian 7% Portuguese 3%
- Foreign-born
- 2% · Canada
- Languages at home
- 98% English-only · Other Indo-European 1%
Political lean MEDSL · Dickinson
- 2024 margin
- Solid R (+36.3) · D 31.1% · R 67.4% · Other 1.5%
- 2008→2024 swing
- -28.4pp toward R · 2008: -7.9pp · 2024: -36.3pp
- All cycles
- 2024: R+36.3 2020: R+33.4 2016: R+35.4 2012: R+21.4 2008: R+7.9
Not yet ingested
- Civics
- —
Market trends
- HPI YoY
- ▼ -73.55%
- Current HPI
- 191.087
- Rent YoY
- —
- Metro
- —
- State GDP YoY
- ▲ 1.37%
- F500 in state
- 28
Industry mix (Fortune 500 HQ in MI)
| Industry | F500 HQs | Revenue |
|---|---|---|
| Automotive Parts | 3 | $48B |
|
||
| Automotive | 2 | $372B |
|
||
| Chemicals | 1 | $45B |
|
||
| Automotive Retail | 1 | $29B |
|
||
| Healthcare / Medical Devices | 1 | $23B |
|
||
| Automotive Technology | 1 | $20B |
|
||
Price history
-41.2% since first listed5 events — show timeline
- 2026-06-17 Price Changed $25,000 MiRealSource-MiMLS
- 2026-05-27 Price Changed $30,000 MiRealSource-MiMLS
- 2026-05-21 Price Changed $35,000 MiRealSource-MiMLS
- 2026-05-13 Price Changed $39,900 MiRealSource-MiMLS
- 2026-04-27 Listed $42,500 MiRealSource-MiMLS
Property tax history
-0.2%/yrLatest (2025): $35 · -10.4% YoY. Source: county tax records.
Cash-flow waterfall
monthlySold comps — $/sqft
last 12 mo · ≤1 miLoading sold comps…