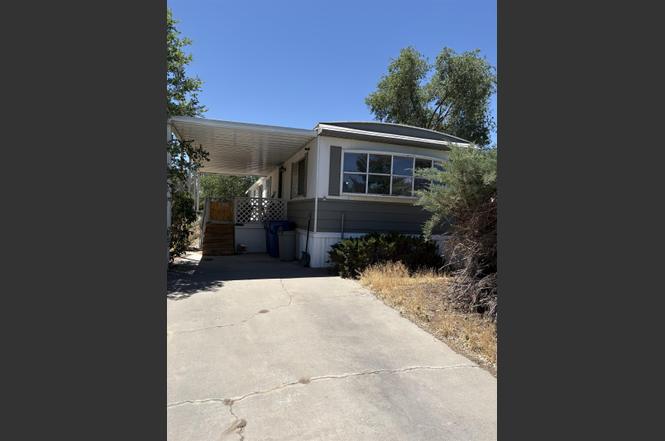
2969 1/2 Texas Ave · Grand Junction, CO
Flood risk 1/10 · Minimal
- FEMA flood zone
- X (unshaded)
- Chance of flooding over 30 yrs
- 0.0%
- Est. flood insurance / yr
- $507 – $1,088
Fire risk 1/10 · Minimal
- Est. fire insurance / yr
- $939 – $1,743
Heat risk 5/10 · Moderate
- Hot days now (above 95°F)
- 7 days/yr
- Hot days in 30 yrs
- 18 days/yr
Wind risk 1/10 · Minimal
- Chance of severe wind over 30 yrs
- —
Air-quality risk 2/10 · Minimal
- Unhealthy air days now
- 1 days/yr
- Unhealthy air days in 30 yrs
- 1 days/yr
Risk factors via First Street. Map © Google.
Why this score? — see what drove the D+ grade
The composite is a weighted blend of 9 inputs, each scored 0–100. Each bar is that input's sub-score; the figure is the points it added to the 100-point composite (weight × sub-score).
- ARV discount +15.0/15.0
- Cash flow +12.5/30.0
- Livability +4.0/5.0
- DSCR +3.7/10.0
- 1% rule +3.6/10.0
- Rent growth +3.3/5.0
- Schools +2.8/10.0
- Condition / age +2.2/5.0
- Appreciation +0.0/10.0
$145,000
🖨 Deal sheet (PDF) 📄 Offer letter ✓ Due diligence
Listing remarks
Looking for a good investment or an affordable opportunity to build equity and make this home your own. There is no lot rent or HOA and it is conveniently located in the Centennial 76 subdivision near 29 1/2 and North. The seller has already removed all the flooring, giving you a blank slate to choose and install your preferred flooring. Priced to sell quickly and reflect its current condition, the home is being sold as-is. Features include a newer furnace, all appliances (including the washer and dryer), 2 sheds (larger one is 10x20), East facing covered front deck, and an open deck in the back. The property has a sprinkler system, but the seller has no knowledge of its condition or funct
Key facts
- Newer furnace
- No lot rent
- 2 sheds
Tags
Property features AI
Exterior
- Utilities: Public water; Sewer connected
- Home design: Residential mobile home (single wide); Faces north
- Construction: Metal siding; Metal roof
- Exterior features: Deck; Sprinklers in rear; Outbuilding / shed
Interior
- Kitchen: Dishwasher; Electric oven; Electric range; Garbage disposal; Refrigerator
- Heating & cooling: Forced air heating; Ceiling fan(s) (for cooling), no central air
- Interior features: Ceiling fans; Laminate counters; Window coverings
- Laundry & utility: Washer included; Washer hookup
Neighborhood map
What this means for you Summary
Snapshot
- This is a 2-bed/1.0-bath manufactured listed at $145k. Condition is rated fair.
Deal economics
- At list price, monthly cash flow is $-20 ($-246/yr) — negative.
- To cash-flow at today's rent, offer at most $142k (2.0% below list).
- To meet the 1% rule (rent ≥ 1% of price), the offer needs to be $124k (14.3% below list).
- Recommended offer: $124k (14.3% below list) — sets the bar for 1% rule.
- Cap rate 6.1% vs local median 3.1% in Grand Junction — top-decile yield for the area; either an underpriced asset or a hidden risk that comps aren't pricing in. Stress-test before assuming the spread holds.
Location & tenants
- Location reads 79/100 on livability (#15 in CO, #2,222 nationally) — a middle-class / working-renter tenant base. Strengths: commute A+, health & safety A+, housing A; Watch: employment D+, crime F.
- Mesa County Valley School District No. 51 (suburban): math 26% / reading 38% proficiency, ranked #43 of 86 in CO (top 50%) — families likely to look elsewhere, expect single-tenant / working-renter base with shorter leases.
- Zoned schools: Fruitvale Elementary School (math 22% / reading 32%, grade F, #568 of 966 statewide, top 60%, 412 students, 59% FRL); Bookcliff Middle School (math 18% / reading 26%, grade F, #188 of 270 statewide, top 72%, 449 students, 59% FRL); Central High School (math 19% / reading 43%, grade F, #229 of 381 statewide, top 60%, 1,613 students, 45% FRL) — zoned schools average 54% FRL vs 39% district-wide (15 pts higher); higher-poverty schools than district average — tighter screening recommended.
- Market conditions: Rents rising (+3.2%/yr); 292 active listings in the ZIP; 9 comparable units currently listed for rent nearby; rentals at typical pace (median 24d on market — plan ~3-4 weeks tenant-placement turnaround); 1,014 units permitted in Mesa County in 2024 (240 in 5+ unit buildings).
Forward outlook
- Local home prices are declining (-3.0%/yr); year-one equity from $1k of loan paydown is wiped out by about $4k of value loss. Plan a longer hold.
Negotiation context
- Only 5 days on market — expect competitive offers; lowballing is unlikely to land.
Risks & watch-outs
- Climate carrying-cost: extreme-heat days projected 7→18/yr by 2055 (HVAC capex compounding) — expect insurance premiums to compound above CPI over the hold.
Questions for the listing agent
- What do current leases actually rent for vs. the listed asking? Can we see a recent rent roll and the last 12 months of T-12 income?
- Have any recent inspections been done? Can we get a copy of the seller's disclosures and any deferred-maintenance estimates?
- Built in 1978 — when were the roof, HVAC, electrical panel, plumbing, and water heater last replaced?
- Is there a deadline driving the sale (1031 exchange, divorce, estate, relocation)? That informs how much negotiation room exists.
- Schools are D-rated, which usually means shorter tenancies and higher turnover. Who's the typical renter profile here, and what's been the actual vacancy rate?
- Crime grade is F in this area — have there been break-ins, vandalism, or insurance claims at this property in the last 3 years? What carrier currently insures it and at what premium?
- The area grade is low — what's the realistic commute time and amenity access for the typical tenant pool here? Any planned neighborhood developments (good or bad) we should know about?
- What's the average days-on-market for RENTAL listings here right now (not sales)? A rising rental-DOM trend means longer vacancies and softer asking-rent achievability than the comps imply.
- What's the recent tenant-quality profile in this submarket — average credit score on applications, eviction rate, late-payment / NSF rate, and stable-employment percentage? A property-management company in the area should have these aggregated.
- How much new for-sale + rental construction is in the pipeline within 1–3 miles? Heavy new supply typically softens prices + rents 12–24 months out; constrained supply supports both.
Investment metrics
- 1% rule
- 0.86% ✗
- Cap rate
- 6.12%
- Cash-on-cash
- -0.61%
- DSCR
- 0.97
- GRM
- 9.7
CMA / ARV
- ARV (on-the-fly)
- $198,856
- Comps found
- 12
Show comp detail 12 sales within ~0.75 mi
| Address | Dist | Beds/Ba | Sqft | Sold | Price | $/sf | Match |
|---|---|---|---|---|---|---|---|
| 2960 Texas Ave | 0.11mi | 2/2.0 | 938 (0%) | 7mo | $230,000 | $245 | 85 |
| 552 E View Dr | 0.25mi | 2/1.0 | 928 (-1%) | 2mo | $189,000 | $204 | 85 |
| 2962 Texas Ave | 0.10mi | 2/1.0 | 891 (-5%) | 9mo | $175,000 | $196 | 80 |
| 2959 Texas Ave | 0.11mi | 3/2.0 (+1) | 924 (-2%) | 6mo | $170,000 | $184 | 78 |
| 2972 Hall Ave | 0.21mi | 2/1.0 | 938 (0%) | 14mo | $199,000 | $212 | 78 |
| 2987 Kennedy Ave | 0.18mi | 2/2.0 | 900 (-4%) | 22mo | $260,000 | $289 | 62 |
| 2910 North Ave Unit 8B | 0.61mi | 2/2.0 | 952 (+2%) | 8mo | $23,000 | $24 | 59 |
| 2958 1/2 Sandra Ave | 0.15mi | 3/2.0 (+1) | 1,008 (+8%) | 16mo | $240,000 | $238 | 59 |
| 531 Centennial Rd | 0.09mi | 3/2.0 (+1) | 1,008 (+8%) | 21mo | $250,000 | $248 | 57 |
| 551 Sunrise Dr | 0.29mi | 3/2.0 (+1) | 1,064 (+13%) | 4mo | $150,000 | $141 | 52 |
| 2956 Parkway Dr | 0.49mi | 3/2.0 (+1) | 924 (-2%) | 19mo | $262,000 | $284 | 50 |
| 2960 Cedar Pl | 0.42mi | 3/2.0 (+1) | 868 (-8%) | 22mo | $141,200 | $163 | 40 |
Match score weights: distance 35% · size 25% · config 20% · recency 20%. Top-matched comps best support the ARV.
Projected returns pro-forma
-3.0% appreciation · 3.2% rent growth · sell at horizon
- IRR
- -17.1%
- Equity multiple
- 0.40×
- Total profit
- $-24,531
- Equity at exit
- $21,620
- IRR
- -8.6%
- Equity multiple
- 0.46×
- Total profit
- $-21,933
- Equity at exit
- $12,537
Cash invested: $40,600 (down + closing). Projections, not guarantees.
Landlord ↔ Tenant lean methodology
- Overall (STATE)
- 38 Tenant-Leaning
- State Colorado
- 38 Tenant-Leaning · D+4
- County
- — inherits STATE
- City
- — inherits STATE
ZIP-level market 81504
- Rents YoY
- 3.2%
- Active inventory
- 292
- Price-to-rent
- 9.7×
Monthly cashflow live
- Estimated rent
- $1,243 high interval (Pro) →
- Mortgage (P&I)
- −$760
- Tax est. 1.5%
- −$181 /mo · $2,175/yr
- Insurance
- −$60
- HOA
- −$0
- Lot rent leased land?
- −$0
- Vacancy / Maint / Mgmt
- −$261
- Net cashflow
- $-20
Break-even live
Sensitivity live
| Price | -10% $80 | -5% $30 | +0% $-20 | +5% $-71 | +10% $-121 |
|---|---|---|---|---|---|
| Rent | -10% $-119 | -5% $-70 | +0% $-20 | +5% $29 | +10% $78 |
| Rate | -1.0pp $53 | -0.5pp $16 | base $-20 | +0.5pp $-58 | +1.0pp $-96 |
UW: 25.0% down · 7.5% · 30yr · 1.5% tax · 5.0% vac · 8.0% maint · 8.0% mgmt
Financing live
Cash to close
- Down payment
- $36,250
- Closing costs
- $4,350
- Reserves months
- —
- Total cash needed
- —
Loan-product check · same deal, 3 products live
Conventional
25% down · 7.5% · 30yr
- Down + closing
- —
- Monthly P&I
- —
- Monthly cashflow
- —
- DSCR
- —
- Eligible?
- —
Personal DTI + credit; lowest rate.
DSCR
20% down · 8.5% · 30yr
- Down + closing
- —
- Monthly P&I
- —
- Monthly cashflow
- —
- DSCR
- —
- Eligible?
- —
No personal income docs; deal must DSCR.
Hard money
10% down · 12.0% · 12mo
- Down + closing
- —
- Monthly P&I
- —
- Monthly cashflow
- —
- DSCR
- —
- Eligible?
- —
Short-term bridge; refi at stabilization.
Rent comps 9 comps
| Address | Beds | Baths | Sqft | Rent | $/sqft | DOM | Units | Dist |
|---|---|---|---|---|---|---|---|---|
| 541-529 E 1/2 Rd Grand Junction, CO | 1.0–2.0 | 1.0 | 687 | $1,510 | $2.20 | 16d | 1 | 0.31mi |
| 2961 1/2 Cedar Pl Grand Junction, CO | 2.0 | 1.0 | 720 | $1,250 | $1.74 | 23d | 1 | 0.39mi |
| 2909 Dawn Dr Grand Junction, CO | 2.0 | 1.5 | 950 | $1,650 | $1.74 | 23d | 1 | 0.74mi |
| 2907 Dawn Dr Grand Junction, CO | 3.0 | 1.5 | 1000 | $1,650 | $1.65 | 16d | 1 | 0.76mi |
| 2907 Dawn Dr Unit 4 Grand Junction, CO | 3.0 | 1.5 | 1000 | $1,650 | $1.65 | 23d | 1 | 0.76mi |
| 568 Dawn Ct Unit 1 Grand Junction, CO | 2.0 | 1.0 | 1038 | $1,100 | $1.06 | 16d | 1 | 0.77mi |
| 451 Davis Rd Grand Junction, CO | 2.0 | 1.0 | 1102 | $1,400 | $1.27 | 23d | 1 | 1.04mi |
| 2855 Elm Cir Unit 35 Grand Junction, CO | 2.0 | 1.0 | 840 | $1,050 | $1.25 | 23d | 1 | 1.16mi |
| 521 28 1/2 Rd Grand Junction, CO | 3.0 | 1.0 | 1040 | $2,100 | $2.02 | 23d | 1 | 1.22mi |
Listing history 5 events
-
2026-06-23days on market $145,000 Active 5 DOM
-
2026-06-21days on market $145,000 Active 4 DOM
-
2026-06-19days on market $145,000 Active 2 DOM
-
2026-06-18remarks 699-char remark
-
2026-06-18$145,000 Active 1 DOM
ⓘ Source: listings_history table (triggers on properties + properties_extension) + one-shot
backfill from property_details.listing_events for pre-trigger history.
Climate risk First Street
- Flood 1/10 Low FEMA zone X (unshaded) · 0% chance over 30 yrs
- Wildfire 1/10 Low
- Heat 5/10 Major 7 d/yr ≥95°F today · 18 d/yr by 30 yrs out
- Wind 1/10 Low
- Air quality 2/10 Low 1 unhealthy d/yr today · 1 by 30 yrs out
Nearby sold comps map
Loading sold comps map…
Walkable amenities ~0.75 mi
Loading nearby amenities…
Taxation est. · year 1
- Rental income
- $14,910
- − Mortgage interest
- −$8,122
- − Property taxes
- −$2,175
- − Insurance
- −$725
- − Repairs & maintenance
- −$1,193
- − Management
- −$1,193
- − Depreciation
- −$4,218
- Taxable loss
- −$2,716
- Est. tax savings @ 24.0%
- +$652
- After-tax cash flow
- $406/yr
For passive investors: Depreciation is non-cash, so a rental often shows a tax loss while cash-flowing — sheltering income. Rental losses are passive: they offset passive income freely, and up to $25,000/yr can offset ordinary (W-2) income if you actively participate and your MAGI is under $100k (phasing out to $0 by $150k); unused losses carry forward. On sale, claimed depreciation is recaptured at up to 25%, and gains may owe capital-gains tax (a 1031 exchange can defer both). Figures are a year-1 estimate at your 24.0% rate — not tax advice; consult a CPA.
Condition & rehab AI · 12 photos
This manufactured home requires moderate repairs and updates to improve its condition and value. Key areas for improvement include the kitchen and bathrooms, which need new flooring and cabinets. Painting and landscaping can also enhance the home's curb appeal.
Repairs flagged
- Major Exposed subfloor in kitchen — Structural damage
- Major Exposed subfloor in bathrooms — Structural damage
- Major Missing cabinets in kitchen — Aesthetic and functional issue
Value-add opportunities
- Both Replace flooring and cabinets in kitchen and bathrooms — Improves aesthetics and functionality
- Both Paint interior walls and trim — Enhances curb appeal and interior aesthetics
- Both Replace missing cabinets in kitchen — Improves functionality and aesthetics
- Both Replace missing flooring in bathrooms — Improves functionality and aesthetics
Renovation cost estimate screening
| Repair item | Severity | Est. cost |
|---|---|---|
| Exposed subfloor in kitchen · Structural damage | Major | $15,000–50,000 |
| Exposed subfloor in bathrooms · Structural damage | Major | $15,000–50,000 |
| Missing cabinets in kitchen · Aesthetic and functional issue | Major | $15,000–50,000 |
| Total estimated repair cost · 3 items | $45,000–150,000 |
Value-add ROI direction
- Both Replace flooring and cabinets in kitchen and bathrooms — Improves aesthetics and functionality ↑
- Both Paint interior walls and trim — Enhances curb appeal and interior aesthetics ↑
- Both Replace missing cabinets in kitchen — Improves functionality and aesthetics ↑
- Both Replace missing flooring in bathrooms — Improves functionality and aesthetics ↑
ⓘ Cost ranges are severity-bucket heuristics (US national rule-of-thumb). Get contractor quotes + a written scope before underwriting a rehab budget.
Schools (NCES district)
- District
- Mesa County Valley School District No. 51
- NCES district ID
- 0804350
- Math proficiency
- 26% ▲ 1.00%
- Reading proficiency
- 38% ▬ 0.00%
- Median HH income
- $50,189
- Composite
- 27.83/100
- National rank
- #6884
- State rank
- #43 of 86 in CO
Livability — Grand Junction
- Score
- 79/100
- State rank
- #15
- US rank
- #2222
Category grades
Schools grade is shown separately in the Schools card above.
Census & demographics
- County
- Mesa County · 143,088 people
- City population
- 113,583
- Metro
- Grand Junction, CO
- Population (ZIP)
- 32,376
- Household income
- $70,958
- Rent vs Own
- Severe rent burden
- 808.0
Population outlook (Mesa County) Hauer SSP2
- Today (2025)
- 153,000 people
- By 2030
- 154,479 · +1.0%
- By 2040
- 155,257 · +1.5%
- By 2050
- 153,384 · +0.3%
- By 2075
- 144,735 · -5.4%
- By 2100
- 123,825 · -19.1%
Race, ethnicity, and origin ACS 2023
- Neighborhood character
- Predominantly White (73%)
- Race & ethnicity
- White 73% Hispanic / Latino 21% Two or more races 18%
- Hispanic origin (detail)
- Mexican 13%
- Common ancestry
- Iranian 2% Slovak 2% Italian 2%
- Foreign-born
- 6% · Canada, Vietnam
- Languages at home
- 90% English-only · Spanish 8%
Political lean MEDSL · Mesa
- 2024 margin
- Strong R (+24.3) · D 36.6% · R 61.0% · Other 2.4%
- 2008→2024 swing
- +5.2pp toward D · 2008: -29.5pp · 2024: -24.3pp
- All cycles
- 2024: R+24.3 2020: R+28.0 2016: R+36.3 2012: R+32.8 2008: R+29.5
Not yet ingested
- Civics
- —
Market trends
- HPI YoY
- ▼ -345.40%
- Current HPI
- 309.0092
- Rent YoY
- ▲ 3.20%
- Metro
- Grand Junction, CO
- State GDP YoY
- ▲ 1.95%
- F500 in state
- 14
Industry mix (Fortune 500 HQ in CO)
| Industry | F500 HQs | Revenue |
|---|---|---|
| Technology Distribution | 1 | $31B |
|
||
| Food / Agriculture | 1 | $18B |
|
||
| Packaging | 1 | $14B |
|
||
| Healthcare | 1 | $13B |
|
||
| Energy | 1 | $10B |
|
||
| Technology | 1 | $4B |
|
||
Price history
1 event — show timeline
- 2026-06-17 Listed $145,000 GJARA
Cash-flow waterfall
monthlySold comps — $/sqft
last 12 mo · ≤1 miLoading sold comps…