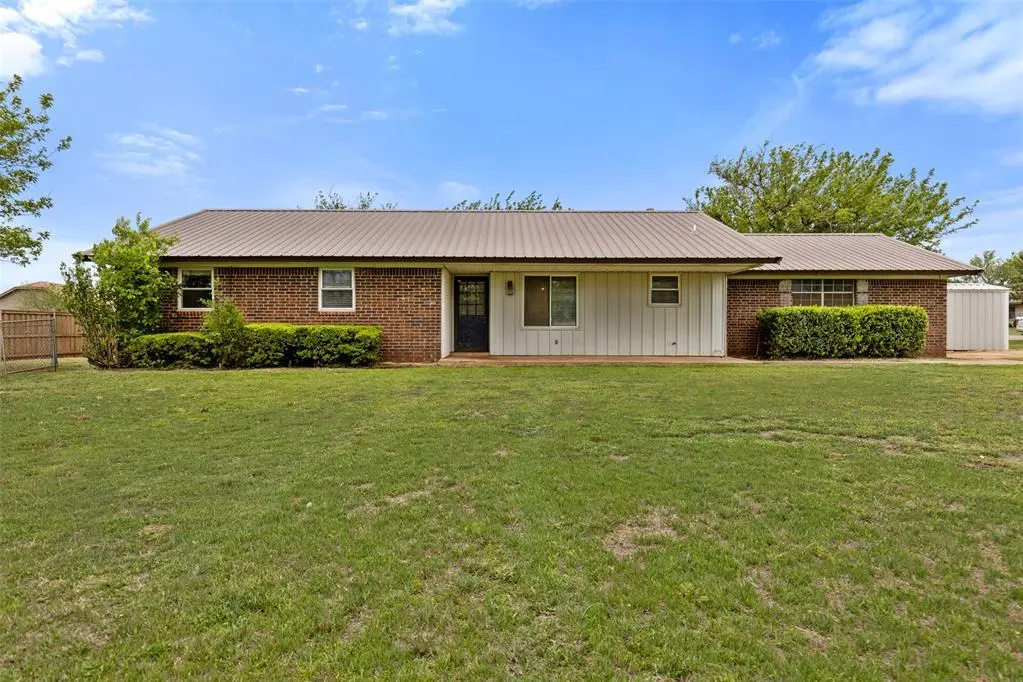
804 NW Tyler Ave · Piedmont, OK
Flood risk 1/10 · Minimal
- FEMA flood zone
- X (unshaded)
- Chance of flooding over 30 yrs
- 0.0%
- Est. flood insurance / yr
- $507 – $1,088
Fire risk 4/10 · Minor
- Est. fire insurance / yr
- $2,463 – $4,575
Heat risk 6/10 · Moderate
- Hot days now (above 107°F)
- 7 days/yr
- Hot days in 30 yrs
- 18 days/yr
Wind risk 3/10 · Minor
- Chance of severe wind over 30 yrs
- 4.0%
Air-quality risk 1/10 · Minimal
- Unhealthy air days now
- 0 days/yr
- Unhealthy air days in 30 yrs
- 0 days/yr
Risk factors via First Street. Map © Google.
Why this score? — see what drove the D+ grade
The composite is a weighted blend of 9 inputs, each scored 0–100. Each bar is that input's sub-score; the figure is the points it added to the 100-point composite (weight × sub-score).
- Cash flow +14.1/30.0
- ARV discount +11.1/15.0
- DSCR +4.3/10.0
- Livability +3.9/5.0
- Schools +3.6/10.0
- 1% rule +3.3/10.0
- Rent growth +2.5/5.0
- Condition / age +2.5/5.0
- Appreciation +0.0/10.0
$225,000
🖨 Deal sheet 📄 Offer letter ✓ Due diligence
Listing remarks
Welcome home to this beautifully maintained 3-bedroom, 2-bathroom gem in one of Piedmont's most sought-after locations. Sitting on an expansive corner lot of nearly half an acre, this move-in ready property offers the space, charm, and convenience today's buyers are looking for. Step inside and be greeted by a warm, inviting living room anchored by a stunning fireplace — the perfect centerpiece for cozy evenings and effortless entertaining. The thoughtful floor plan flows naturally through the home, while the primary suite offers a private en suite bath for a true retreat at the end of the day. Out back, you'll find your own private oasis. The enclosed back porch extends your living s
Key facts
- Enclosed back porch
- Private oasis
- Corner lot
Tags
Property features AI
Finance
- Other: Homestead status: homestead claimed; Located in Golden Hills addition; No storm shelter; Corner lot approximately 0.4663 acres; Property listed as active
- Financial info: Loan qualification possible
- HOA & community: No mandatory association dues
Exterior
- Parking: 2-car garage
- Home design: Single-family residence; Residential property; Existing construction
- Construction: Brick and frame construction; Metal roof; Built on slab foundation
- Exterior features: Covered patio; Covered porch; Corner lot
Interior
- Bedrooms: 3 bedrooms
- Bathrooms: 2 full bathrooms
- Heating & cooling: Wood-burning fireplace (1)
- Interior features: One-level home; Living area based on assessor records; Slab foundation
Neighborhood map
What this means for you Summary
Snapshot
- This is a 3-bed/2.0-bath single-family listed at $225k.
Deal economics
- At list price, monthly cash flow is $34 ($407/yr) — positive.
- The deal already cash-flows at list — no discount required.
- To meet the 1% rule (rent ≥ 1% of price), the offer needs to be $186k (17.4% below list).
- Recommended offer: $186k (17.4% below list) — sets the bar for 1% rule.
- Cap rate 6.5% vs local median 3.3% in Piedmont — top-decile yield for the area; either an underpriced asset or a hidden risk that comps aren't pricing in. Stress-test before assuming the spread holds.
Location & tenants
- Location reads 77/100 on livability (#8 in OK, #2,866 nationally) — a middle-class / working-renter tenant base. Strengths: crime A+, employment A+, housing A+; Watch: health & safety C-, amenities F, commute F.
- Piedmont (rural): math 37% / reading 39% proficiency, ranked #9 of 270 in OK (top 3%) — families likely to look elsewhere, expect single-tenant / working-renter base with shorter leases; only 15% free/reduced lunch — higher-income household profile.
- Zoned schools: Piedmont Es (math 52% / reading 37%, grade F, #63 of 845 statewide, top 8%, 458 students, 0% FRL); Piedmont Hs (math 38% / reading 44%, grade F, #24 of 447 statewide, top 5%, 1,422 students, 0% FRL).
- Market conditions: 494 active listings in the ZIP; solid renter incomes; 260 units permitted in Canadian County in 2024 (0 in 5+ unit buildings).
Forward outlook
- Local home prices are declining (-3.0%/yr); year-one equity from $2k of loan paydown is wiped out by about $7k of value loss. Plan a longer hold.
- Canadian County population projected at +64% by 2050 — long-run rental-demand tailwind backs the buy-and-hold thesis.
Negotiation context
- It's been on market 26 days — a 2% lower offer ($222k) is reasonable based on typical stale-listing flexibility.
- Current owner paid $128k; list at $225k implies a 76% gain — meaningful room to come down on a strong offer.
Risks & watch-outs
- Climate carrying-cost: extreme-heat days projected 7→18/yr by 2055 (HVAC capex compounding) — expect insurance premiums to compound above CPI over the hold.
Questions for the listing agent
- Built in 1975 — when were the roof, HVAC, electrical panel, plumbing, and water heater last replaced?
- Is there a deadline driving the sale (1031 exchange, divorce, estate, relocation)? That informs how much negotiation room exists.
- Schools are B-rated — typically a magnet for longer-tenancy family renters. What's the average tenant stay here, and is there a school-zone premium baked into asking?
- The area grade is low — what's the realistic commute time and amenity access for the typical tenant pool here? Any planned neighborhood developments (good or bad) we should know about?
- What's the average days-on-market for RENTAL listings here right now (not sales)? A rising rental-DOM trend means longer vacancies and softer asking-rent achievability than the comps imply.
- What's the recent tenant-quality profile in this submarket — average credit score on applications, eviction rate, late-payment / NSF rate, and stable-employment percentage? A property-management company in the area should have these aggregated.
- How much new for-sale + rental construction is in the pipeline within 1–3 miles? Heavy new supply typically softens prices + rents 12–24 months out; constrained supply supports both.
Investment metrics
- 1% rule
- 0.83% ✗
- Cap rate
- 6.47%
- Cash-on-cash
- 0.65%
- DSCR
- 1.03
- GRM
- 10.1
CMA / ARV
- ARV (on-the-fly)
- $244,584
- Comps found
- 12
Show comp detail 12 sales within ~0.75 mi
| Address | Dist | Beds/Ba | Sqft | Sold | Price | $/sf | Match |
|---|---|---|---|---|---|---|---|
| 924 NW Taylor Ave | 0.14mi | 3/2.0 | 1,433 (+1%) | 10mo | $255,000 | $178 | 83 |
| 601 NW Van Buren Ave | 0.16mi | 3/2.0 | 1,350 (-5%) | 6mo | $227,500 | $169 | 79 |
| 910 NW Taylor Ave | 0.13mi | 3/2.0 | 1,516 (+7%) | 12mo | $250,000 | $165 | 73 |
| 1174 NW Misty Ln | 0.40mi | 3/2.0 | 1,510 (+6%) | 0mo | $254,000 | $168 | 71 |
| 868 Phils Way | 0.38mi | 3/2.0 | 1,398 (-2%) | 11mo | $252,500 | $181 | 70 |
| 213 Monroe Ave NW | 0.43mi | 3/2.5 | 1,483 (+4%) | 1mo | $245,000 | $165 | 70 |
| 812 NW Phils Way | 0.39mi | 3/2.0 | 1,367 (-4%) | 10mo | $235,000 | $172 | 67 |
| 409 NW Jefferson Ave | 0.46mi | 3/2.0 | 1,355 (-5%) | 8mo | $235,000 | $173 | 64 |
| 923 NW Tyler Ave | 0.09mi | 4/2.0 (+1) | 1,269 (-11%) | 14mo | $200,000 | $158 | 61 |
| 519 5th St | 0.23mi | 3/2.0 | 1,608 (+13%) | 12mo | $230,000 | $143 | 58 |
| 511 NW Jefferson Ave | 0.42mi | 3/2.0 | 1,225 (-14%) | 10mo | $215,000 | $176 | 49 |
| 1214 Carrie Ln | 0.55mi | 3/2.0 | 1,610 (+13%) | 6mo | $300,000 | $186 | 47 |
Match score weights: distance 35% · size 25% · config 20% · recency 20%. Top-matched comps best support the ARV.
Projected returns pro-forma
-3.0% appreciation · 3.0% rent growth · sell at horizon
- IRR
- -15.3%
- Equity multiple
- 0.45×
- Total profit
- $-34,345
- Equity at exit
- $33,548
- IRR
- -6.8%
- Equity multiple
- 0.57×
- Total profit
- $-27,310
- Equity at exit
- $19,454
Cash invested: $63,000 (down + closing). Projections, not guarantees.
Landlord ↔ Tenant lean methodology
- Overall (STATE)
- 83 Strongly Landlord-Friendly
- State Oklahoma
- 83 Strongly Landlord-Friendly · R+20
- County
- — inherits STATE
- City
- — inherits STATE
ZIP-level market 73078
- Home prices YoY
- -14.2%
- Active inventory
- 494
- Price-to-rent
- 10.1×
Monthly cashflow live
- Estimated rent
- $1,859 medium interval (Pro) →
- Mortgage (P&I)
- −$1,180
- Tax from tax record
- −$161 /mo · $1,936/yr
- Insurance
- −$94
- HOA
- −$0
- Vacancy / Maint / Mgmt
- −$390
- Net cashflow
- $34
Break-even live
UW: 25.0% down · 7.5% · 30yr · 1.5% tax · 5.0% vac · 8.0% maint · 8.0% mgmt
Financing live
Cash to close
- Down payment
- $56,250
- Closing costs
- $6,750
- Reserves months
- —
- Total cash needed
- —
Loan-product check · same deal, 3 products live
Conventional
25% down · 7.5% · 30yr
- Down + closing
- —
- Monthly P&I
- —
- Monthly cashflow
- —
- DSCR
- —
- Eligible?
- —
Personal DTI + credit; lowest rate.
DSCR
20% down · 8.5% · 30yr
- Down + closing
- —
- Monthly P&I
- —
- Monthly cashflow
- —
- DSCR
- —
- Eligible?
- —
No personal income docs; deal must DSCR.
Hard money
10% down · 12.0% · 12mo
- Down + closing
- —
- Monthly P&I
- —
- Monthly cashflow
- —
- DSCR
- —
- Eligible?
- —
Short-term bridge; refi at stabilization.
Listing history 4 events
-
2026-05-19status Pending
-
2026-04-23$225,000 Active
-
2019-06-18soldstatus $128,000
-
1995-03-09soldstatus $54,000
ⓘ Source: listings_history table (triggers on properties + properties_extension) + one-shot
backfill from property_details.listing_events for pre-trigger history.
Tax reassessment forecast OK · Resets to sale price
- Current annual tax
- $1,936 · $161/mo
- Projected year-2 tax
- $2,025 · $169/mo
- Expected delta
- +$89/yr (+$7/mo · 4.6%)
ⓘ Screening estimate from a state-policy table — verify with the county assessor before closing.
Climate risk First Street
- Flood 1/10 Low FEMA zone X (unshaded) · 0% chance over 30 yrs
- Wildfire 4/10 Moderate
- Heat 6/10 Major 7 d/yr ≥107°F today · 18 d/yr by 30 yrs out
- Wind 3/10 Moderate 4% chance of damaging wind over 30 yrs
- Air quality 1/10 Low 0 unhealthy d/yr today · 0 by 30 yrs out
Nearby sold comps map
Loading sold comps map…
Walkable amenities ~0.75 mi
Loading nearby amenities…
Taxation est. · year 1
- Rental income
- $22,313
- − Mortgage interest
- −$12,603
- − Property taxes
- −$1,936
- − Insurance
- −$1,125
- − Repairs & maintenance
- −$1,785
- − Management
- −$1,785
- − Depreciation
- −$6,545
- Taxable loss
- −$3,467
- Est. tax savings @ 24.0%
- +$832
- After-tax cash flow
- $1,239/yr
For passive investors: Depreciation is non-cash, so a rental often shows a tax loss while cash-flowing — sheltering income. Rental losses are passive: they offset passive income freely, and up to $25,000/yr can offset ordinary (W-2) income if you actively participate and your MAGI is under $100k (phasing out to $0 by $150k); unused losses carry forward. On sale, claimed depreciation is recaptured at up to 25%, and gains may owe capital-gains tax (a 1031 exchange can defer both). Figures are a year-1 estimate at your 24.0% rate — not tax advice; consult a CPA.
Schools (NCES district)
- District
- Piedmont
- NCES district ID
- 4023970
- Math proficiency
- 37% ▼ -15.00%
- Reading proficiency
- 39% ▼ -9.00%
- Median HH income
- $83,943
- Composite
- 36.08/100
- National rank
- #4762
- State rank
- #9 of 270 in OK
Livability — Piedmont
- Score
- 77/100
- State rank
- #8
- US rank
- #2866
Category grades
Schools grade is shown separately in the Schools card above.
Census & demographics
- Census place
- Piedmont, OK
- County
- Canadian County · 154,341 people
- City population
- 13,021
- Metro
- Oklahoma City, OK
- Population (ZIP)
- 13,021
- Household income
- $105,441
- Rent vs Own
- Severe rent burden
- 48.0
Population outlook (Canadian County) Hauer SSP2
- Today (2025)
- 174,062 people
- By 2030
- 195,170 · +12.1%
- By 2040
- 239,293 · +37.5%
- By 2050
- 285,457 · +64.0%
- By 2075
- 403,766 · +132.0%
- By 2100
- 498,766 · +186.5%
Race, ethnicity, and origin ACS 2023
- Neighborhood character
- Predominantly White (77%)
- Race & ethnicity
- White 77% Two or more races 11% Hispanic / Latino 10% Black 3% Asian 3% Native American 1%
- Hispanic origin (detail)
- Mexican 8%
- Common ancestry
- Slovak 4% Iranian 3% Serbian 1%
- Foreign-born
- 4% · Canada, Vietnam
- Languages at home
- 93% English-only · Spanish 5%
Political lean MEDSL · Canadian
- 2024 margin
- Solid R (+40.4) · D 28.8% · R 69.2% · Other 2.0%
- 2008→2024 swing
- +11.9pp toward D · 2008: -52.2pp · 2024: -40.4pp
- All cycles
- 2024: R+40.4 2020: R+43.3 2016: R+51.2 2012: R+54.4 2008: R+52.2
Not yet ingested
- Civics
- —
Market trends
- HPI YoY
- ▼ -43.50%
- Current HPI
- 262.6535
- Rent YoY
- —
- Metro
- Oklahoma City, OK
- State GDP YoY
- ▲ 1.55%
- F500 in state
- 6
Industry mix (Fortune 500 HQ in OK)
| Industry | F500 HQs | Revenue |
|---|---|---|
| Energy | 3 | $48B |
|
||
Price history
+316.7% since first listed4 events — show timeline
- 2026-05-19 Pending — MLSOK
- 2026-04-23 Listed $225,000 MLSOK
- 2019-06-18 Sold (Public Records) $128,000 Public Records
- 1995-03-09 Sold (Public Records) $54,000 Public Records
Property tax history
+5.1%/yrLatest (2025): $1,936 · +4.3% YoY. Source: county tax records.
Cash-flow waterfall
monthlySold comps — $/sqft
last 12 mo · ≤1 miLoading sold comps…