 24-Plex
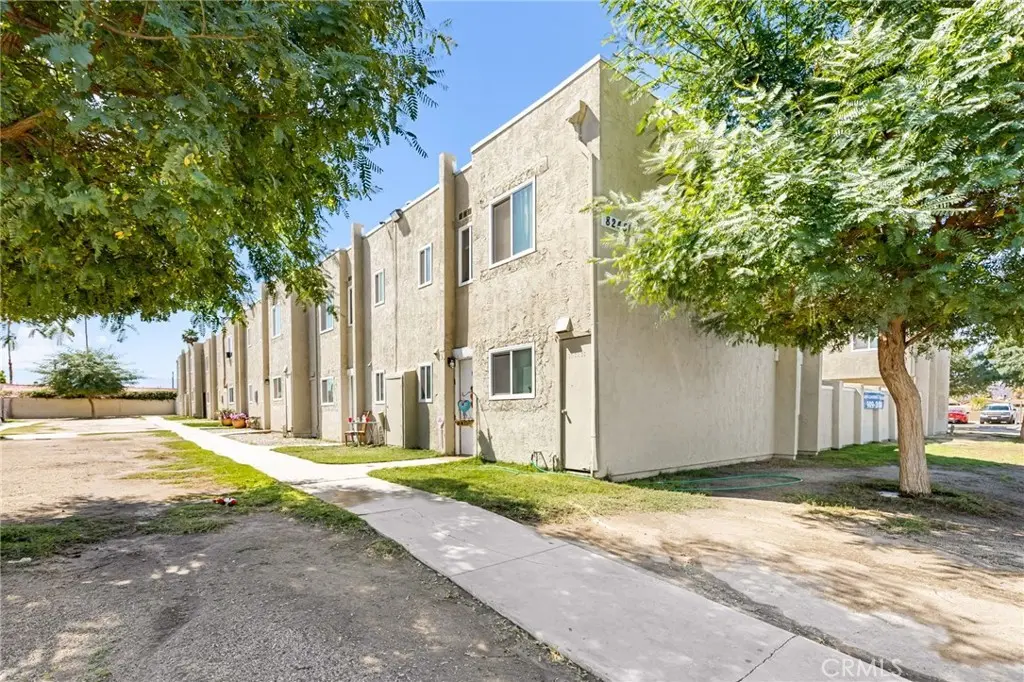
82451 John Nobles · Indio, CA
Flood risk 1/10 · Minimal
- FEMA flood zone
- X (unshaded)
- Chance of flooding over 30 yrs
- 0.0%
- Est. flood insurance / yr
- $507 – $1,088
Fire risk 3/10 · Minor
- Est. fire insurance / yr
- $659 – $1,223
Heat risk 10/10 · Severe
- Hot days now (above 114°F)
- 7 days/yr
- Hot days in 30 yrs
- 19 days/yr
Wind risk 1/10 · Minimal
- Chance of severe wind over 30 yrs
- —
Air-quality risk 3/10 · Minor
- Unhealthy air days now
- 3 days/yr
- Unhealthy air days in 30 yrs
- 5 days/yr
Risk factors via First Street. Map © Google.
Why this score? — see what drove the C- grade
The composite is a weighted blend of 9 inputs, each scored 0–100. Each bar is that input's sub-score; the figure is the points it added to the 100-point composite (weight × sub-score).
- Cash flow +20.8/30.0
- ARV discount +7.5/15.0
- DSCR +6.6/10.0
- 1% rule +5.1/10.0
- Schools +3.8/10.0
- Rent growth +3.3/5.0
- Livability +2.7/5.0
- Condition / age +2.5/5.0
- Appreciation +0.0/10.0
$5,695,000
🖨 Deal sheet (PDF) 📄 Offer letter ✓ Due diligence
Multi-family units
County records classify this as Multi-Family (5+ Unit). Listing-text estimate: 24 units. confirmed
5+ unit building — per-unit beds/baths from public records are typically unavailable; the breakdown below (if shown) is an estimate from the listing text.
Listing remarks MLS
TRUE +7% CAP - John Nobles Townhomes - Multi-Family - Current CAP Rate of 7.13%, ProForma CAP Rate of 7.74%. All units have been fully renovated & re-tenanted at market-rate rents across the property. / All Two-Story Townhouse Style Units - Unparalleled unit mix of (16) 3 Bed 1.5 Bath townhomes & (8) 4 Bed 2 Bath townhomes. / Over $1,000,000 in recent capital improvements, including all new roofing, HVAC unit replacements, full interior and exterior renovations. The John Nobles Apartments, a freshly renovated 24-unit apartment complex located in sunny Indio, CA. Built in 1980, the apartments are located on a 1.280 acre lot. The two buildings are composed of Sixteen (16) Three-Bedroom units & Eight (8) Four-Bedroom units, all featuring a spacious & comfortable 2-story townhome design. Amenities include onsite parking, essential appliances in each unit & private vinyl-fenced backyards.
Key facts
- Fully renovated
- New roofing
- 1.28 acre lot
Tags
Neighborhood map
What this means for you Summary
Snapshot
- This is a 24 × 3.0-bed/1.5-bath units multifamily listed at $5.70M.
Deal economics
- At list price, monthly cash flow is $8k ($94k/yr) — positive. Per door: $326/mo.
- The deal already cash-flows at list — no discount required.
- Meets the 1% rule at list price ($57k rent vs $5.70M).
- Recommended offer: $5.01M (12.0% below list) — sets the bar for market timing.
- Cap rate 7.9% vs local median 4.3% in Indio — top-decile yield for the area; either an underpriced asset or a hidden risk that comps aren't pricing in. Stress-test before assuming the spread holds.
Location & tenants
- Location reads 53/100 on livability (#927 in CA) — a working-class tenant base; expect higher turnover. Strengths: housing B+; Watch: employment D, crime F, amenities F.
- Desert Sands Unified (suburban): math 31% / reading 56% proficiency, ranked #199 of 517 in CA (top 38%) — families likely to look elsewhere, expect single-tenant / working-renter base with shorter leases.
- Zoned schools: Theodore Roosevelt Elementary (492 students, 86% FRL); Thomas Jefferson Middle (538 students, 93% FRL); Indio High (math 15% / reading 42%, grade F, #774 of 1,170 statewide, top 66%, 2,143 students, 92% FRL) — zoned schools average 90% FRL vs 56% district-wide (34 pts higher); higher-poverty schools than district average — tighter screening recommended.
- Zoned-school proficiency averages 28% at this address vs 44% district-wide (-15 pts) — the specific schools serving this property underperform the Desert Sands Unified average; the district grade overstates school quality for this exact location.
- Market conditions: Rents rising (+3.3%/yr); 515 active listings in the ZIP; 9,195 units permitted in Riverside County in 2024 (1,512 in 5+ unit buildings).
- At $57,426/mo this rent would consume 1032% of the median local household income ($67k/yr) (locally 2036% of renters already pay >50% of income on rent) — very limited rent-growth headroom before tenants either downsize or default.
Forward outlook
- Local home prices are declining (-3.0%/yr); year-one equity from $39k of loan paydown is wiped out by about $171k of value loss. Plan a longer hold.
- Riverside County population projected at +22% by 2050 — long-run rental-demand tailwind backs the buy-and-hold thesis.
Negotiation context
- It's been on market 150 days — a 12% lower offer ($5.01M) is reasonable based on typical stale-listing flexibility.
- 8 sale attempts since 3y ago with the ask held roughly flat each time — persistent listings suggest the price (not the market) is what's stuck; bring a comps-based counter.
- Current owner paid $380k; list at $5.70M implies a 1399% gain — meaningful room to come down on a strong offer.
Risks & watch-outs
- Climate carrying-cost: extreme-heat days projected 7→19/yr by 2055 (HVAC capex compounding) — expect insurance premiums to compound above CPI over the hold.
Questions for the listing agent
- It's been on market 150 days. Have you received any prior offers? Is the seller open to a 12% concession, seller financing, or rate buy-down credit?
- Can we see the unit-by-unit rent roll, current vacancy, and any below-market leases? What's the average tenancy length?
- What capital expenditures (roof, boiler, parking lot, exteriors) have been made in the last 5 years, and what's planned in the next 2?
- Built in 1972 — when were the roof, HVAC, electrical panel, plumbing, and water heater last replaced?
- Why hasn't it sold? Are there any deal-killer items the seller is aware of (foundation, flood, title, zoning, code violations)?
- Is there a deadline driving the sale (1031 exchange, divorce, estate, relocation)? That informs how much negotiation room exists.
- Schools are F-rated, which usually means shorter tenancies and higher turnover. Who's the typical renter profile here, and what's been the actual vacancy rate?
- Crime grade is F in this area — have there been break-ins, vandalism, or insurance claims at this property in the last 3 years? What carrier currently insures it and at what premium?
- What's the average days-on-market for RENTAL listings here right now (not sales)? A rising rental-DOM trend means longer vacancies and softer asking-rent achievability than the comps imply.
- What's the recent tenant-quality profile in this submarket — average credit score on applications, eviction rate, late-payment / NSF rate, and stable-employment percentage? A property-management company in the area should have these aggregated.
- How much new apartment / multifamily construction is in the pipeline within 1–3 miles? Heavy new supply (>2% of stock underway) typically softens rents 12–24 months out; light construction supports rent growth.
Investment metrics
- 1% rule
- 1.01% ✓
- Cap rate
- 7.94%
- Cash-on-cash
- 5.89%
- DSCR
- 1.26
- GRM
- 8.3
CMA / ARV
No comps found within radius.
Projected returns pro-forma
-3.0% appreciation · 3.34% rent growth · sell at horizon
- IRR
- -6.8%
- Equity multiple
- 0.75×
- Total profit
- $-404,993
- Equity at exit
- $849,143
- IRR
- 3.2%
- Equity multiple
- 1.23×
- Total profit
- $369,516
- Equity at exit
- $492,400
Cash invested: $1,594,600 (down + closing). Projections, not guarantees.
Landlord ↔ Tenant lean methodology
- Overall (STATE)
- 18 Strongly Tenant-Friendly
- State California
- 18 Strongly Tenant-Friendly · D+13
- County
- — inherits STATE
- City
- — inherits STATE
ZIP-level market 92201
- Home prices YoY
- -28.4%
- Rents YoY
- 3.3%
- Active inventory
- 515
- Price-to-rent
- 198.3×
Monthly cashflow live
- Estimated rent
- $57,426 high interval (Pro) →
- Mortgage (P&I)
- −$29,865
- Tax from tax record
- −$5,303 /mo · $63,641/yr
- Insurance
- −$2,373
- HOA
- −$0
- Vacancy / Maint / Mgmt
- −$12,059
- Net cashflow
- $7,825
Break-even live
Sensitivity live
| Price | -10% $11,049 | -5% $9,437 | +0% $7,825 | +5% $6,213 | +10% $4,601 |
|---|---|---|---|---|---|
| Rent | -10% $3,288 | -5% $5,557 | +0% $7,825 | +5% $10,093 | +10% $12,362 |
| Rate | -1.0pp $10,693 | -0.5pp $9,273 | base $7,825 | +0.5pp $6,349 | +1.0pp $4,848 |
24-unit breakdown (identical units grouped — click to expand)
| Units | Beds | Baths | Est. rent |
|---|---|---|---|
| 24× units | 3.0 | 1.5 | $57,432 |
| #1 | 3.0 | 1.5 | $2,393 |
| #2 | 3.0 | 1.5 | $2,393 |
| #3 | 3.0 | 1.5 | $2,393 |
| #4 | 3.0 | 1.5 | $2,393 |
| #5 | 3.0 | 1.5 | $2,393 |
| #6 | 3.0 | 1.5 | $2,393 |
| #7 | 3.0 | 1.5 | $2,393 |
| #8 | 3.0 | 1.5 | $2,393 |
| #9 | 3.0 | 1.5 | $2,393 |
| #10 | 3.0 | 1.5 | $2,393 |
| #11 | 3.0 | 1.5 | $2,393 |
| #12 | 3.0 | 1.5 | $2,393 |
| #13 | 3.0 | 1.5 | $2,393 |
| #14 | 3.0 | 1.5 | $2,393 |
| #15 | 3.0 | 1.5 | $2,393 |
| #16 | 3.0 | 1.5 | $2,393 |
| #17 | 3.0 | 1.5 | $2,393 |
| #18 | 3.0 | 1.5 | $2,393 |
| #19 | 3.0 | 1.5 | $2,393 |
| #20 | 3.0 | 1.5 | $2,393 |
| #21 | 3.0 | 1.5 | $2,393 |
| #22 | 3.0 | 1.5 | $2,393 |
| #23 | 3.0 | 1.5 | $2,393 |
| #24 | 3.0 | 1.5 | $2,393 |
| Total (24 units) | $57,426 | ||
UW: 25.0% down · 7.5% · 30yr · 1.5% tax · 5.0% vac · 8.0% maint · 8.0% mgmt
Financing live
Cash to close
- Down payment
- $1,423,750
- Closing costs
- $170,850
- Reserves months
- —
- Total cash needed
- —
Loan-product check · same deal, 3 products live
Conventional
25% down · 7.5% · 30yr
- Down + closing
- —
- Monthly P&I
- —
- Monthly cashflow
- —
- DSCR
- —
- Eligible?
- —
Personal DTI + credit; lowest rate.
DSCR
20% down · 8.5% · 30yr
- Down + closing
- —
- Monthly P&I
- —
- Monthly cashflow
- —
- DSCR
- —
- Eligible?
- —
No personal income docs; deal must DSCR.
Hard money
10% down · 12.0% · 12mo
- Down + closing
- —
- Monthly P&I
- —
- Monthly cashflow
- —
- DSCR
- —
- Eligible?
- —
Short-term bridge; refi at stabilization.
Listing history 32 events
-
2026-06-21days on market $5,695,000 Active 150 DOM
-
2026-06-18days on market $5,695,000 Active 147 DOM
-
2026-06-17days on market $5,695,000 Active 146 DOM
-
2026-06-16days on market $5,695,000 Active 145 DOM
-
2026-06-15days on market $5,695,000 Active 144 DOM
-
2026-06-13days on market $5,695,000 Active 142 DOM
-
2026-06-09days on market $5,695,000 Active 138 DOM
-
2026-06-08days on market $5,695,000 Active 137 DOM
-
2026-06-07days on market $5,695,000 Active 136 DOM
-
2026-06-04days on market $5,695,000 Active 133 DOM
-
2026-06-03days on market $5,695,000 Active 132 DOM
-
2026-06-02days on market $5,695,000 Active 131 DOM
-
2026-06-01days on market $5,695,000 Active 130 DOM
-
2026-05-31days on market $5,695,000 Active 129 DOM
-
2026-01-22$5,695,000 Active 926-char remark
Show marketing remark (926 chars)
TRUE +7% CAP - John Nobles Townhomes - Multi-Family - Current CAP Rate of 7.13%, ProForma CAP Rate of 7.74%. All units have been fully renovated & re-tenanted at market-rate rents across the property. / All Two-Story Townhouse Style Units - Unparalleled unit mix of (16) 3 Bed 1.5 Bath townhomes & (8) 4 Bed 2 Bath townhomes. / Over $1,000,000 in recent capital improvements, including all new roofing, HVAC unit replacements, full interior and exterior renovations. The John Nobles Apartments, a freshly renovated 24-unit apartment complex located in sunny Indio, CA. Built in 1980, the apartments are located on a 1.280 acre lot. The two buildings are composed of Sixteen (16) Three-Bedroom units & Eight (8) Four-Bedroom units, all featuring a spacious & comfortable 2-story townhome design. Amenities include onsite parking, essential appliances in each unit & private vinyl-fenced backyards.
-
2025-06-03price $5,995,000
-
2025-03-13historical
-
2024-12-13$6,545,000 Active
-
2024-11-22historical
-
2024-10-11price $6,595,000
-
2024-08-16$6,800,000 Active
-
2024-04-05historical $2,195
-
2024-03-24$2,195
-
2024-03-20historical $2,195
-
2024-03-15$2,195
-
2023-10-24historical $2,395
-
2023-10-20historical $2,395
-
2023-10-20$2,395
-
2023-08-09
-
2023-07-25historical
-
2023-07-23
-
1995-09-29soldstatus $380,000
ⓘ Source: listings_history table (triggers on properties + properties_extension) + one-shot
backfill from property_details.listing_events for pre-trigger history.
Tax reassessment forecast CA · Resets to sale price
- Current annual tax
- $63,641 · $5,303/mo
- Projected year-2 tax
- $63,641 · $5,303/mo
- Expected delta
- $0/yr ($0/mo · 0.0%)
ⓘ Screening estimate from a state-policy table — verify with the county assessor before closing.
Climate risk First Street
- Flood 1/10 Low FEMA zone X (unshaded) · 0% chance over 30 yrs
- Wildfire 3/10 Moderate
- Heat 10/10 Extreme 7 d/yr ≥114°F today · 19 d/yr by 30 yrs out
- Wind 1/10 Low
- Air quality 3/10 Moderate 3 unhealthy d/yr today · 5 by 30 yrs out
Nearby sold comps map
Loading sold comps map…
Walkable amenities ~0.75 mi
Loading nearby amenities…
Taxation est. · year 1
- Rental income
- $689,112
- − Mortgage interest
- −$319,009
- − Property taxes
- −$63,641
- − Insurance
- −$28,475
- − Repairs & maintenance
- −$55,129
- − Management
- −$55,129
- − Depreciation
- −$165,673
- Taxable income
- $2,057
- Est. tax owed @ 24.0%
- −$494
- After-tax cash flow
- $93,407/yr
For passive investors: Depreciation is non-cash, so a rental often shows a tax loss while cash-flowing — sheltering income. Rental losses are passive: they offset passive income freely, and up to $25,000/yr can offset ordinary (W-2) income if you actively participate and your MAGI is under $100k (phasing out to $0 by $150k); unused losses carry forward. On sale, claimed depreciation is recaptured at up to 25%, and gains may owe capital-gains tax (a 1031 exchange can defer both). Figures are a year-1 estimate at your 24.0% rate — not tax advice; consult a CPA.
Schools (NCES district)
- District
- Desert Sands Unified
- NCES district ID
- 0611110
- Math proficiency
- 31% ▼ -4.00%
- Reading proficiency
- 56% ▲ 7.00%
- Median HH income
- $54,957
- Composite
- 37.77/100
- National rank
- #4346
- State rank
- #199 of 517 in CA
Livability — Indio
- Score
- 53/100
- State rank
- #927
- US rank
- #24244
Category grades
Schools grade is shown separately in the Schools card above.
Census & demographics
- Census place
- Indio, CA
- County
- Riverside County · 2,287,001 people
- City population
- 100,560
- Metro
- Riverside-San Bernardino-Ontario, CA
- Population (ZIP)
- 65,825
- Household income
- $66,758
- Rent vs Own
- Severe rent burden
- 2036.0
Population outlook (Riverside County) Hauer SSP2
- Today (2025)
- 2,664,475 people
- By 2030
- 2,802,692 · +5.2%
- By 2040
- 3,050,904 · +14.5%
- By 2050
- 3,256,783 · +22.2%
- By 2075
- 3,655,058 · +37.2%
- By 2100
- 3,766,594 · +41.4%
Race, ethnicity, and origin ACS 2023
- Neighborhood character
- Predominantly Hispanic (74%)
- Race & ethnicity
- Hispanic / Latino 74% Two or more races 39% White 19% Black 3% Asian 3% Native American 1%
- Hispanic origin (detail)
- Mexican 69%
- Common ancestry
- Romanian 1% Iranian 1%
- Foreign-born
- 29% · Canada, Vietnam, Jamaica
- Languages at home
- 41% English-only · Spanish 55% Arabic 1% Tagalog/Filipino 1%
Political lean MEDSL · Riverside
- 2024 margin
- Toss-up / Even · D 48.0% · R 49.3% · Other 2.6%
- 2008→2024 swing
- -3.6pp toward R · 2008: 2.3pp · 2024: -1.3pp
- All cycles
- 2024: R+1.3 2020: D+8.0 2016: D+4.3 2012: R+0.4 2008: D+2.3
Not yet ingested
- Civics
- —
Market trends
- HPI YoY
- ▼ -138.46%
- Current HPI
- 348.6605
- Rent YoY
- ▲ 3.34%
- Metro
- Riverside-San Bernardino-Ontario, CA
- State GDP YoY
- ▲ 3.21%
- F500 in state
- 116
Industry mix (Fortune 500 HQ in CA)
| Industry | F500 HQs | Revenue |
|---|---|---|
| Technology | 27 | $1,492B |
|
||
| Financial Services | 3 | $174B |
|
||
| Retail | 3 | $44B |
|
||
| Insurance | 3 | $26B |
|
||
| Media / Entertainment | 2 | $115B |
|
||
| Pharmaceuticals / Biotech | 2 | $62B |
|
||
Price history
+1398.7% since first listed18 events — show timeline
- 2026-01-22 Listed $5,695,000 CRMLS
- 2025-06-03 Price Changed $5,995,000 CRMLS
- 2025-03-13 Listing Removed — CRMLS
- 2024-12-13 Listed $6,545,000 CRMLS
- 2024-11-22 Listing Removed — CRMLS
- 2024-10-11 Price Changed $6,595,000 CRMLS
- 2024-08-16 Listed $6,800,000 CRMLS
- 2024-04-05 Rental Removed $2,195 APPFOLIO
- 2024-03-24 Listed for Rent $2,195 APPFOLIO
- 2024-03-20 Rental Removed $2,195 APPFOLIO
- 2024-03-15 Listed for Rent $2,195 APPFOLIO
- 2023-10-24 Rental Removed $2,395 APPFOLIO
- 2023-10-20 Rental Removed $2,395 CRMLS
- 2023-10-20 Listed for Rent $2,395 APPFOLIO
- 2023-08-09 Listed for Rent — CRMLS
- 2023-07-25 Rental Removed — CRMLS
- 2023-07-23 Listed for Rent — CRMLS
- 1995-09-29 Sold (Public Records) $380,000 Public Records
Property tax history
+8.9%/yrLatest (2025): $63,641 · +6.8% YoY. Source: county tax records.
Cash-flow waterfall
monthlySold comps — $/sqft
last 12 mo · ≤1 miLoading sold comps…