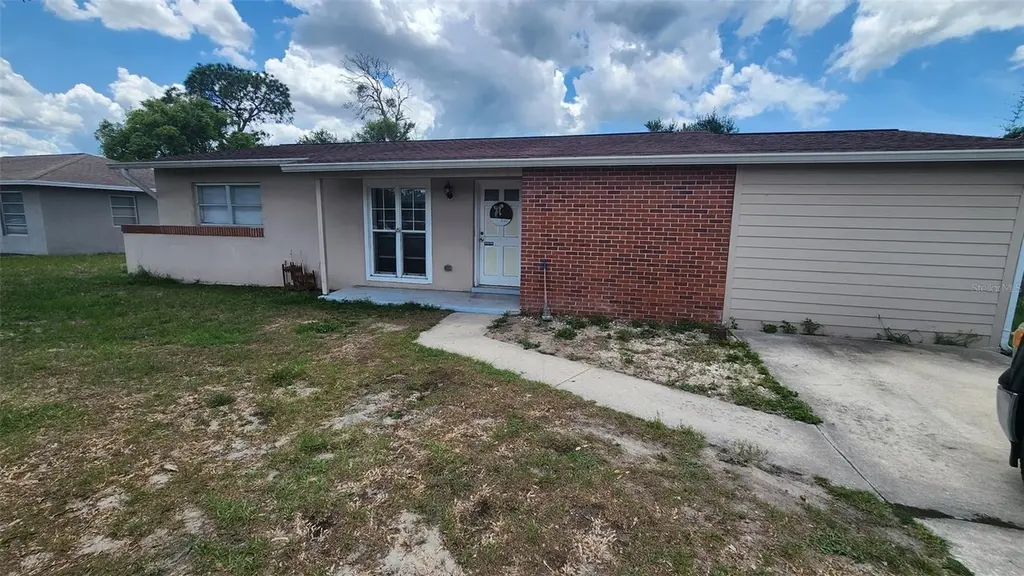
1025 Cobblestone Dr · Spring Hill, FL
Flood risk 1/10 · Minimal
- FEMA flood zone
- X (unshaded)
- Chance of flooding over 30 yrs
- 0.0%
- Est. flood insurance / yr
- $507 – $1,088
Fire risk 4/10 · Minor
- Est. fire insurance / yr
- $947 – $1,759
Heat risk 10/10 · Severe
- Hot days now (above 110°F)
- 7 days/yr
- Hot days in 30 yrs
- 27 days/yr
Wind risk 10/10 · Severe
- Chance of severe wind over 30 yrs
- 99.0%
Air-quality risk 2/10 · Minimal
- Unhealthy air days now
- 1 days/yr
- Unhealthy air days in 30 yrs
- 3 days/yr
Risk factors via First Street. Map © Google.
Why this score? — see what drove the C grade
The composite is a weighted blend of 9 inputs, each scored 0–100. Each bar is that input's sub-score; the figure is the points it added to the 100-point composite (weight × sub-score).
- Cash flow +18.8/30.0
- ARV discount +15.0/15.0
- DSCR +5.9/10.0
- 1% rule +4.2/10.0
- Schools +4.2/10.0
- Livability +3.2/5.0
- Condition / age +2.5/5.0
- Rent growth +2.3/5.0
- Appreciation +0.0/10.0
$169,900
🖨 Deal sheet (PDF) 📄 Offer letter ✓ Due diligence
Listing remarks
Under contract-accepting backup offers. Investor Special in Spring Hill – 2 Bedroom + Bonus Room Opportunity awaits with this 2-bedroom, 1-bath home with a bonus room in Spring Hill, Florida. The bonus room only needs a closet to potentially function as a third bedroom, making this property full of possibilities for investors or buyers looking to create their ideal home. Roof redone in 2015 and an A/C replaced in 2018. Whether you're looking for a blank slate to make your own or simply want to complete minor paint and flooring updates to create a rental property, this home offers excellent potential. Outside, enjoy an above-ground pool and yard space ready to be transformed into y
Key facts
- Above ground pool
- Bonus room
- Major updates
Tags
Property features AI
Finance
- Other: Property is homesteaded; Property type: Residential — Single Family Residence; Zoning: Residential
- HOA & community: No association fees
Exterior
- Utilities: Public water; Public sewer; Electricity available; Water connected
- Home design: Single-family residence; One story; Northeast facing; Entry level: 1
- Construction: Block construction; Shingle roof; Slab foundation; Built on 0.17-acre lot (approx. 75 x 100)
- Exterior features: Above-ground private pool; Asphalt road access
Interior
- Kitchen: Dishwasher; Microwave; Range; Refrigerator
- Bedrooms: 2 bedrooms
- Flooring: Carpet; Ceramic tile; Concrete; Laminate; Terrazzo
- Bathrooms: 1 full bathroom
- Heating & cooling: Central heating; Central air conditioning
- Interior features: Ceiling fans
- Laundry & utility: Laundry inside
Neighborhood map
What this means for you Summary
Snapshot
- This is a 2-bed/1.0-bath single-family listed at $170k.
Deal economics
- At list price, monthly cash flow is $172 ($2k/yr) — positive.
- The deal already cash-flows at list — no discount required.
- To meet the 1% rule (rent ≥ 1% of price), the offer needs to be $156k (8.3% below list).
- Recommended offer: $156k (8.3% below list) — sets the bar for 1% rule.
- Cap rate 7.5% vs local median 4.4% in Spring Hill — top-decile yield for the area; either an underpriced asset or a hidden risk that comps aren't pricing in. Stress-test before assuming the spread holds.
Location & tenants
- Location reads 63/100 on livability (#738 in FL) — a middle-class / working-renter tenant base. Strengths: cost of living A+, housing A+; Watch: health & safety C-, employment D+, amenities F.
- Hernando (suburban): math 50% / reading 50% proficiency, ranked #38 of 73 in FL (top 52%) — acceptable for families but not a draw, mixed tenant base, ~2y average lease.
- Zoned schools: Suncoast Elementary School (math 53% / reading 51%, grade C-, #990 of 2,144 statewide, top 48%, 899 students, 64% FRL); Fox Chapel Middle School (math 39% / reading 44%, grade F, #348 of 571 statewide, top 62%, 862 students, 69% FRL); Frank W. Springstead High School (math 45% / reading 55%, grade D+, #175 of 667 statewide, top 27%, 1,896 students, 49% FRL).
- Market conditions: Rents soft (-0.9%/yr); 392 active listings in the ZIP; 25 comparable units currently listed for rent nearby; rentals at typical pace (median 26d on market — plan ~3-4 weeks tenant-placement turnaround); 2,505 units permitted in Hernando County in 2024 (318 in 5+ unit buildings).
- This rent runs 33% of the median local income ($57k/yr) — at the standard rent-burdened threshold; future hikes will face affordability resistance.
Forward outlook
- Local home prices are declining (-3.0%/yr); year-one equity from $1k of loan paydown is wiped out by about $5k of value loss. Plan a longer hold.
- Hernando County population projected at +11% by 2050 — modest demand growth; plan on rents tracking national, not racing it.
Negotiation context
- Only 7 days on market — expect competitive offers; lowballing is unlikely to land.
- 3 sale attempts since 16y ago with the ask held roughly flat each time — persistent listings suggest the price (not the market) is what's stuck; bring a comps-based counter.
- Current owner paid $54k; list at $170k implies a 218% gain — meaningful room to come down on a strong offer.
Risks & watch-outs
- Climate carrying-cost: severe wind risk, 99% chance of damaging wind over 30y; extreme-heat days projected 7→27/yr by 2055 (HVAC capex compounding) — expect insurance premiums to compound above CPI over the hold.
Questions for the listing agent
- Built in 1971 — when were the roof, HVAC, electrical panel, plumbing, and water heater last replaced?
- Is there a deadline driving the sale (1031 exchange, divorce, estate, relocation)? That informs how much negotiation room exists.
- What's the average days-on-market for RENTAL listings here right now (not sales)? A rising rental-DOM trend means longer vacancies and softer asking-rent achievability than the comps imply.
- What's the recent tenant-quality profile in this submarket — average credit score on applications, eviction rate, late-payment / NSF rate, and stable-employment percentage? A property-management company in the area should have these aggregated.
- How much new for-sale + rental construction is in the pipeline within 1–3 miles? Heavy new supply typically softens prices + rents 12–24 months out; constrained supply supports both.
Investment metrics
- 1% rule
- 0.92% ✗
- Cap rate
- 7.51%
- Cash-on-cash
- 4.33%
- DSCR
- 1.19
- GRM
- 9.1
CMA / ARV
- ARV (on-the-fly)
- $242,190
- Comps found
- 12
Show comp detail 12 sales within ~0.75 mi
| Address | Dist | Beds/Ba | Sqft | Sold | Price | $/sf | Match |
|---|---|---|---|---|---|---|---|
| 7253 Tarrytown Dr | 0.19mi | 2/2.0 | 1,241 (-0%) | 1mo | $242,000 | $195 | 86 |
| 7319 Holiday Dr | 0.25mi | 3/2.0 (+1) | 1,230 (-1%) | 1mo | $235,000 | $191 | 76 |
| 7318 Tranquil Dr | 0.59mi | 2/2.0 | 1,284 (+3%) | 2mo | $239,900 | $187 | 61 |
| 6634 Pinehurst Dr | 0.58mi | 3/1.0 (+1) | 1,173 (-6%) | 2mo | $200,000 | $171 | 57 |
| 307 Plumtree Ave | 0.46mi | 3/2.0 (+1) | 1,368 (+10%) | 2mo | $270,000 | $197 | 51 |
| 6981 Pinehurst Dr | 0.44mi | 3/2.0 (+1) | 1,426 (+15%) | 1mo | $280,000 | $196 | 45 |
| 7157 Landmark Dr | 0.52mi | 3/2.0 (+1) | 1,388 (+12%) | 2mo | $255,000 | $184 | 45 |
| 7631 Pinehurst Dr | 0.49mi | 3/2.0 (+1) | 1,400 (+13%) | 3mo | $293,000 | $209 | 45 |
| 368 Portland Ave | 0.59mi | 3/2.0 (+1) | 1,108 (-11%) | 2mo | $260,000 | $235 | 44 |
| 1338 Pilgrim Rd | 0.57mi | 3/2.5 (+1) | 1,412 (+14%) | 1mo | $305,000 | $216 | 39 |
| 6496 Jamaica Rd | 0.75mi | 2/2.0 | 1,402 (+13%) | 1mo | $250,000 | $178 | 39 |
| 6568 Treehaven Dr | 0.72mi | 3/2.0 (+1) | 1,384 (+11%) | 2mo | $215,000 | $155 | 37 |
Match score weights: distance 35% · size 25% · config 20% · recency 20%. Top-matched comps best support the ARV.
Projected returns pro-forma
-3.0% appreciation · 0.0% rent growth · sell at horizon
- IRR
- -12.7%
- Equity multiple
- 0.55×
- Total profit
- $-21,207
- Equity at exit
- $25,333
- IRR
- -8.6%
- Equity multiple
- 0.53×
- Total profit
- $-22,216
- Equity at exit
- $14,690
Cash invested: $47,572 (down + closing). Projections, not guarantees.
Landlord ↔ Tenant lean methodology
- Overall (STATE)
- 87 Strongly Landlord-Friendly
- State Florida
- 87 Strongly Landlord-Friendly · R+3
- County
- — inherits STATE
- City
- — inherits STATE
ZIP-level market 34606
- Home prices YoY
- -24.7%
- Rents YoY
- -0.9%
- Active inventory
- 392
- Price-to-rent
- 9.1×
Monthly cashflow live
- Estimated rent
- $1,557 high interval (Pro) →
- Mortgage (P&I)
- −$891
- Tax from tax record
- −$97 /mo · $1,163/yr
- Insurance
- −$71
- HOA
- −$0
- Vacancy / Maint / Mgmt
- −$327
- Net cashflow
- $172
Break-even live
Sensitivity live
| Price | -10% $268 | -5% $220 | +0% $172 | +5% $124 | +10% $76 |
|---|---|---|---|---|---|
| Rent | -10% $49 | -5% $110 | +0% $172 | +5% $233 | +10% $295 |
| Rate | -1.0pp $257 | -0.5pp $215 | base $172 | +0.5pp $128 | +1.0pp $83 |
UW: 25.0% down · 7.5% · 30yr · 1.5% tax · 5.0% vac · 8.0% maint · 8.0% mgmt
Financing live
Cash to close
- Down payment
- $42,475
- Closing costs
- $5,097
- Reserves months
- —
- Total cash needed
- —
Loan-product check · same deal, 3 products live
Conventional
25% down · 7.5% · 30yr
- Down + closing
- —
- Monthly P&I
- —
- Monthly cashflow
- —
- DSCR
- —
- Eligible?
- —
Personal DTI + credit; lowest rate.
DSCR
20% down · 8.5% · 30yr
- Down + closing
- —
- Monthly P&I
- —
- Monthly cashflow
- —
- DSCR
- —
- Eligible?
- —
No personal income docs; deal must DSCR.
Hard money
10% down · 12.0% · 12mo
- Down + closing
- —
- Monthly P&I
- —
- Monthly cashflow
- —
- DSCR
- —
- Eligible?
- —
Short-term bridge; refi at stabilization.
Rent comps 25 comps
| Address | Beds | Baths | Sqft | Rent | $/sqft | DOM | Units | Dist |
|---|---|---|---|---|---|---|---|---|
| 513 Hollyhock Ln Spring Hill, FL | 3.0 | 1.0 | 1100 | $1,495 | $1.36 | 4d | 1 | 0.19mi |
| 595 Swallow Ln Spring Hill, FL | 2.0 | 1.0 | 756 | $1,495 | $1.98 | 26d | 1 | 0.26mi |
| 1246 Newhope Rd Spring Hill, FL | 2.0 | 1.0 | 766 | $1,575 | $2.06 | 26d | 1 | 0.34mi |
| 1241 Pilgrim Rd Spring Hill, FL | 2.0 | 1.0 | 1030 | $1,600 | $1.55 | 6d | 1 | 0.43mi |
| 7176 Lockwood St Spring Hill, FL | 3.0 | 2.0 | 1272 | $1,795 | $1.41 | 26d | 1 | 0.44mi |
| 6441 Holiday Dr Spring Hill, FL | 2.0 | 1.0 | 730 | $1,395 | $1.91 | 26d | 1 | 0.47mi |
| 1264 Sylvia Ave Spring Hill, FL | 3.0 | 2.0 | 1000 | $1,595 | $1.59 | 26d | 1 | 0.53mi |
| 1277 Sylvia Ave Spring Hill, FL | 2.0 | 1.0 | 1040 | $1,250 | $1.20 | 26d | 1 | 0.54mi |
| 1277 Sylvia Ave Spring Hill, FL | 2.0 | 1.0 | 1040 | $1,225 | $1.18 | 12d | 1 | 0.54mi |
| 1273 Sylvia Ave Spring Hill, FL | 2.0 | 1.0 | 1040 | $1,225 | $1.18 | 1d | 1 | 0.54mi |
| 1273 Sylvia Ave Spring Hill, FL | 2.0 | 1.0 | 1040 | $1,225 | $1.18 | 19d | 1 | 0.54mi |
| 1271 Sylvia Ave Unit 1273 Spring Hill, FL | 2.0 | 1.0 | 1040 | $1,225 | $1.18 | 26d | 1 | 0.54mi |
| 255 Killinger Ave Spring Hill, FL | 2.0 | 2.0 | 1266 | $1,900 | $1.50 | 26d | 1 | 0.57mi |
| 6334 Talbot Cir Spring Hill, FL | 2.0 | 1.0 | 766 | $1,340 | $1.75 | 26d | 1 | 0.60mi |
| 6334 Talbot Cir Spring Hill, FL | 2.0 | 1.0 | 766 | $1,295 | $1.69 | 6d | 1 | 0.60mi |
| 7261 Pond Cir Unit B Spring Hill, FL | 2.0 | 1.5 | 1000 | $1,350 | $1.35 | 26d | 1 | 0.73mi |
| 7419 Mead Dr Spring Hill, FL | 2.0 | 2.0 | 1002 | $1,400 | $1.40 | 1d | 1 | 0.82mi |
| 1305 Markham Ave Spring Hill, FL | 3.0 | 1.0 | 900 | $1,650 | $1.83 | 26d | 1 | 1.01mi |
| 8108 Omaha Cir Spring Hill, FL | 2.0 | 1.0 | 950 | $1,359 | $1.43 | 6d | 1 | 1.06mi |
| 8053 Canterbury St Spring Hill, FL | 2.0 | 2.0 | 923 | $1,700 | $1.84 | 26d | 1 | 1.11mi |
| 8274 Omaha Cir Spring Hill, FL | 1.0–3.0 | 1.0–2.0 | 914 | $1,264 | $1.38 | 26d | 3 | 1.15mi |
| 8325 Omaha Cir Spring Hill, FL | 2.0 | 1.0 | 740 | $1,295 | $1.75 | 16d | 1 | 1.21mi |
| 8351 Omaha Cir Spring Hill, FL | 2.0 | 1.0 | 740 | $1,295 | $1.75 | 26d | 1 | 1.24mi |
| 153 Rosedale Ave Spring Hill, FL | 3.0 | 2.0 | 1407 | $1,999 | $1.42 | 6d | 1 | 1.26mi |
| 153 Rosedale Ave Spring Hill, FL | 3.0 | 2.0 | 1407 | $2,100 | $1.49 | 26d | 1 | 1.26mi |
Listing history 9 events
-
2026-05-22$170,000 Active
-
2019-11-11historical
-
2016-03-28soldstatus $53,500
-
2015-09-11$60,000
-
2012-03-02soldstatus $49,900
-
2010-07-17historical
-
2010-04-22$49,900
-
2003-10-28soldstatus $59,000
-
1996-04-01soldstatus $35,500
ⓘ Source: listings_history table (triggers on properties + properties_extension) + one-shot
backfill from property_details.listing_events for pre-trigger history.
Tax reassessment forecast FL · Resets to sale price
- Current annual tax
- $1,163 · $97/mo
- Projected year-2 tax
- $1,410 · $118/mo
- Expected delta
- +$248/yr (+$21/mo · 21.3%)
ⓘ Screening estimate from a state-policy table — verify with the county assessor before closing.
Climate risk First Street
- Flood 1/10 Low FEMA zone X (unshaded) · 0% chance over 30 yrs
- Wildfire 4/10 Moderate
- Heat 10/10 Extreme 7 d/yr ≥110°F today · 27 d/yr by 30 yrs out
- Wind 10/10 Extreme 99% chance of damaging wind over 30 yrs
- Air quality 2/10 Low 1 unhealthy d/yr today · 3 by 30 yrs out
Nearby sold comps map
Loading sold comps map…
Walkable amenities ~0.75 mi
Loading nearby amenities…
Taxation est. · year 1
- Rental income
- $18,689
- − Mortgage interest
- −$9,517
- − Property taxes
- −$1,163
- − Insurance
- −$850
- − Repairs & maintenance
- −$1,495
- − Management
- −$1,495
- − Depreciation
- −$4,943
- Taxable loss
- −$773
- Est. tax savings @ 24.0%
- +$186
- After-tax cash flow
- $2,246/yr
For passive investors: Depreciation is non-cash, so a rental often shows a tax loss while cash-flowing — sheltering income. Rental losses are passive: they offset passive income freely, and up to $25,000/yr can offset ordinary (W-2) income if you actively participate and your MAGI is under $100k (phasing out to $0 by $150k); unused losses carry forward. On sale, claimed depreciation is recaptured at up to 25%, and gains may owe capital-gains tax (a 1031 exchange can defer both). Figures are a year-1 estimate at your 24.0% rate — not tax advice; consult a CPA.
Schools (NCES district)
- District
- Hernando
- NCES district ID
- 1200810
- Math proficiency
- 50% ▼ -8.00%
- Reading proficiency
- 50% ▼ -4.00%
- Median HH income
- $41,985
- Composite
- 42.03/100
- National rank
- #3329
- State rank
- #38 of 73 in FL
Livability — Spring Hill
- Score
- 63/100
- State rank
- #738
- US rank
- #15937
Category grades
Schools grade is shown separately in the Schools card above.
Census & demographics
- Census place
- Spring Hill, FL
- County
- Hernando County · 169,677 people
- City population
- 83,915
- Metro
- Tampa-St. Petersburg-Clearwater, FL
- Population (ZIP)
- 28,668
- Household income
- $57,337
- Rent vs Own
- Severe rent burden
- 733.0
Population outlook (Hernando County) Hauer SSP2
- Today (2025)
- 189,218 people
- By 2030
- 194,367 · +2.7%
- By 2040
- 203,398 · +7.5%
- By 2050
- 209,589 · +10.8%
- By 2075
- 218,452 · +15.4%
- By 2100
- 205,923 · +8.8%
Race, ethnicity, and origin ACS 2023
- Neighborhood character
- Predominantly White (74%)
- Race & ethnicity
- White 74% Hispanic / Latino 16% Two or more races 13% Black 4%
- Hispanic origin (detail)
- Mexican 1% Puerto Rican 10% Cuban 2%
- Common ancestry
- Romanian 4% Lithuanian 3% Slovak 2%
- Foreign-born
- 8% · Canada, Jamaica
- Languages at home
- 87% English-only · Spanish 11% German/W. Germanic 1%
Political lean MEDSL · Hernando
- 2024 margin
- Solid R (+37.0) · D 31.1% · R 68.2%
- 2008→2024 swing
- -33.5pp toward R · 2008: -3.6pp · 2024: -37.0pp
- All cycles
- 2024: R+37.0 2020: R+30.2 2016: R+29.0 2012: R+8.5 2008: R+3.6
Not yet ingested
- Civics
- —
Market trends
- HPI YoY
- ▼ -98.11%
- Current HPI
- 298.5201
- Rent YoY
- ▼ -0.89%
- Metro
- Tampa-St. Petersburg-Clearwater, FL
- State GDP YoY
- ▲ 3.28%
- F500 in state
- 36
Industry mix (Fortune 500 HQ in FL)
| Industry | F500 HQs | Revenue |
|---|---|---|
| Industrial Technology | 2 | $29B |
|
||
| Insurance | 2 | $17B |
|
||
| Retail | 1 | $60B |
|
||
| Technology Distribution | 1 | $58B |
|
||
| Homebuilding | 1 | $35B |
|
||
| Technology Manufacturing | 1 | $35B |
|
||
Price history
+378.9% since first listed9 events — show timeline
- 2026-05-22 Listed $170,000 Stellar MLS as Distributed by MLS Grid
- 2019-11-11 Listing Removed — HCAR
- 2016-03-28 Sold (Public Records) $53,500 Public Records
- 2015-09-11 Listed $60,000 HCAR
- 2012-03-02 Sold (Public Records) $49,900 Public Records
- 2010-07-17 Listing Removed — HCAR
- 2010-04-22 Listed $49,900 HCAR
- 2003-10-28 Sold (Public Records) $59,000 Public Records
- 1996-04-01 Sold (Public Records) $35,500 Public Records
Property tax history
+7.3%/yrLatest (2025): $1,163 · +0.8% YoY. Source: county tax records.
Cash-flow waterfall
monthlySold comps — $/sqft
last 12 mo · ≤1 miLoading sold comps…