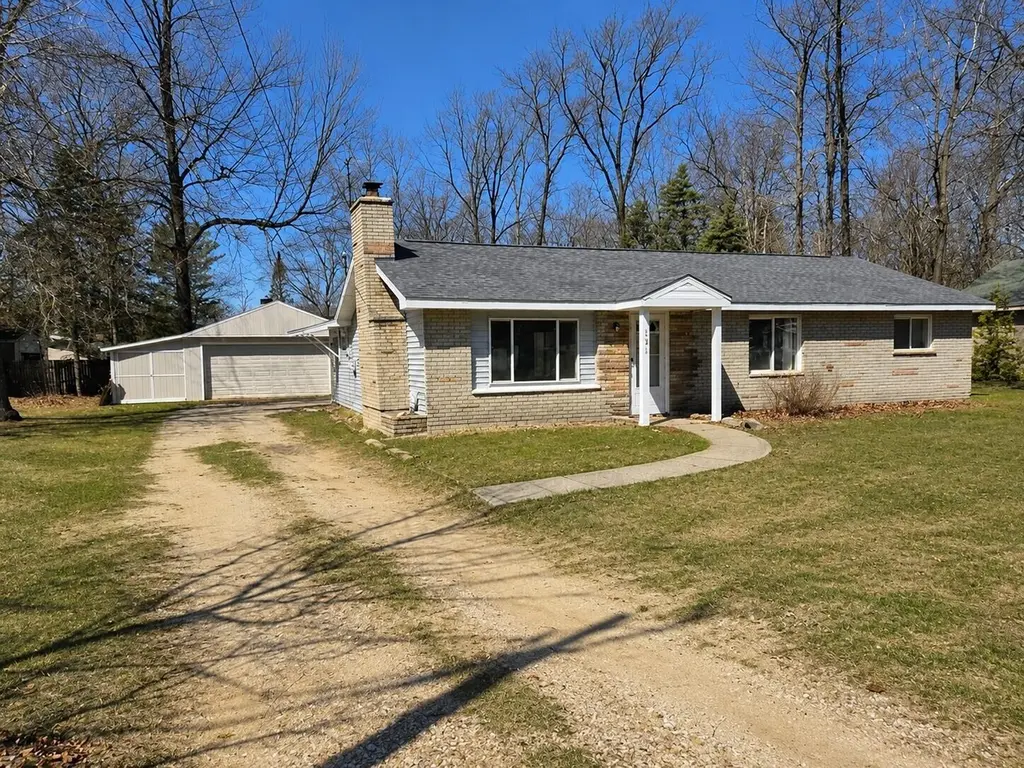
131 Burrill Dr · Denton, MI
Flood risk 1/10 · Minimal
- FEMA flood zone
- X (unshaded)
- Chance of flooding over 30 yrs
- 0.0%
- Est. flood insurance / yr
- $473 – $860
Fire risk 2/10 · Minimal
- Est. fire insurance / yr
- $784 – $1,456
Heat risk 1/10 · Minimal
- Hot days now (above 92°F)
- 7 days/yr
- Hot days in 30 yrs
- 14 days/yr
Wind risk 1/10 · Minimal
- Chance of severe wind over 30 yrs
- —
Air-quality risk 2/10 · Minimal
- Unhealthy air days now
- 0 days/yr
- Unhealthy air days in 30 yrs
- 1 days/yr
Risk factors via First Street. Map © Google.
Why this score? — see what drove the C+ grade
The composite is a weighted blend of 9 inputs, each scored 0–100. Each bar is that input's sub-score; the figure is the points it added to the 100-point composite (weight × sub-score).
- Cash flow +25.1/30.0
- ARV discount +14.3/15.0
- DSCR +8.2/10.0
- 1% rule +6.1/10.0
- Rent growth +2.5/5.0
- Livability +2.5/5.0
- Condition / age +2.5/5.0
- Schools +2.2/10.0
- Appreciation +0.0/10.0
$169,900
🖨 Deal sheet (PDF) 📄 Offer letter ✓ Due diligence
Listing remarks
Charming and affordable 3-bed, 1.5-bath ranch just two blocks from beautiful Houghton Lake! This cozy home features an inviting open floor plan with warm knotty pine throughout the living rm and 1 bedroom and a natural fieldstone fireplace, perfect for relaxing evenings. Recent updates include a brand-new roof and new kitchen flooring, adding peace of mind and modern touches. The home also offers a partial basement, providing extra storage and laundry facilities. Step outside to enjoy a spacious yard--ideal for kids, pets, or entertaining. The oversized detached garage includes a dedicated workshop area, perfect for hobbies, tools, or outdoor gear. Whether you're looking for a starter home,
Key facts
- Spacious yard
- Open floor plan
- Partial basement
Tags
Property features AI
Exterior
- Parking: Detached garage; Approximately 2.5 garage spaces
- Utilities: Well water; Public sewer; Cable available
- Home design: Single-family residential property; Residential zoning; Located in Houghton Beach Subdivision
- Construction: Has basement
- Exterior features: Workshop on property; Paved road access; Lot approximately 0.42 acres (150 x 112)
Interior
- Kitchen: Refrigerator; Oven; Range; Garbage disposal; Gas water heater
- Bedrooms: Primary bedroom on lower level
- Flooring: Simulated wood flooring
- Bathrooms: 1 full bathroom; 1 half bathroom
- Heating & cooling: Baseboard heating (natural gas); Ceiling fan(s); Has cooling
- Interior features: Main-level primary bedroom; Blinds on windows; Fireplace; Basement present
- Laundry & utility: Washer; Dryer; Laundry on lower level
Neighborhood map
What this means for you Summary
Snapshot
- This is a 3-bed/1.0-bath single-family listed at $170k.
Deal economics
- At list price, monthly cash flow is $375 ($4k/yr) — positive.
- The deal already cash-flows at list — no discount required.
- Meets the 1% rule at list price ($2k rent vs $170k).
- Recommended offer: $165k (3.0% below list) — sets the bar for market timing.
Location & tenants
- Location reads: area grade C — affects rentability + tenant quality, not the cash-flow math above.
- Houghton Lake Community Schools (rural): math 18% / reading 36% proficiency, ranked #410 of 540 in MI (top 76%) — low school quality limits family demand, transient renter base, plan for 1-2y turnover.
- Zoned schools: Collins Elementary School (math 21% / reading 35%, grade F, #918 of 1,397 statewide, top 66%, 555 students, 76% FRL); Houghton Lake Jrsr High School (math 17% / reading 37%, grade F, #462 of 713 statewide, top 66%, 511 students, 71% FRL) — zoned schools average 74% FRL vs 57% district-wide (17 pts higher); higher-poverty schools than district average — tighter screening recommended.
- Market conditions: 86 active listings in the ZIP; 73 units permitted in Roscommon County in 2024 (0 in 5+ unit buildings).
Forward outlook
- Local home prices are declining (-3.0%/yr); year-one equity from $1k of loan paydown is wiped out by about $5k of value loss. Plan a longer hold.
- Roscommon County population projected at -21% by 2050 — secular population decline; favor cash flow + early exit over multi-decade hold.
Negotiation context
- It's been on market 59 days — a 3% lower offer ($165k) is reasonable based on typical stale-listing flexibility.
- Current owner paid $64k; list at $170k implies a 167% gain — meaningful room to come down on a strong offer.
Risks & watch-outs
- Watch-outs: built in 1950 — expect roof / HVAC / electrical / plumbing capex.
Questions for the listing agent
- It's been on market 59 days. Have you received any prior offers? Is the seller open to a 3% concession, seller financing, or rate buy-down credit?
- Built in 1950 — when were the roof, HVAC, electrical panel, plumbing, and water heater last replaced?
- Is there a deadline driving the sale (1031 exchange, divorce, estate, relocation)? That informs how much negotiation room exists.
- What's the average days-on-market for RENTAL listings here right now (not sales)? A rising rental-DOM trend means longer vacancies and softer asking-rent achievability than the comps imply.
- What's the recent tenant-quality profile in this submarket — average credit score on applications, eviction rate, late-payment / NSF rate, and stable-employment percentage? A property-management company in the area should have these aggregated.
- How much new for-sale + rental construction is in the pipeline within 1–3 miles? Heavy new supply typically softens prices + rents 12–24 months out; constrained supply supports both.
Investment metrics
- 1% rule
- 1.11% ✓
- Cap rate
- 8.94%
- Cash-on-cash
- 9.45%
- DSCR
- 1.42
- GRM
- 7.5
CMA / ARV
- ARV (on-the-fly)
- $200,340
- Comps found
- 11
Show comp detail 11 sales within ~0.75 mi
| Address | Dist | Beds/Ba | Sqft | Sold | Price | $/sf | Match |
|---|---|---|---|---|---|---|---|
| 227 Beverly Dr | 0.28mi | 3/1.0 | 1,258 (-0%) | 13mo | $149,900 | $119 | 76 |
| 117 Seneca Trl | 0.27mi | 3/2.0 | 1,288 (+2%) | 15mo | $238,500 | $185 | 67 |
| 321 Devonshire Dr | 0.46mi | 3/2.0 | 1,288 (+2%) | 9mo | $249,900 | $194 | 64 |
| 128 Cottage Dr | 0.03mi | 3/1.0 | 1,072 (-15%) | 21mo | $148,000 | $138 | 56 |
| 204 Beverly Dr | 0.25mi | 3/1.5 | 1,403 (+11%) | 18mo | $110,000 | $78 | 52 |
| 225 Kimberly Dr | 0.21mi | 3/2.0 | 1,118 (-11%) | 23mo | $260,000 | $233 | 48 |
| 115 Sheridan Dr | 0.18mi | 2/1.0 (-1) | 1,084 (-14%) | 20mo | $120,000 | $111 | 47 |
| 105 Oakridge Ave | 0.50mi | 2/1.0 (-1) | 1,130 (-10%) | 10mo | $179,900 | $159 | 46 |
| 225 Kimberly Dr | 0.28mi | 3/2.0 | 1,118 (-11%) | 23mo | $260,000 | $233 | 45 |
| 319 Stratford Dr | 0.31mi | 3/1.0 | 1,088 (-14%) | 23mo | $179,500 | $165 | 43 |
| 415 Chippewa Trl | 0.51mi | 3/1.5 | 1,438 (+14%) | 24mo | $212,000 | $147 | 31 |
Match score weights: distance 35% · size 25% · config 20% · recency 20%. Top-matched comps best support the ARV.
Projected returns pro-forma
-3.0% appreciation · 3.0% rent growth · sell at horizon
- IRR
- -2.1%
- Equity multiple
- 0.92×
- Total profit
- $-3,684
- Equity at exit
- $25,333
- IRR
- 7.6%
- Equity multiple
- 1.58×
- Total profit
- $27,478
- Equity at exit
- $14,690
Cash invested: $47,572 (down + closing). Projections, not guarantees.
Landlord ↔ Tenant lean methodology
- Overall (STATE)
- 62 Landlord-Friendly
- State Michigan
- 62 Landlord-Friendly · EVEN
- County
- — inherits STATE
- City
- — inherits STATE
ZIP-level market 48651
- Home prices YoY
- -25.6%
- Active inventory
- 86
- Price-to-rent
- 7.5×
Monthly cashflow live
- Estimated rent
- $1,887 medium interval (Pro) →
- Mortgage (P&I)
- −$891
- Tax from tax record
- −$154 /mo · $1,850/yr
- Insurance
- −$71
- HOA
- −$0
- Vacancy / Maint / Mgmt
- −$396
- Net cashflow
- $375
Break-even live
Sensitivity live
| Price | -10% $471 | -5% $423 | +0% $375 | +5% $326 | +10% $278 |
|---|---|---|---|---|---|
| Rent | -10% $225 | -5% $300 | +0% $375 | +5% $449 | +10% $524 |
| Rate | -1.0pp $460 | -0.5pp $418 | base $375 | +0.5pp $331 | +1.0pp $286 |
UW: 25.0% down · 7.5% · 30yr · 1.5% tax · 5.0% vac · 8.0% maint · 8.0% mgmt
Financing live
Cash to close
- Down payment
- $42,475
- Closing costs
- $5,097
- Reserves months
- —
- Total cash needed
- —
Loan-product check · same deal, 3 products live
Conventional
25% down · 7.5% · 30yr
- Down + closing
- —
- Monthly P&I
- —
- Monthly cashflow
- —
- DSCR
- —
- Eligible?
- —
Personal DTI + credit; lowest rate.
DSCR
20% down · 8.5% · 30yr
- Down + closing
- —
- Monthly P&I
- —
- Monthly cashflow
- —
- DSCR
- —
- Eligible?
- —
No personal income docs; deal must DSCR.
Hard money
10% down · 12.0% · 12mo
- Down + closing
- —
- Monthly P&I
- —
- Monthly cashflow
- —
- DSCR
- —
- Eligible?
- —
Short-term bridge; refi at stabilization.
Listing history 20 events
-
2026-06-21days on market $169,900 Active 59 DOM
-
2026-06-21days on market $169,900 Active 58 DOM
-
2026-06-18days on market $169,900 Active 56 DOM
-
2026-06-17days on market $169,900 Active 55 DOM
-
2026-06-16days on market $169,900 Active 54 DOM
-
2026-06-15days on market $169,900 Active 53 DOM
-
2026-06-13days on market $169,900 Active 51 DOM
-
2026-06-12days on market $169,900 Active 50 DOM
-
2026-06-09days on market $169,900 Active 47 DOM
-
2026-06-08days on market $169,900 Active 46 DOM
-
2026-06-07days on market $169,900 Active 45 DOM
-
2026-06-07days on market $169,900 Active 44 DOM
-
2026-06-04days on market $169,900 Active 41 DOM
-
2026-06-02days on market $169,900 Active 40 DOM
-
2026-06-01days on market $169,900 Active 39 DOM
-
2026-05-31days on market $169,900 Active 38 DOM
-
2026-05-31days on market $169,900 Active 37 DOM
-
2026-05-18price $169,900
-
2026-04-22$189,900 Active
-
2016-02-17soldstatus $63,700
ⓘ Source: listings_history table (triggers on properties + properties_extension) + one-shot
backfill from property_details.listing_events for pre-trigger history.
Tax reassessment forecast MI · Partial reset (capped growth)
- Current annual tax
- $1,850 · $154/mo
- Projected year-2 tax
- $2,233 · $186/mo
- Expected delta
- +$383/yr (+$32/mo · 20.7%)
ⓘ Screening estimate from a state-policy table — verify with the county assessor before closing.
Climate risk First Street
- Flood 1/10 Low FEMA zone X (unshaded) · 0% chance over 30 yrs
- Wildfire 2/10 Low
- Heat 1/10 Low 7 d/yr ≥92°F today · 14 d/yr by 30 yrs out
- Wind 1/10 Low
- Air quality 2/10 Low 0 unhealthy d/yr today · 1 by 30 yrs out
Nearby sold comps map
Loading sold comps map…
Walkable amenities ~0.75 mi
Loading nearby amenities…
Taxation est. · year 1
- Rental income
- $22,639
- − Mortgage interest
- −$9,517
- − Property taxes
- −$1,850
- − Insurance
- −$850
- − Repairs & maintenance
- −$1,811
- − Management
- −$1,811
- − Depreciation
- −$4,943
- Taxable income
- $1,858
- Est. tax owed @ 24.0%
- −$446
- After-tax cash flow
- $4,048/yr
For passive investors: Depreciation is non-cash, so a rental often shows a tax loss while cash-flowing — sheltering income. Rental losses are passive: they offset passive income freely, and up to $25,000/yr can offset ordinary (W-2) income if you actively participate and your MAGI is under $100k (phasing out to $0 by $150k); unused losses carry forward. On sale, claimed depreciation is recaptured at up to 25%, and gains may owe capital-gains tax (a 1031 exchange can defer both). Figures are a year-1 estimate at your 24.0% rate — not tax advice; consult a CPA.
Schools (NCES district)
- District
- Houghton Lake Community Schools
- NCES district ID
- 2618600
- Math proficiency
- 18% ▼ -7.00%
- Reading proficiency
- 36% ▼ -3.00%
- Median HH income
- $34,744
- Composite
- 22.19/100
- National rank
- #8158
- State rank
- #410 of 540 in MI
Livability — Denton
No livability data for this city. (Only ~50 U.S. cities are tracked.)
Census & demographics
- Census place
- Houghton Lake, MI
- Population (ZIP)
- 4,331
Population outlook (Roscommon County) Hauer SSP2
- Today (2025)
- 22,249 people
- By 2030
- 21,206 · -4.7%
- By 2040
- 19,070 · -14.3%
- By 2050
- 17,564 · -21.1%
- By 2075
- 15,420 · -30.7%
- By 2100
- 13,168 · -40.8%
Race, ethnicity, and origin ACS 2023
- Neighborhood character
- Predominantly White (94%)
- Race & ethnicity
- White 94% Two or more races 4% Hispanic / Latino 1%
- Common ancestry
- Romanian 9% Slovak 4% Iranian 4%
- Foreign-born
- 2%
- Languages at home
- 98% English-only · Spanish 1%
Political lean MEDSL · Roscommon
- 2024 margin
- Solid R (+32.9) · D 32.9% · R 65.9% · Other 1.2%
- 2008→2024 swing
- -35.5pp toward R · 2008: 2.5pp · 2024: -32.9pp
- All cycles
- 2024: R+32.9 2020: R+30.0 2016: R+29.6 2012: R+3.9 2008: D+2.5
Not yet ingested
- Civics
- —
Market trends
- HPI YoY
- ▼ -87.27%
- Current HPI
- 252.9662
- Rent YoY
- —
- Metro
- —
- State GDP YoY
- ▲ 1.37%
- F500 in state
- 28
Industry mix (Fortune 500 HQ in MI)
| Industry | F500 HQs | Revenue |
|---|---|---|
| Automotive Parts | 3 | $48B |
|
||
| Automotive | 2 | $372B |
|
||
| Chemicals | 1 | $45B |
|
||
| Automotive Retail | 1 | $29B |
|
||
| Healthcare / Medical Devices | 1 | $23B |
|
||
| Automotive Technology | 1 | $20B |
|
||
Price history
+166.7% since first listed3 events — show timeline
- 2026-05-18 Price Changed $169,900 WWMLS
- 2026-04-22 Listed $189,900 WWMLS
- 2016-02-17 Sold (Public Records) $63,700 Public Records
Property tax history
+2.7%/yrLatest (2025): $1,850 · +2.7% YoY. Source: county tax records.
Cash-flow waterfall
monthlySold comps — $/sqft
last 12 mo · ≤1 miLoading sold comps…