279 N 11th · Upland, CA
Flood risk 1/10 · Minimal
- FEMA flood zone
- X (unshaded)
- Chance of flooding over 30 yrs
- 0.0%
- Est. flood insurance / yr
- $507 – $1,088
Fire risk 1/10 · Minimal
- Est. fire insurance / yr
- $659 – $1,223
Heat risk 7/10 · Major
- Hot days now (above 100°F)
- 6 days/yr
- Hot days in 30 yrs
- 17 days/yr
Wind risk 1/10 · Minimal
- Chance of severe wind over 30 yrs
- —
Air-quality risk 9/10 · Severe
- Unhealthy air days now
- 23 days/yr
- Unhealthy air days in 30 yrs
- 28 days/yr
Risk factors via First Street. Map © Google.
Why this score? — see what drove the C- grade
The composite is a weighted blend of 9 inputs, each scored 0–100. Each bar is that input's sub-score; the figure is the points it added to the 100-point composite (weight × sub-score).
- Cash flow +17.7/30.0
- ARV discount +15.0/15.0
- DSCR +5.5/10.0
- Schools +4.3/10.0
- Livability +3.6/5.0
- 1% rule +3.5/10.0
- Condition / age +2.5/5.0
- Rent growth +2.4/5.0
- Appreciation +0.0/10.0
$399,900
🖨 Deal sheet 📄 Offer letter ✓ Due diligence
Listing remarks MLS
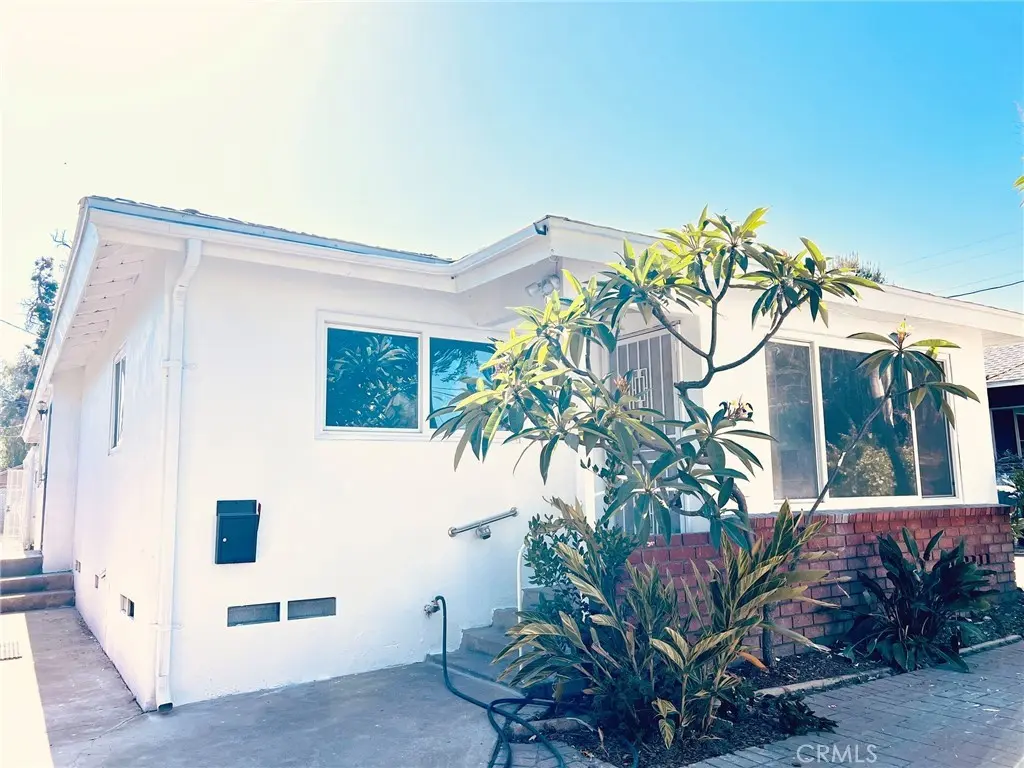
Great opportunity to buy a family home in Upland, centrally located near the 10 freeway, shops, services and close proximity to Upland High. This property features 4 bedrooms 2 bathrooms and other bonus areas suitiable for a variety of needs such as a workshop, home based business or hobbies. Both of the bathrooms have been recently updated along with newer kitchen appliances, this home is ready for your final personal touches and is primed for an ADU in the rear. Previously detached garage has been converted to a bonus room with separate entrance and alley access; a great opportunity for multigenerational families or potentially rent it to offset costs of payment after adding kitchen and bath. Affordably price Upland home with access to all of the benefits that Upland has to offer your family. The yard features low maintenance concrete and brick side yards with mature landscaping, tropical plants and fruit bearing trees.
Key facts
- Varieties of trees
- Laundry room
- 6,957 sq ft lot
Tags
Property features AI
Finance
- Other: Assessor parcel information available
- HOA & community: Community features include curbs and sidewalks
Exterior
- Parking: Two garage spaces; Two total parking spaces
- Utilities: Public sewer; District/public water
- Home design: House, one story; No accessory dwelling unit (ADU)
- Construction: Construction and year built from assessor records
- Exterior features: Front yard; No pool
Interior
- Bedrooms: Five bedrooms on the main level
- Bathrooms: Two full bathrooms
- Heating & cooling: Central heating (furnace); Central cooling
- Interior features: Single-level home with street-level entry; All bedrooms located on the main floor; Laundry room
- Laundry & utility: Independent laundry room
Neighborhood map
What this means for you Summary
Snapshot
- This is a 4-bed/2.0-bath single-family listed at $400k.
Deal economics
- At list price, monthly cash flow is $325 ($4k/yr) — positive.
- The deal already cash-flows at list — no discount required.
- To meet the 1% rule (rent ≥ 1% of price), the offer needs to be $338k (15.5% below list).
- Recommended offer: $338k (15.5% below list) — sets the bar for 1% rule.
- Cap rate 7.3% vs local median 2.7% in Upland — top-decile yield for the area; either an underpriced asset or a hidden risk that comps aren't pricing in. Stress-test before assuming the spread holds.
Location & tenants
- Location reads 72/100 on livability (#184 in CA) — a middle-class / working-renter tenant base. Strengths: amenities A+, commute A+, employment A; Watch: crime C-, health & safety C-, cost of living F.
- Upland Unified (suburban): math 39% / reading 53% proficiency, ranked #493 of 1,400 in CA (top 35%) — families likely to look elsewhere, expect single-tenant / working-renter base with shorter leases.
- Market conditions: Rents soft (-0.3%/yr); 84 active listings in the ZIP; 31 comparable units currently listed for rent nearby; rentals leasing fast (median 5d on market — plan ~1-2 weeks tenant-placement turnaround); solid renter incomes; 5,458 units permitted in San Bernardino County in 2024 (1,500 in 5+ unit buildings).
- This rent runs 44% of the median local income ($92k/yr) — at the standard rent-burdened threshold; future hikes will face affordability resistance.
Forward outlook
- Local home prices are declining (-3.0%/yr); year-one equity from $3k of loan paydown is wiped out by about $12k of value loss. Plan a longer hold.
- San Bernardino County population projected at +15% by 2050 — modest demand growth; plan on rents tracking national, not racing it.
Negotiation context
- Only 14 days on market — expect competitive offers; lowballing is unlikely to land.
- 2 sale attempts; this cycle's ask has dropped $500k (56%) from the opening price — seller is motivated, your offer sets the floor, not the list.
Risks & watch-outs
- Watch-outs: built in 1959 — expect roof / HVAC / electrical / plumbing capex.
- Climate carrying-cost: extreme-heat days projected 6→17/yr by 2055 (HVAC capex compounding) — expect insurance premiums to compound above CPI over the hold.
Questions for the listing agent
- Built in 1959 — when were the roof, HVAC, electrical panel, plumbing, and water heater last replaced?
- Is there a deadline driving the sale (1031 exchange, divorce, estate, relocation)? That informs how much negotiation room exists.
- What's the average days-on-market for RENTAL listings here right now (not sales)? A rising rental-DOM trend means longer vacancies and softer asking-rent achievability than the comps imply.
- What's the recent tenant-quality profile in this submarket — average credit score on applications, eviction rate, late-payment / NSF rate, and stable-employment percentage? A property-management company in the area should have these aggregated.
- How much new for-sale + rental construction is in the pipeline within 1–3 miles? Heavy new supply typically softens prices + rents 12–24 months out; constrained supply supports both.
Investment metrics
- 1% rule
- 0.85% ✗
- Cap rate
- 7.27%
- Cash-on-cash
- 3.48%
- DSCR
- 1.15
- GRM
- 9.9
CMA / ARV
- ARV (on-the-fly)
- $698,892
- Comps found
- 12
Show comp detail 12 sales within ~0.75 mi
| Address | Dist | Beds/Ba | Sqft | Sold | Price | $/sf | Match |
|---|---|---|---|---|---|---|---|
| 279 N 11th Ave | 0.00mi | 5/2.0 (+1) | 1,668 (0%) | 4mo | $660,000 | $396 | 92 |
| 253 N 8th Ave | 0.20mi | 4/2.0 | 1,780 (+7%) | 6mo | $710,000 | $399 | 74 |
| 404 N 9th Ave | 0.15mi | 5/2.0 (+1) | 1,822 (+9%) | 1mo | $780,000 | $428 | 72 |
| 1415 Rue Ct | 0.36mi | 3/2.5 (-1) | 1,619 (-3%) | 8mo | $669,990 | $414 | 65 |
| 1402 Rue Ct | 0.32mi | 3/2.5 (-1) | 1,550 (-7%) | 6mo | $645,000 | $416 | 61 |
| 1431 Prairie Rose Ln | 0.34mi | 3/2.5 (-1) | 1,550 (-7%) | 5mo | $665,000 | $429 | 61 |
| 1447 Prairie Rose Ln | 0.38mi | 3/2.5 (-1) | 1,572 (-6%) | 7mo | $650,000 | $413 | 60 |
| 1434 Prairie Rose Ln | 0.38mi | 3/2.5 (-1) | 1,572 (-6%) | 8mo | $685,000 | $436 | 59 |
| 1451 Prairie Rose Ln | 0.38mi | 3/2.5 (-1) | 1,550 (-7%) | 5mo | $674,990 | $435 | 59 |
| 1455 Prairie Rose Ln | 0.40mi | 3/2.5 (-1) | 1,572 (-6%) | 8mo | $722,500 | $460 | 58 |
| 1432 Prairie Rose Ln | 0.38mi | 3/2.5 (-1) | 1,550 (-7%) | 7mo | $650,000 | $419 | 58 |
| 1118 E 7th St | 0.66mi | 3/1.5 (-1) | 1,500 (-10%) | 7mo | $627,000 | $418 | 39 |
Match score weights: distance 35% · size 25% · config 20% · recency 20%. Top-matched comps best support the ARV.
Projected returns pro-forma
-3.0% appreciation · 0.0% rent growth · sell at horizon
- IRR
- -13.9%
- Equity multiple
- 0.52×
- Total profit
- $-54,242
- Equity at exit
- $59,626
- IRR
- -9.9%
- Equity multiple
- 0.47×
- Total profit
- $-59,731
- Equity at exit
- $34,576
Cash invested: $111,972 (down + closing). Projections, not guarantees.
Landlord ↔ Tenant lean methodology
- Overall (STATE)
- 18 Strongly Tenant-Friendly
- State California
- 18 Strongly Tenant-Friendly · D+13
- County
- — inherits STATE
- City
- — inherits STATE
ZIP-level market 91786
- Rents YoY
- -0.3%
- Active inventory
- 84
- Price-to-rent
- 9.9×
Monthly cashflow live
- Estimated rent
- $3,380 high interval (Pro) →
- Mortgage (P&I)
- −$2,097
- Tax from tax record
- −$82 /mo · $980/yr
- Insurance
- −$167
- HOA
- −$0
- Vacancy / Maint / Mgmt
- −$710
- Net cashflow
- $325
Break-even live
UW: 25.0% down · 7.5% · 30yr · 1.5% tax · 5.0% vac · 8.0% maint · 8.0% mgmt
Financing live
Cash to close
- Down payment
- $99,975
- Closing costs
- $11,997
- Reserves months
- —
- Total cash needed
- —
Loan-product check · same deal, 3 products live
Conventional
25% down · 7.5% · 30yr
- Down + closing
- —
- Monthly P&I
- —
- Monthly cashflow
- —
- DSCR
- —
- Eligible?
- —
Personal DTI + credit; lowest rate.
DSCR
20% down · 8.5% · 30yr
- Down + closing
- —
- Monthly P&I
- —
- Monthly cashflow
- —
- DSCR
- —
- Eligible?
- —
No personal income docs; deal must DSCR.
Hard money
10% down · 12.0% · 12mo
- Down + closing
- —
- Monthly P&I
- —
- Monthly cashflow
- —
- DSCR
- —
- Eligible?
- —
Short-term bridge; refi at stabilization.
Rent comps 31 comps
| Address | Beds | Baths | Sqft | Rent | $/sqft | DOM | Units | Dist |
|---|---|---|---|---|---|---|---|---|
| 306 N 10th Ave Apt -3 Upland, CA | 3.0 | 2.0 | 1450 | $3,000 | $2.07 | 44d | 1 | 0.06mi |
| 329 N Campus Ave Upland, CA | 3.0 | 3.0 | 1982 | $3,750 | $1.89 | 12d | 1 | 0.28mi |
| 250 Settlers Rd Upland, CA | 4.0 | 2.5 | 1972 | $3,980 | $2.02 | 19d | 1 | 0.39mi |
| 587 E Arrow Hwy Upland, CA | 5.0 | 2.0 | 2215 | $3,495 | $1.58 | 2d | 1 | 0.40mi |
| 1425 Cottonwood St Upland, CA | 3.0 | 2.5 | 1893 | $3,099 | $1.64 | 5d | 1 | 0.41mi |
| 1443 Orange Grove St Upland, CA | 4.0 | 3.0 | 2146 | $3,380 | $1.58 | 2d | 1 | 0.42mi |
| 517 D St Upland, CA | 3.0 | 2.0 | 1464 | $2,950 | $2.02 | 44d | 1 | 0.43mi |
| 158 Macintosh Way Upland, CA | 3.0 | 2.5 | 1325 | $3,300 | $2.49 | 24d | 1 | 0.50mi |
| 430 E Arrow Hwy Upland, CA | 4.0 | 2.0 | 1649 | $3,350 | $2.03 | 22d | 1 | 0.51mi |
| 430 E Arrow Hwy Upland, CA | 4.0 | 2.0 | 1600 | $3,350 | $2.09 | 17d | 1 | 0.51mi |
| 863 N 9th Ave Upland, CA | 3.0 | 2.0 | 1507 | $3,600 | $2.39 | 2d | 1 | 0.53mi |
| 392 E Arrow Hwy Upland, CA | 4.0 | 2.0 | 1930 | $4,250 | $2.20 | 2d | 1 | 0.54mi |
| 890 N Campus Ave Apt B Upland, CA | 3.0 | 1.5 | 1380 | $2,900 | $2.10 | 20d | 1 | 0.61mi |
| 111 N 1st Ave Upland, CA | 3.0 | 3.0 | 1480 | $3,750 | $2.53 | 2d | 1 | 0.76mi |
| 8210 Rancheria Dr Unit 8 Rancho Cucamonga, CA | 3.0 | 2.0 | 1200 | $2,895 | $2.41 | 2d | 1 | 0.80mi |
| 595 N Euclid Ave Upland, CA | 3.0 | 2.0 | 1298 | $2,900 | $2.23 | 4d | 1 | 0.88mi |
| 338 S Euclid Ave Upland, CA | 3.0 | 1.0 | 1203 | $2,850 | $2.37 | 4d | 1 | 0.92mi |
| 621 E Pine St Upland, CA | 4.0 | 2.0 | 1750 | $3,500 | $2.00 | 44d | 1 | 0.93mi |
| 8445 Chaffee St Rancho Cucamonga, CA | 4.0 | 2.0 | 1438 | $3,300 | $2.29 | 15d | 1 | 0.94mi |
| 8300 Gabriel Dr Unit B Rancho Cucamonga, CA | 3.0 | 2.0 | 1140 | $3,450 | $3.03 | 2d | 1 | 0.95mi |
| 8523 Jasper St Rancho Cucamonga, CA | 4.0 | 2.0 | 1640 | $3,300 | $2.01 | 2d | 1 | 0.96mi |
| 8555 Sandalwood Ct Rancho Cucamonga, CA | 3.0 | 2.0 | 1400 | $3,375 | $2.41 | 2d | 1 | 1.05mi |
| 1054 N Euclid Ave Upland, CA | 3.0 | 2.0 | 1544 | $3,600 | $2.33 | 44d | 1 | 1.08mi |
| 8491 Gabrielino Ct Unit 69 Rancho Cucamonga, CA | 3.0 | 2.5 | 1417 | $3,850 | $2.72 | 2d | 1 | 1.08mi |
| 8567 Cava Dr Rancho Cucamonga, CA | 3.0 | 2.5 | 1763 | $3,600 | $2.04 | 2d | 1 | 1.10mi |
| 1420 Felicita Ct Upland, CA | 3.0 | 2.0 | 1339 | $3,095 | $2.31 | 5d | 1 | 1.18mi |
| 8630 Cava Dr Rancho Cucamonga, CA | 4.0 | 2.5 | 1763 | $3,890 | $2.21 | 11d | 1 | 1.19mi |
| 8650 Cava Dr Rancho Cucamonga, CA | 3.0 | 2.5 | 1763 | $3,200 | $1.82 | 15d | 1 | 1.22mi |
| 558 E Princeton St Unit A Ontario, CA | 3.0 | 1.0 | 1487 | $2,695 | $1.81 | 2d | 1 | 1.27mi |
| 1467 Winston Ct Upland, CA | 4.0 | 2.0 | 1585 | $3,500 | $2.21 | 44d | 1 | 1.43mi |
| 8250 Vineyard Ave Rancho Cucamonga, CA | 2.0–3.0 | 2.0 | 1059 | $3,250 | $3.07 | 2d | 14 | 1.49mi |
Listing history 10 events
-
2026-06-18days on market $399,900 Active 14 DOM
-
2026-06-17days on market $399,900 Active 13 DOM
-
2026-06-16days on market $399,900 Active 12 DOM
-
2026-06-15days on market $399,900 Active 11 DOM
-
2026-06-13days on market $399,900 Active 9 DOM
-
2026-06-13pricedays on market $399,900 Active 8 DOM
-
2026-06-09days on market $849,900 Active 5 DOM
-
2026-06-08days on market $849,900 Active 4 DOM
-
2026-06-07remarks 286-char remark
-
2026-06-07$849,900 Active 3 DOM
ⓘ Source: listings_history table (triggers on properties + properties_extension) + one-shot
backfill from property_details.listing_events for pre-trigger history.
Tax reassessment forecast CA · Resets to sale price
- Current annual tax
- $980 · $82/mo
- Projected year-2 tax
- $3,039 · $253/mo
- Expected delta
- +$2,059/yr (+$172/mo · 210.1%)
ⓘ Screening estimate from a state-policy table — verify with the county assessor before closing.
Climate risk First Street
- Flood 1/10 Low FEMA zone X (unshaded) · 0% chance over 30 yrs
- Wildfire 1/10 Low
- Heat 7/10 Severe 6 d/yr ≥100°F today · 17 d/yr by 30 yrs out
- Wind 1/10 Low
- Air quality 9/10 Extreme 23 unhealthy d/yr today · 28 by 30 yrs out
Nearby sold comps map
Loading sold comps map…
Walkable amenities ~0.75 mi
Loading nearby amenities…
Taxation est. · year 1
- Rental income
- $40,556
- − Mortgage interest
- −$22,401
- − Property taxes
- −$980
- − Insurance
- −$2,000
- − Repairs & maintenance
- −$3,245
- − Management
- −$3,245
- − Depreciation
- −$11,633
- Taxable loss
- −$2,946
- Est. tax savings @ 24.0%
- +$707
- After-tax cash flow
- $4,602/yr
For passive investors: Depreciation is non-cash, so a rental often shows a tax loss while cash-flowing — sheltering income. Rental losses are passive: they offset passive income freely, and up to $25,000/yr can offset ordinary (W-2) income if you actively participate and your MAGI is under $100k (phasing out to $0 by $150k); unused losses carry forward. On sale, claimed depreciation is recaptured at up to 25%, and gains may owe capital-gains tax (a 1031 exchange can defer both). Figures are a year-1 estimate at your 24.0% rate — not tax advice; consult a CPA.
Schools (NCES district)
- District
- Upland Unified
- NCES district ID
- 0600016
- Math proficiency
- 39% ▲ 1.00%
- Reading proficiency
- 53% ▬ 0.00%
- Median HH income
- $66,267
- Composite
- 43.17/100
- National rank
- #6593
- State rank
- #493 of 1400 in CA
Livability — Upland
- Score
- 72/100
- State rank
- #184
- US rank
- #6041
Category grades
Schools grade is shown separately in the Schools card above.
Census & demographics
- Census place
- Upland, CA
- County
- San Bernardino County · 2,030,291 people
- City population
- 82,715
- Metro
- Riverside-San Bernardino-Ontario, CA
- Population (ZIP)
- 55,829
- Household income
- $92,458
- Rent vs Own
- Severe rent burden
- 2409.0
Population outlook (San Bernardino County) Hauer SSP2
- Today (2025)
- 2,300,329 people
- By 2030
- 2,378,907 · +3.4%
- By 2040
- 2,523,137 · +9.7%
- By 2050
- 2,642,388 · +14.9%
- By 2075
- 2,880,769 · +25.2%
- By 2100
- 2,909,436 · +26.5%
Race, ethnicity, and origin ACS 2023
- Neighborhood character
- Diverse neighborhood (Simpson 0.65)
- Race & ethnicity
- Hispanic / Latino 50% White 30% Two or more races 20% Asian 8% Black 7% Native American 1%
- Hispanic origin (detail)
- Mexican 40%
- Common ancestry
- Romanian 1% Lithuanian 1% Italian 1%
- Foreign-born
- 19% · Canada, China, South Korea
- Languages at home
- 66% English-only · Spanish 24% Chinese 2% Other Indo-European 2%
Political lean MEDSL · San Bernardino
- 2024 margin
- Toss-up / Even · D 47.5% · R 49.7% · Other 2.8%
- 2008→2024 swing
- -8.5pp toward R · 2008: 6.3pp · 2024: -2.1pp
- All cycles
- 2024: R+2.1 2020: D+10.7 2016: D+9.8 2012: D+5.4 2008: D+6.3
Not yet ingested
- Civics
- —
Market trends
- HPI YoY
- ▼ -771.58%
- Current HPI
- 379.2283
- Rent YoY
- ▼ -0.27%
- Metro
- Riverside-San Bernardino-Ontario, CA
- State GDP YoY
- ▲ 3.21%
- F500 in state
- 116
Industry mix (Fortune 500 HQ in CA)
| Industry | F500 HQs | Revenue |
|---|---|---|
| Technology | 27 | $1,492B |
|
||
| Financial Services | 3 | $174B |
|
||
| Retail | 3 | $44B |
|
||
| Insurance | 3 | $26B |
|
||
| Media / Entertainment | 2 | $115B |
|
||
| Pharmaceuticals / Biotech | 2 | $62B |
|
||
Price history
+17.2% since first listed10 events — show timeline
- 2026-06-06 Price Changed $849,900 CRMLS
- 2026-06-04 Listed $899,900 CRMLS
- 2026-03-02 Sold (MLS) $660,000 CRMLS
- 2026-02-13 Pending — CRMLS
- 2026-01-31 Contingent — CRMLS
- 2026-01-23 Price Changed $674,900 CRMLS
- 2025-11-18 Price Changed $679,000 CRMLS
- 2025-09-26 Price Changed $685,000 CRMLS
- 2025-08-07 Listed $725,000 CRMLS
- 2025-07-31 Coming Soon $725,000 CRMLS
Property tax history
+3.8%/yrLatest (2025): $980 · +3.2% YoY. Source: county tax records.
Cash-flow waterfall
monthlySold comps — $/sqft
last 12 mo · ≤1 miLoading sold comps…