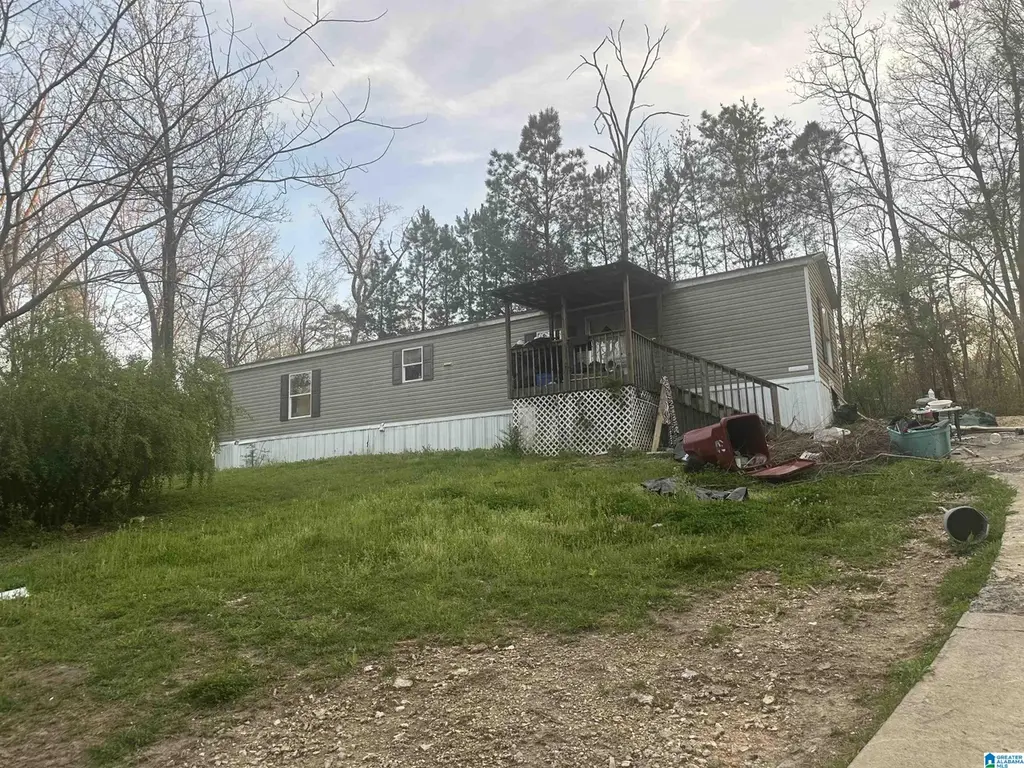
6844 Bradshaw Ln · Pinson, AL
Flood risk 1/10 · Minimal
- FEMA flood zone
- X (unshaded)
- Chance of flooding over 30 yrs
- 0.0%
- Est. flood insurance / yr
- $473 – $860
Fire risk 4/10 · Minor
- Est. fire insurance / yr
- $916 – $1,700
Heat risk 5/10 · Moderate
- Hot days now (above 105°F)
- 7 days/yr
- Hot days in 30 yrs
- 18 days/yr
Wind risk 5/10 · Moderate
- Chance of severe wind over 30 yrs
- 25.0%
Air-quality risk 5/10 · Moderate
- Unhealthy air days now
- 6 days/yr
- Unhealthy air days in 30 yrs
- 9 days/yr
Risk factors via First Street. Map © Google.
Why this score? — see what drove the B- grade
The composite is a weighted blend of 9 inputs, each scored 0–100. Each bar is that input's sub-score; the figure is the points it added to the 100-point composite (weight × sub-score).
- Cash flow +30.0/30.0
- 1% rule +10.0/10.0
- DSCR +10.0/10.0
- ARV discount +7.5/15.0
- Livability +3.0/5.0
- Rent growth +2.9/5.0
- Condition / age +2.5/5.0
- Schools +1.8/10.0
- Appreciation +0.0/10.0
$65,000
🖨 Deal sheet 📄 Offer letter ✓ Due diligence
Listing remarks MLS
Property is subject to Court approval. Property sold as-is.
Key facts
- 1 acre lot
- Built 1970
- Listed 73 days
Neighborhood map
What this means for you Summary
Snapshot
- This is a 2-bed/2.0-bath single-family listed at $65k.
Deal economics
- At list price, monthly cash flow is $757 ($9k/yr) — positive.
- The deal already cash-flows at list — no discount required.
- Meets the 1% rule at list price ($2k rent vs $65k).
- Recommended offer: $61k (6.0% below list) — sets the bar for market timing.
- Cap rate 20.3% vs local median 5.3% in Pinson — top-decile yield for the area; either an underpriced asset or a hidden risk that comps aren't pricing in. Stress-test before assuming the spread holds.
Location & tenants
- Location reads 60/100 on livability (#289 in AL) — a middle-class / working-renter tenant base. Strengths: cost of living A+, housing A+, crime B+; Watch: schools D+, amenities F, commute F.
- Jefferson County (suburban): math 9% / reading 32% proficiency, ranked #104 of 129 in AL (top 81%) — low school quality limits family demand, transient renter base, plan for 1-2y turnover.
- Market conditions: Rents rising (+1.6%/yr); 186 active listings in the ZIP; 12 comparable units currently listed for rent nearby; rentals at typical pace (median 21d on market — plan ~3-4 weeks tenant-placement turnaround); solid renter incomes; 2,114 units permitted in Jefferson County in 2024 (556 in 5+ unit buildings).
Forward outlook
- Local home prices are declining (-3.0%/yr); year-one equity from $449 of loan paydown is wiped out by about $2k of value loss. Plan a longer hold.
- Jefferson County population projected to shrink 4% by 2050 — rents likely to lag national; underwrite the cash flow, not the appreciation.
- At projected returns (-3.0% appreciation + 1.6% rent growth), your $18k cash investment doubles in ~3 years — after that, you're playing with house money.
Negotiation context
- It's been on market 73 days — a 6% lower offer ($61k) is reasonable based on typical stale-listing flexibility.
- Current owner paid $35k; list at $65k implies a 86% gain — meaningful room to come down on a strong offer.
Risks & watch-outs
- Climate carrying-cost: moderate wind risk, 25% chance of damaging wind over 30y; extreme-heat days projected 7→18/yr by 2055 (HVAC capex compounding) — expect insurance premiums to compound above CPI over the hold.
Questions for the listing agent
- It's been on market 73 days. Have you received any prior offers? Is the seller open to a 6% concession, seller financing, or rate buy-down credit?
- Built in 1970 — when were the roof, HVAC, electrical panel, plumbing, and water heater last replaced?
- Why hasn't it sold? Are there any deal-killer items the seller is aware of (foundation, flood, title, zoning, code violations)?
- Is there a deadline driving the sale (1031 exchange, divorce, estate, relocation)? That informs how much negotiation room exists.
- Schools are D-rated, which usually means shorter tenancies and higher turnover. Who's the typical renter profile here, and what's been the actual vacancy rate?
- What's the average days-on-market for RENTAL listings here right now (not sales)? A rising rental-DOM trend means longer vacancies and softer asking-rent achievability than the comps imply.
- What's the recent tenant-quality profile in this submarket — average credit score on applications, eviction rate, late-payment / NSF rate, and stable-employment percentage? A property-management company in the area should have these aggregated.
- How much new for-sale + rental construction is in the pipeline within 1–3 miles? Heavy new supply typically softens prices + rents 12–24 months out; constrained supply supports both.
Investment metrics
- 1% rule
- 2.35% ✓
- Cap rate
- 20.26%
- Cash-on-cash
- 49.89%
- DSCR
- 3.22
- GRM
- 3.5
CMA / ARV
- ARV (median comp)
- $154,000
- List price
- $65,000
- Delta
- -57.79%
- Verdict
- UNDERPRICED
- Comps
- 1 within 2.0 mi
Show comp detail 8 sales within ~0.75 mi
| Address | Dist | Beds/Ba | Sqft | Sold | Price | $/sf | Match |
|---|---|---|---|---|---|---|---|
| 6745 Womack Rd | 0.50mi | 3/2.0 (+1) | 1,536 (+2%) | 7mo | $191,500 | $125 | 62 |
| 6602 Davison Rd | 0.52mi | 3/2.0 (+1) | 1,602 (+7%) | 1mo | $185,000 | $115 | 58 |
| 5439 Faucett Rd | 0.40mi | 3/2.0 (+1) | 1,448 (-4%) | 15mo | $159,900 | $110 | 58 |
| 6592 Telia Dr | 0.59mi | 3/2.0 (+1) | 1,606 (+7%) | 5mo | $210,000 | $131 | 51 |
| 4832 Deer Foot Cv | 0.58mi | 3/2.0 (+1) | 1,714 (+14%) | 2mo | $258,000 | $151 | 42 |
| 5557 Melissa Dr | 0.50mi | 3/2.0 (+1) | 1,603 (+7%) | 23mo | $235,900 | $147 | 41 |
| 6590 Davison Rd | 0.57mi | 3/2.0 (+1) | 1,622 (+8%) | 21mo | $186,000 | $115 | 37 |
| 6709 Mcduffie Rd | 0.67mi | 3/2.0 (+1) | 1,634 (+9%) | 16mo | $230,000 | $141 | 36 |
Match score weights: distance 35% · size 25% · config 20% · recency 20%. Top-matched comps best support the ARV.
Projected returns pro-forma
-3.0% appreciation · 1.61% rent growth · sell at horizon
- IRR
- 46.0%
- Equity multiple
- 2.96×
- Total profit
- $35,581
- Equity at exit
- $9,692
- IRR
- 51.2%
- Equity multiple
- 5.66×
- Total profit
- $84,735
- Equity at exit
- $5,620
Cash invested: $18,200 (down + closing). Projections, not guarantees.
Landlord ↔ Tenant lean methodology
- Overall (STATE)
- 90 Strongly Landlord-Friendly
- State Alabama
- 90 Strongly Landlord-Friendly · R+15
- County
- — inherits STATE
- City
- — inherits STATE
ZIP-level market 35126
- Home prices YoY
- -22.4%
- Rents YoY
- 1.6%
- Active inventory
- 186
- Price-to-rent
- 3.5×
Monthly cashflow live
- Estimated rent
- $1,526 high interval (Pro) →
- Mortgage (P&I)
- −$341
- Tax est. 1.5%
- −$81 /mo · $975/yr
- Insurance
- −$27
- HOA
- −$0
- Vacancy / Maint / Mgmt
- −$321
- Net cashflow
- $757
Break-even live
UW: 25.0% down · 7.5% · 30yr · 1.5% tax · 5.0% vac · 8.0% maint · 8.0% mgmt
Financing live
Cash to close
- Down payment
- $16,250
- Closing costs
- $1,950
- Reserves months
- —
- Total cash needed
- —
Loan-product check · same deal, 3 products live
Conventional
25% down · 7.5% · 30yr
- Down + closing
- —
- Monthly P&I
- —
- Monthly cashflow
- —
- DSCR
- —
- Eligible?
- —
Personal DTI + credit; lowest rate.
DSCR
20% down · 8.5% · 30yr
- Down + closing
- —
- Monthly P&I
- —
- Monthly cashflow
- —
- DSCR
- —
- Eligible?
- —
No personal income docs; deal must DSCR.
Hard money
10% down · 12.0% · 12mo
- Down + closing
- —
- Monthly P&I
- —
- Monthly cashflow
- —
- DSCR
- —
- Eligible?
- —
Short-term bridge; refi at stabilization.
Rent comps 12 comps
| Address | Beds | Baths | Sqft | Rent | $/sqft | DOM | Units | Dist |
|---|---|---|---|---|---|---|---|---|
| 5433 Faucett Rd Pinson, AL | 3.0 | 2.0 | 1148 | $1,395 | $1.22 | 10d | 1 | 0.43mi |
| 5421 Faucett Rd Pinson, AL | 3.0 | 2.0 | 1248 | $1,195 | $0.96 | 3d | 1 | 0.44mi |
| 4800 Deer Foot Cv Pinson, AL | 3.0 | 2.0 | 1550 | $1,730 | $1.12 | 43d | 1 | 0.52mi |
| 6594 Davison Rd Pinson, AL | 3.0 | 2.0 | 1304 | $1,650 | $1.27 | 23d | 1 | 0.52mi |
| 4832 Deer Foot Cv Pinson, AL | 3.0 | 2.0 | 1714 | $1,556 | $0.91 | 21d | 1 | 0.58mi |
| 6568 Davison Rd Pinson, AL | 3.0 | 2.0 | 1054 | $1,435 | $1.36 | 43d | 1 | 0.58mi |
| 6541 Womack Rd Pinson, AL | 3.0 | 2.0 | 1146 | $1,470 | $1.28 | 23d | 1 | 0.64mi |
| 6877 Briarwood Dr Pinson, AL | 3.0 | 2.0 | 1390 | $1,595 | $1.15 | 43d | 1 | 0.75mi |
| 4541 Morgan Dr Pinson, AL | 3.0 | 2.0 | 1610 | $1,795 | $1.11 | 11d | 1 | 0.98mi |
| 6937 Brandi Cir Pinson, AL | 3.0 | 2.0 | 1648 | $1,735 | $1.05 | 3d | 1 | 1.10mi |
| 6469 Chrissy Dr Pinson, AL | 3.0 | 2.0 | 1110 | $1,465 | $1.32 | 10d | 1 | 1.10mi |
| 7436 Hitching Post Dr Pinson, AL | 3.0 | 1.0 | 1980 | $1,350 | $0.68 | 16d | 1 | 1.40mi |
Listing history 15 events
-
2026-06-18days on market $65,000 Active 73 DOM
-
2026-06-17days on market $65,000 Active 72 DOM
-
2026-06-16days on market $65,000 Active 71 DOM
-
2026-06-15days on market $65,000 Active 70 DOM
-
2026-06-13days on market $65,000 Active 68 DOM
-
2026-06-10days on market $65,000 Active 65 DOM
-
2026-06-09days on market $65,000 Active 64 DOM
-
2026-06-08days on market $65,000 Active 63 DOM
-
2026-06-07days on market $65,000 Active 62 DOM
-
2026-06-03days on market $65,000 Active 58 DOM
-
2026-06-02days on market $65,000 Active 57 DOM
-
2026-06-01days on market $65,000 Active 56 DOM
-
2026-05-31days on market $65,000 Active 55 DOM
-
2026-03-31$65,000 Active 59-char remark
Show marketing remark (59 chars)
Property is subject to Court approval. Property sold as-is.
-
1997-05-20soldstatus $35,000
ⓘ Source: listings_history table (triggers on properties + properties_extension) + one-shot
backfill from property_details.listing_events for pre-trigger history.
Climate risk First Street
- Flood 1/10 Low FEMA zone X (unshaded) · 0% chance over 30 yrs
- Wildfire 4/10 Moderate
- Heat 5/10 Major 7 d/yr ≥105°F today · 18 d/yr by 30 yrs out
- Wind 5/10 Major 25% chance of damaging wind over 30 yrs
- Air quality 5/10 Major 6 unhealthy d/yr today · 9 by 30 yrs out
Nearby sold comps map
Loading sold comps map…
Walkable amenities ~0.75 mi
Loading nearby amenities…
Taxation est. · year 1
- Rental income
- $18,318
- − Mortgage interest
- −$3,641
- − Property taxes
- −$975
- − Insurance
- −$325
- − Repairs & maintenance
- −$1,465
- − Management
- −$1,465
- − Depreciation
- −$1,891
- Taxable income
- $8,555
- Est. tax owed @ 24.0%
- −$2,053
- After-tax cash flow
- $7,028/yr
For passive investors: Depreciation is non-cash, so a rental often shows a tax loss while cash-flowing — sheltering income. Rental losses are passive: they offset passive income freely, and up to $25,000/yr can offset ordinary (W-2) income if you actively participate and your MAGI is under $100k (phasing out to $0 by $150k); unused losses carry forward. On sale, claimed depreciation is recaptured at up to 25%, and gains may owe capital-gains tax (a 1031 exchange can defer both). Figures are a year-1 estimate at your 24.0% rate — not tax advice; consult a CPA.
Schools (NCES district)
- District
- Jefferson County
- NCES district ID
- 0101920
- Math proficiency
- 9% ▼ -24.00%
- Reading proficiency
- 32% ▼ -5.00%
- Median HH income
- $51,712
- Composite
- 18.4/100
- National rank
- #8937
- State rank
- #104 of 129 in AL
Livability — Pinson
- Score
- 60/100
- State rank
- #289
- US rank
- #18763
Category grades
Schools grade is shown separately in the Schools card above.
Census & demographics
- County
- Jefferson County · 527,445 people
- City population
- 22,599
- Metro
- Birmingham-Hoover, AL
- Population (ZIP)
- 22,599
- Household income
- $83,732
- Rent vs Own
- Severe rent burden
- 267.0
Population outlook (Jefferson County) Hauer SSP2
- Today (2025)
- 669,185 people
- By 2030
- 669,694 · +0.1%
- By 2040
- 661,388 · -1.2%
- By 2050
- 643,086 · -3.9%
- By 2075
- 577,267 · -13.7%
- By 2100
- 474,758 · -29.1%
Race, ethnicity, and origin ACS 2023
- Neighborhood character
- Diverse neighborhood (Simpson 0.58)
- Race & ethnicity
- White 58% Black 28% Hispanic / Latino 8% Two or more races 7% Asian 2%
- Hispanic origin (detail)
- Mexican 5% Puerto Rican 1%
- Common ancestry
- Slovak 2% Lithuanian 1% Italian 1%
- Foreign-born
- 5% · Canada, China, Jamaica
- Languages at home
- 92% English-only · Spanish 5% Vietnamese 1% Chinese 0%
Political lean MEDSL · Jefferson
- 2024 margin
- D (+10.4) · D 54.6% · R 44.2% · Other 1.2%
- 2008→2024 swing
- +5.4pp toward D · 2008: 5.1pp · 2024: 10.4pp
- All cycles
- 2024: D+10.4 2020: D+13.2 2016: D+7.2 2012: D+6.0 2008: D+5.1
Not yet ingested
- Civics
- —
Market trends
- HPI YoY
- ▼ -54.52%
- Current HPI
- 188.6439
- Rent YoY
- ▲ 1.61%
- Metro
- Birmingham-Hoover, AL
- State GDP YoY
- ▲ 2.94%
- F500 in state
- 4
Industry mix (Fortune 500 HQ in AL)
| Industry | F500 HQs | Revenue |
|---|---|---|
| Financial Services | 1 | $8B |
|
||
| Healthcare | 1 | $5B |
|
||
Price history
+85.7% since first listed2 events — show timeline
- 2026-03-31 Listed $65,000 Greater Alabama MLS
- 1997-05-20 Sold (Public Records) $35,000 Public Records
Cash-flow waterfall
monthlySold comps — $/sqft
last 12 mo · ≤1 miLoading sold comps…