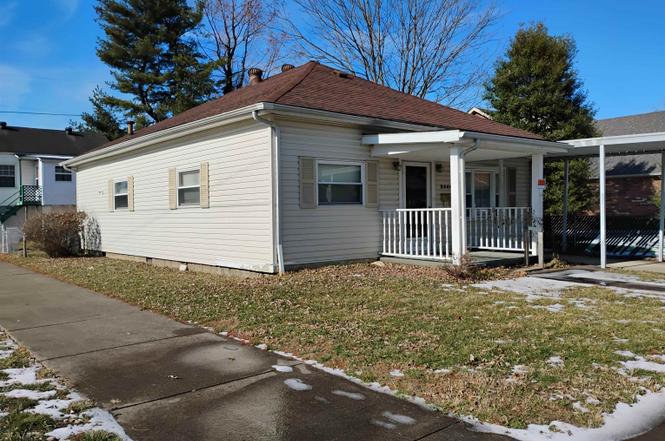
2444 S 10th · Ironton, OH
Flood risk 4/10 · Minor
- FEMA flood zone
- X
- Chance of flooding over 30 yrs
- 0.21%
- Est. flood insurance / yr
- $507 – $1,088
Fire risk 5/10 · Moderate
- Est. fire insurance / yr
- $713 – $1,323
Heat risk 5/10 · Moderate
- Hot days now (above 102°F)
- 7 days/yr
- Hot days in 30 yrs
- 20 days/yr
Wind risk 2/10 · Minimal
- Chance of severe wind over 30 yrs
- 2.0%
Air-quality risk 2/10 · Minimal
- Unhealthy air days now
- 0 days/yr
- Unhealthy air days in 30 yrs
- 2 days/yr
Risk factors via First Street. Map © Google.
Why this score? — see what drove the D grade
The composite is a weighted blend of 9 inputs, each scored 0–100. Each bar is that input's sub-score; the figure is the points it added to the 100-point composite (weight × sub-score).
- Cash flow +13.2/30.0
- ARV discount +8.9/15.0
- Schools +4.6/10.0
- DSCR +4.0/10.0
- Livability +3.6/5.0
- 1% rule +2.6/10.0
- Rent growth +2.5/5.0
- Condition / age +2.5/5.0
- Appreciation +0.0/10.0
$139,900
🖨 Deal sheet 📄 Offer letter ✓ Due diligence
Listing remarks
This home has a very large master bedroom and deep closet, a small home office, the enclosed rear porch is heated and is a family room year round. Owner installed lots of storage areas and it is move in ready.
Key facts
- Heated family room
- Deep closet
- Master bedroom
Tags
Property features AI
Exterior
- Home design: Single-family residence; One story
- Construction: Vinyl siding; Shingle roof
- Exterior features: Porch; Chain link fencing; Level lot
Interior
- Bathrooms: 1 full bathroom
- Heating & cooling: Central Air; Central heating (Natural Gas)
- Interior features: Central heating and cooling; Natural gas heat
Neighborhood map
What this means for you Summary
Snapshot
- This is a 3-bed/1.0-bath single-family listed at $140k.
Deal economics
- At list price, monthly cash flow is $-3 ($-38/yr) — negative.
- To cash-flow at today's rent, offer at most $139k (0.4% below list).
- To meet the 1% rule (rent ≥ 1% of price), the offer needs to be $107k (23.6% below list).
- Recommended offer: $107k (23.6% below list) — sets the bar for 1% rule.
- Cap rate 6.3% vs local median 5.1% in Ironton — meaningfully above typical; check what's discounted (condition, days-on-market, listing class) to confirm the premium yield is real.
Location & tenants
- Location reads 72/100 on livability (#354 in OH) — a middle-class / working-renter tenant base. Strengths: cost of living A+, health & safety A+, housing A-; Watch: amenities F, commute F, employment D-.
- Ironton City School District (suburban): math 54% / reading 58% proficiency, ranked #382 of 656 in OH (top 58%) — acceptable for families but not a draw, mixed tenant base, ~2y average lease.
- Market conditions: 84 active listings in the ZIP; 18 units permitted in Lawrence County in 2024 (0 in 5+ unit buildings).
Forward outlook
- Local home prices are declining (-3.0%/yr); year-one equity from $967 of loan paydown is wiped out by about $4k of value loss. Plan a longer hold.
- Lawrence County population projected at -22% by 2050 — secular population decline; favor cash flow + early exit over multi-decade hold.
Negotiation context
- It's been on market 41 days — a 3% lower offer ($136k) is reasonable based on typical stale-listing flexibility.
- 2 sale attempts; this cycle's ask has dropped $139.76M (100%) from the opening price — seller is motivated, your offer sets the floor, not the list.
- Current owner paid $25k; list at $140k implies a 460% gain — meaningful room to come down on a strong offer.
Risks & watch-outs
- Watch-outs: built in 1930 — expect roof / HVAC / electrical / plumbing capex.
- Climate carrying-cost: moderate wildfire risk; extreme-heat days projected 7→20/yr by 2055 (HVAC capex compounding) — expect insurance premiums to compound above CPI over the hold.
Questions for the listing agent
- What do current leases actually rent for vs. the listed asking? Can we see a recent rent roll and the last 12 months of T-12 income?
- It's been on market 41 days. Have you received any prior offers? Is the seller open to a 24% concession, seller financing, or rate buy-down credit?
- Built in 1930 — when were the roof, HVAC, electrical panel, plumbing, and water heater last replaced?
- Is there a deadline driving the sale (1031 exchange, divorce, estate, relocation)? That informs how much negotiation room exists.
- Schools are B-rated — typically a magnet for longer-tenancy family renters. What's the average tenant stay here, and is there a school-zone premium baked into asking?
- The area grade is low — what's the realistic commute time and amenity access for the typical tenant pool here? Any planned neighborhood developments (good or bad) we should know about?
- What's the average days-on-market for RENTAL listings here right now (not sales)? A rising rental-DOM trend means longer vacancies and softer asking-rent achievability than the comps imply.
- What's the recent tenant-quality profile in this submarket — average credit score on applications, eviction rate, late-payment / NSF rate, and stable-employment percentage? A property-management company in the area should have these aggregated.
- How much new for-sale + rental construction is in the pipeline within 1–3 miles? Heavy new supply typically softens prices + rents 12–24 months out; constrained supply supports both.
Investment metrics
- 1% rule
- 0.76% ✗
- Cap rate
- 6.27%
- Cash-on-cash
- -0.10%
- DSCR
- 1.00
- GRM
- 10.9
CMA / ARV
- ARV (on-the-fly)
- $144,336
- Comps found
- 12
Show comp detail 12 sales within ~0.75 mi
| Address | Dist | Beds/Ba | Sqft | Sold | Price | $/sf | Match |
|---|---|---|---|---|---|---|---|
| 2721 So 8th St | 0.31mi | 2/1.0 (-1) | 1,164 (0%) | 5mo | $107,000 | $92 | 76 |
| 2601 South 6th St | 0.29mi | 2/1.0 (-1) | 1,128 (-3%) | 2mo | $140,000 | $124 | 74 |
| 2420 S 10th St | 0.06mi | 3/2.0 | 990 (-15%) | 1mo | $180,000 | $182 | 68 |
| 707 Mastin Ave | 0.41mi | 3/2.0 | 1,200 (+3%) | 7mo | $165,000 | $138 | 65 |
| 2725 S 5th St | 0.41mi | 2/1.0 (-1) | 1,100 (-6%) | 3mo | $120,000 | $109 | 64 |
| 2726 S 9th Street St | 0.29mi | 3/1.5 | 1,287 (+11%) | 8mo | $150,900 | $117 | 60 |
| 2001 Liberty Ave | 0.39mi | 2/1.0 (-1) | 1,067 (-8%) | 4mo | $80,000 | $75 | 60 |
| 2434 S 4th St | 0.40mi | 2/1.0 (-1) | 1,256 (+8%) | 9mo | $129,900 | $103 | 56 |
| 323 Neal Ave | 0.61mi | 2/1.0 (-1) | 1,273 (+9%) | 2mo | $101,000 | $79 | 49 |
| 1913 S 3rd St | 0.60mi | 3/2.0 | 1,248 (+7%) | 11mo | $195,000 | $156 | 47 |
| 3107 South 4th St | 0.70mi | 2/1.0 (-1) | 1,248 (+7%) | 7mo | $155,000 | $124 | 44 |
| 1703 S 5th St | 0.64mi | 3/1.5 | 1,296 (+11%) | 8mo | $185,000 | $143 | 43 |
Match score weights: distance 35% · size 25% · config 20% · recency 20%. Top-matched comps best support the ARV.
Projected returns pro-forma
-3.0% appreciation · 3.0% rent growth · sell at horizon
- IRR
- -16.5%
- Equity multiple
- 0.41×
- Total profit
- $-22,927
- Equity at exit
- $20,860
- IRR
- -8.4%
- Equity multiple
- 0.48×
- Total profit
- $-20,454
- Equity at exit
- $12,096
Cash invested: $39,172 (down + closing). Projections, not guarantees.
Landlord ↔ Tenant lean methodology
- Overall (STATE)
- 73 Landlord-Friendly
- State Ohio
- 73 Landlord-Friendly · R+6
- County
- — inherits STATE
- City
- — inherits STATE
ZIP-level market 45638
- Home prices YoY
- -19.6%
- Active inventory
- 84
- Price-to-rent
- 10.9×
Monthly cashflow live
- Estimated rent
- $1,069 medium interval (Pro) →
- Mortgage (P&I)
- −$734
- Tax from tax record
- −$55 /mo · $665/yr
- Insurance
- −$58
- HOA
- −$0
- Vacancy / Maint / Mgmt
- −$224
- Net cashflow
- $-3
Break-even live
UW: 25.0% down · 7.5% · 30yr · 1.5% tax · 5.0% vac · 8.0% maint · 8.0% mgmt
Financing live
Cash to close
- Down payment
- $34,975
- Closing costs
- $4,197
- Reserves months
- —
- Total cash needed
- —
Loan-product check · same deal, 3 products live
Conventional
25% down · 7.5% · 30yr
- Down + closing
- —
- Monthly P&I
- —
- Monthly cashflow
- —
- DSCR
- —
- Eligible?
- —
Personal DTI + credit; lowest rate.
DSCR
20% down · 8.5% · 30yr
- Down + closing
- —
- Monthly P&I
- —
- Monthly cashflow
- —
- DSCR
- —
- Eligible?
- —
No personal income docs; deal must DSCR.
Hard money
10% down · 12.0% · 12mo
- Down + closing
- —
- Monthly P&I
- —
- Monthly cashflow
- —
- DSCR
- —
- Eligible?
- —
Short-term bridge; refi at stabilization.
Listing history 13 events
-
2026-06-09days on market $139,900 Active 41 DOM
-
2026-06-08days on market $139,900 Active 40 DOM
-
2026-06-08days on market $139,900 Active 39 DOM
-
2026-06-07days on market $139,900 Active 38 DOM
-
2026-06-04days on market $139,900 Active 35 DOM
-
2026-06-02days on market $139,900 Active 34 DOM
-
2026-06-01days on market $139,900 Active 33 DOM
-
2026-05-31days on market $139,900 Active 32 DOM
-
2026-05-18status Active
-
2026-03-06status Pending
-
2026-02-15price $139,900
-
2026-02-12$139,900,000 Active
-
2016-11-18soldstatus $25,000
ⓘ Source: listings_history table (triggers on properties + properties_extension) + one-shot
backfill from property_details.listing_events for pre-trigger history.
Tax reassessment forecast OH · Partial reset (capped growth)
- Current annual tax
- $665 · $55/mo
- Projected year-2 tax
- $1,424 · $119/mo
- Expected delta
- +$759/yr (+$63/mo · 114.0%)
ⓘ Screening estimate from a state-policy table — verify with the county assessor before closing.
Climate risk First Street
- Flood 4/10 Moderate FEMA zone X · 21% chance over 30 yrs
- Wildfire 5/10 Major
- Heat 5/10 Major 7 d/yr ≥102°F today · 20 d/yr by 30 yrs out
- Wind 2/10 Low 2% chance of damaging wind over 30 yrs
- Air quality 2/10 Low 0 unhealthy d/yr today · 2 by 30 yrs out
Nearby sold comps map
Loading sold comps map…
Walkable amenities ~0.75 mi
Loading nearby amenities…
Taxation est. · year 1
- Rental income
- $12,824
- − Mortgage interest
- −$7,837
- − Property taxes
- −$665
- − Insurance
- −$700
- − Repairs & maintenance
- −$1,026
- − Management
- −$1,026
- − Depreciation
- −$4,070
- Taxable loss
- −$2,499
- Est. tax savings @ 24.0%
- +$600
- After-tax cash flow
- $562/yr
For passive investors: Depreciation is non-cash, so a rental often shows a tax loss while cash-flowing — sheltering income. Rental losses are passive: they offset passive income freely, and up to $25,000/yr can offset ordinary (W-2) income if you actively participate and your MAGI is under $100k (phasing out to $0 by $150k); unused losses carry forward. On sale, claimed depreciation is recaptured at up to 25%, and gains may owe capital-gains tax (a 1031 exchange can defer both). Figures are a year-1 estimate at your 24.0% rate — not tax advice; consult a CPA.
Schools (NCES district)
- District
- Ironton City School District
- NCES district ID
- 3904414
- Math proficiency
- 54% ▼ -10.00%
- Reading proficiency
- 58% ▼ -7.00%
- Median HH income
- $32,999
- Composite
- 46.13/100
- National rank
- #2505
- State rank
- #382 of 656 in OH
Livability — Ironton
- Score
- 72/100
- State rank
- #354
- US rank
- #5718
Category grades
Schools grade is shown separately in the Schools card above.
Census & demographics
- Census place
- Ironton, OH
- County
- Lawrence · 57,020 people
- Metro
- Huntington-Ashland, WV-KY-OH
- Population (ZIP)
- 19,921
- Household income
- $49,544
- Rent vs Own
- Severe rent burden
- 10.7
Population outlook (Lawrence County) Hauer SSP2
- Today (2025)
- 57,915 people
- By 2030
- 55,650 · -3.9%
- By 2040
- 50,523 · -12.8%
- By 2050
- 45,103 · -22.1%
- By 2075
- 32,441 · -44.0%
- By 2100
- 21,754 · -62.4%
Race, ethnicity, and origin ACS 2023
- Neighborhood character
- Predominantly White (95%)
- Race & ethnicity
- White 95% Two or more races 3% Black 1%
- Common ancestry
- Slovak 2% Iranian 2% Lithuanian 1%
- Foreign-born
- 0%
Political lean MEDSL · Lawrence
- 2024 margin
- Solid R (+50.5) · D 24.4% · R 74.9%
- 2008→2024 swing
- -35.2pp toward R · 2008: -15.3pp · 2024: -50.5pp
- All cycles
- 2024: R+50.5 2020: R+45.6 2016: R+43.9 2012: R+15.5 2008: R+15.3
Not yet ingested
- Civics
- —
Market trends
- HPI YoY
- ▼ -48.00%
- Current HPI
- 196.7459
- Rent YoY
- —
- Metro
- —
- State GDP YoY
- ▲ 1.98%
- F500 in state
- 48
Industry mix (Fortune 500 HQ in OH)
| Industry | F500 HQs | Revenue |
|---|---|---|
| Insurance | 3 | $145B |
|
||
| Industrial Machinery | 3 | $49B |
|
||
| Financial Services | 3 | $24B |
|
||
| Consumer Goods | 2 | $93B |
|
||
| Aerospace / Defense | 2 | $47B |
|
||
| Utilities | 2 | $33B |
|
||
Price history
+459.6% since first listed5 events — show timeline
- 2026-05-18 Relisted — HBRMLS
- 2026-03-06 Pending — HBRMLS
- 2026-02-15 Price Changed $139,900 HBRMLS
- 2026-02-12 Listed $139,900,000 HBRMLS
- 2016-11-18 Sold (Public Records) $25,000 Public Records
Property tax history
+0.5%/yrLatest (2025): $665 · +29.2% YoY. Source: county tax records.
Cash-flow waterfall
monthlySold comps — $/sqft
last 12 mo · ≤1 miLoading sold comps…