 Multi-family
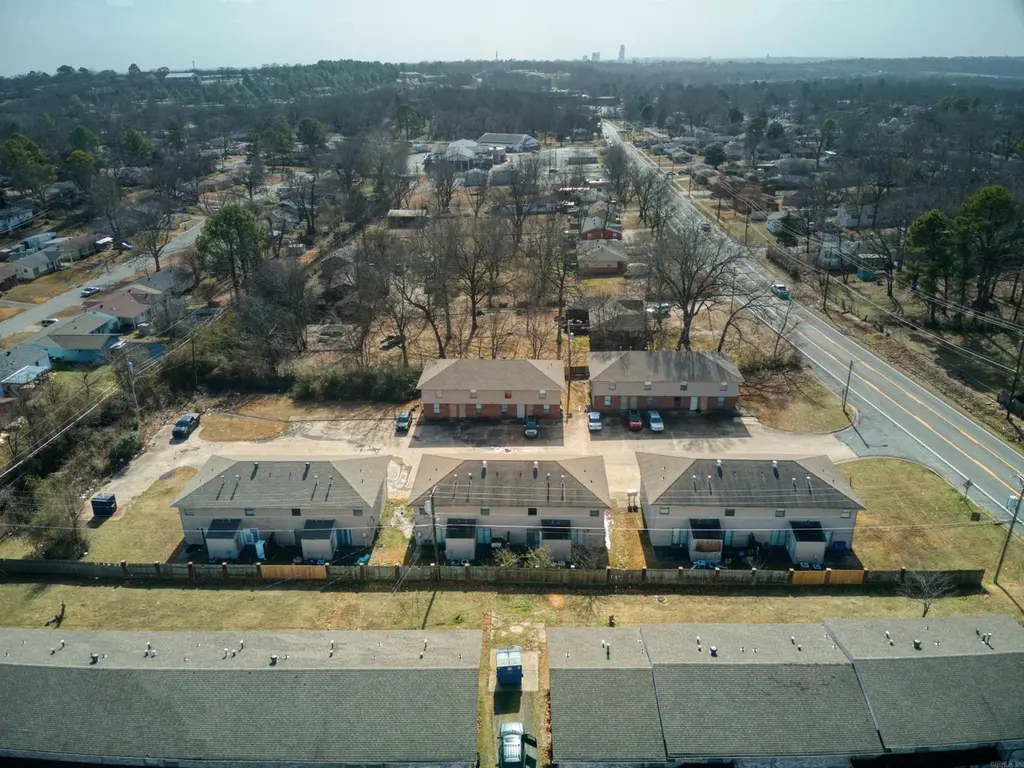
1 Sherwood Multi Package Properties Dr · Sherwood, AR
Flood risk No data
- FEMA flood zone
- —
- Chance of flooding over 30 yrs
- —
- Est. flood insurance / yr
- —
Fire risk No data
- Est. fire insurance / yr
- —
Heat risk No data
- Hot days now (above threshold)
- —
- Hot days in 30 yrs
- —
Wind risk No data
- Chance of severe wind over 30 yrs
- —
Air-quality risk No data
- Unhealthy air days now
- —
- Unhealthy air days in 30 yrs
- —
Risk factors via First Street. Map © Google.
Why this score? — see what drove the C grade
The composite is a weighted blend of 9 inputs, each scored 0–100. Each bar is that input's sub-score; the figure is the points it added to the 100-point composite (weight × sub-score).
- Cash flow +23.3/30.0
- DSCR +7.5/10.0
- ARV discount +7.5/15.0
- 1% rule +6.1/10.0
- Rent growth +3.7/5.0
- Livability +3.7/5.0
- Condition / age +2.8/5.0
- Schools +2.6/10.0
- Appreciation +0.0/10.0
$17,000,000
🖨 Deal sheet 📄 Offer letter ✓ Due diligence
Multi-family units
County records classify this as Multi-Family (5+ Unit). Listing-text estimate: 1 unit. estimate disagrees with records
5+ unit building — per-unit beds/baths from public records are typically unavailable; the breakdown below (if shown) is an estimate from the listing text.
Listing remarks MLS
Prime investment opportunity! This turnkey residential RE portfolio includes 163 units (65 properties) located across Sherwood, North Little Rock & Jacksonville, currently operating with a strong occupancy rate. The portfolio offers excellent cash flow potential and long-term value, with many properties already updated, reducing immediate capital improvement needs. The diverse mix of property types provides strong income stability and risk diversification, including 37 single-family homes, 1 condo, 16 duplexes, four four-plexes, one five-plex, one six-plex, one eight-plex, two ten-plexes, one twelve-plex, one seventeen-plex & one twenty-plex. Additionally, seven properties feature four-bedroom floor plans currently renting between $1,350 and $1,675 per month, adding to the income potential. This portfolio is ideal for investors looking to scale their real estate holdings with an established asset base already producing income. The current management company is available to continue overseeing operations, providing a seamless transition for the next owner. Opportunities to acquire a portfolio of this size with strong occupancy and established management are rare. See agent notes.
Key facts
- Garage
- Listed 73 days
Neighborhood map
What this means for you Summary
Snapshot
- This is a multifamily listed at $17.00M. Condition is rated average.
Deal economics
- At list price, monthly cash flow is $31k ($374k/yr) — positive.
- The deal already cash-flows at list — no discount required.
- Meets the 1% rule at list price ($188k rent vs $17.00M).
- Recommended offer: $15.98M (6.0% below list) — sets the bar for market timing.
- Cap rate 8.5% vs local median 4.3% in Sherwood — top-decile yield for the area; either an underpriced asset or a hidden risk that comps aren't pricing in. Stress-test before assuming the spread holds.
Location & tenants
- Location reads 73/100 on livability (#19 in AR) — a middle-class / working-renter tenant base. Strengths: cost of living A+, housing A+, health & safety A+; Watch: crime F, amenities F, commute F.
- Pulaski County Spec. School District (rural): math 27% / reading 31% proficiency, ranked #150 of 238 in AR (top 63%) — low school quality limits family demand, transient renter base, plan for 1-2y turnover.
- Market conditions: Rents rising fast (+4.8%/yr); 243 active listings in the ZIP; solid renter incomes; 1,006 units permitted in Pulaski County in 2024 (0 in 5+ unit buildings).
- At $188,215/mo this rent would consume 2949% of the median local household income ($77k/yr) (locally 774% of renters already pay >50% of income on rent) — very limited rent-growth headroom before tenants either downsize or default.
Forward outlook
- Local home prices are declining (-3.0%/yr); year-one equity from $118k of loan paydown is wiped out by about $510k of value loss. Plan a longer hold.
- Pulaski County population projected at +6% by 2050 — modest demand growth; plan on rents tracking national, not racing it.
- At projected returns (-3.0% appreciation + 4.8% rent growth), your $4.76M cash investment doubles in ~10 years — after that, you're playing with house money.
Negotiation context
- It's been on market 73 days — a 6% lower offer ($15.98M) is reasonable based on typical stale-listing flexibility.
- 3 sale attempts with the ask held roughly flat each time — persistent listings suggest the price (not the market) is what's stuck; bring a comps-based counter.
Questions for the listing agent
- It's been on market 73 days. Have you received any prior offers? Is the seller open to a 6% concession, seller financing, or rate buy-down credit?
- Why hasn't it sold? Are there any deal-killer items the seller is aware of (foundation, flood, title, zoning, code violations)?
- Is there a deadline driving the sale (1031 exchange, divorce, estate, relocation)? That informs how much negotiation room exists.
- Crime grade is F in this area — have there been break-ins, vandalism, or insurance claims at this property in the last 3 years? What carrier currently insures it and at what premium?
- What's the average days-on-market for RENTAL listings here right now (not sales)? A rising rental-DOM trend means longer vacancies and softer asking-rent achievability than the comps imply.
- What's the recent tenant-quality profile in this submarket — average credit score on applications, eviction rate, late-payment / NSF rate, and stable-employment percentage? A property-management company in the area should have these aggregated.
- How much new apartment / multifamily construction is in the pipeline within 1–3 miles? Heavy new supply (>2% of stock underway) typically softens rents 12–24 months out; light construction supports rent growth.
Investment metrics
- 1% rule
- 1.11% ✓
- Cap rate
- 8.50%
- Cash-on-cash
- 7.87%
- DSCR
- 1.35
- GRM
- 7.5
CMA / ARV
No comps found within radius.
Projected returns pro-forma
-3.0% appreciation · 4.81% rent growth · sell at horizon
- IRR
- -2.3%
- Equity multiple
- 0.91×
- Total profit
- $-415,384
- Equity at exit
- $2,534,755
- IRR
- 9.3%
- Equity multiple
- 1.78×
- Total profit
- $3,694,976
- Equity at exit
- $1,469,849
Cash invested: $4,760,000 (down + closing). Projections, not guarantees.
Landlord ↔ Tenant lean methodology
- Overall (STATE)
- 92 Strongly Landlord-Friendly
- State Arkansas
- 92 Strongly Landlord-Friendly · R+14
- County
- — inherits STATE
- City
- — inherits STATE
ZIP-level market 72120
- Rents YoY
- 4.8%
- Active inventory
- 243
- Price-to-rent
- 1011.9×
Monthly cashflow live
- Estimated rent
- $188,215 high interval (Pro) →
- Mortgage (P&I)
- −$89,150
- Tax est. 1.5%
- −$21,250 /mo · $255,000/yr
- Insurance
- −$7,083
- HOA
- −$0
- Vacancy / Maint / Mgmt
- −$39,525
- Net cashflow
- $31,207
Break-even live
131-unit breakdown (identical units grouped — click to expand)
| Units | Beds | Baths | Est. rent |
|---|---|---|---|
| 118× units | 2 | 1 | $165,200 |
| #1 | 2 | 1 | $1,400 |
| #2 | 2 | 1 | $1,400 |
| #3 | 2 | 1 | $1,400 |
| #4 | 2 | 1 | $1,400 |
| #5 | 2 | 1 | $1,400 |
| #6 | 2 | 1 | $1,400 |
| #7 | 2 | 1 | $1,400 |
| #8 | 2 | 1 | $1,400 |
| #9 | 2 | 1 | $1,400 |
| #10 | 2 | 1 | $1,400 |
| #11 | 2 | 1 | $1,400 |
| #12 | 2 | 1 | $1,400 |
| #13 | 2 | 1 | $1,400 |
| #14 | 2 | 1 | $1,400 |
| #15 | 2 | 1 | $1,400 |
| #16 | 2 | 1 | $1,400 |
| #17 | 2 | 1 | $1,400 |
| #18 | 2 | 1 | $1,400 |
| #19 | 2 | 1 | $1,400 |
| #20 | 2 | 1 | $1,400 |
| #21 | 2 | 1 | $1,400 |
| #22 | 2 | 1 | $1,400 |
| #23 | 2 | 1 | $1,400 |
| #24 | 2 | 1 | $1,400 |
| #25 | 2 | 1 | $1,400 |
| #26 | 2 | 1 | $1,400 |
| #27 | 2 | 1 | $1,400 |
| #28 | 2 | 1 | $1,400 |
| #29 | 2 | 1 | $1,400 |
| #30 | 2 | 1 | $1,400 |
| #31 | 2 | 1 | $1,400 |
| #32 | 2 | 1 | $1,400 |
| #33 | 2 | 1 | $1,400 |
| #34 | 2 | 1 | $1,400 |
| #35 | 2 | 1 | $1,400 |
| #36 | 2 | 1 | $1,400 |
| #37 | 2 | 1 | $1,400 |
| #38 | 2 | 1 | $1,400 |
| #39 | 2 | 1 | $1,400 |
| #40 | 2 | 1 | $1,400 |
| #41 | 2 | 1 | $1,400 |
| #42 | 2 | 1 | $1,400 |
| #43 | 2 | 1 | $1,400 |
| #44 | 2 | 1 | $1,400 |
| #45 | 2 | 1 | $1,400 |
| #46 | 2 | 1 | $1,400 |
| #47 | 2 | 1 | $1,400 |
| #48 | 2 | 1 | $1,400 |
| #49 | 2 | 1 | $1,400 |
| #50 | 2 | 1 | $1,400 |
| #51 | 2 | 1 | $1,400 |
| #52 | 2 | 1 | $1,400 |
| #53 | 2 | 1 | $1,400 |
| #54 | 2 | 1 | $1,400 |
| #55 | 2 | 1 | $1,400 |
| #56 | 2 | 1 | $1,400 |
| #57 | 2 | 1 | $1,400 |
| #58 | 2 | 1 | $1,400 |
| #59 | 2 | 1 | $1,400 |
| #60 | 2 | 1 | $1,400 |
| #61 | 2 | 1 | $1,400 |
| #62 | 2 | 1 | $1,400 |
| #63 | 2 | 1 | $1,400 |
| #64 | 2 | 1 | $1,400 |
| #65 | 2 | 1 | $1,400 |
| #66 | 2 | 1 | $1,400 |
| #67 | 2 | 1 | $1,400 |
| #68 | 2 | 1 | $1,400 |
| #69 | 2 | 1 | $1,400 |
| #70 | 2 | 1 | $1,400 |
| #71 | 2 | 1 | $1,400 |
| #72 | 2 | 1 | $1,400 |
| #73 | 2 | 1 | $1,400 |
| #74 | 2 | 1 | $1,400 |
| #75 | 2 | 1 | $1,400 |
| #76 | 2 | 1 | $1,400 |
| #77 | 2 | 1 | $1,400 |
| #78 | 2 | 1 | $1,400 |
| #79 | 2 | 1 | $1,400 |
| #80 | 2 | 1 | $1,400 |
| #81 | 2 | 1 | $1,400 |
| #82 | 2 | 1 | $1,400 |
| #83 | 2 | 1 | $1,400 |
| #84 | 2 | 1 | $1,400 |
| #85 | 2 | 1 | $1,400 |
| #86 | 2 | 1 | $1,400 |
| #87 | 2 | 1 | $1,400 |
| #88 | 2 | 1 | $1,400 |
| #89 | 2 | 1 | $1,400 |
| #90 | 2 | 1 | $1,400 |
| #91 | 2 | 1 | $1,400 |
| #92 | 2 | 1 | $1,400 |
| #93 | 2 | 1 | $1,400 |
| #94 | 2 | 1 | $1,400 |
| #95 | 2 | 1 | $1,400 |
| #96 | 2 | 1 | $1,400 |
| #97 | 2 | 1 | $1,400 |
| #98 | 2 | 1 | $1,400 |
| #99 | 2 | 1 | $1,400 |
| #100 | 2 | 1 | $1,400 |
| #101 | 2 | 1 | $1,400 |
| #102 | 2 | 1 | $1,400 |
| #104 | 2 | 1 | $1,400 |
| #105 | 2 | 1 | $1,400 |
| #106 | 2 | 1 | $1,400 |
| #107 | 2 | 1 | $1,400 |
| #108 | 2 | 1 | $1,400 |
| #109 | 2 | 1 | $1,400 |
| #110 | 2 | 1 | $1,400 |
| #111 | 2 | 1 | $1,400 |
| #112 | 2 | 1 | $1,400 |
| #113 | 2 | 1 | $1,400 |
| #114 | 2 | 1 | $1,400 |
| #115 | 2 | 1 | $1,400 |
| #116 | 2 | 1 | $1,400 |
| #117 | 2 | 1 | $1,400 |
| #118 | 2 | 1 | $1,400 |
| #119 | 2 | 1 | $1,400 |
| 1× unit | 1 | 1 | $1,114 |
| 4× units | 4 | 2 | $7,168 |
| #120 | 4 | 2 | $1,792 |
| #121 | 4 | 2 | $1,792 |
| #122 | 4 | 2 | $1,792 |
| #123 | 4 | 2 | $1,792 |
| 1× unit | 5 | 2 | $1,855 |
| 1× unit | 6 | 2 | $1,859 |
| 1× unit | 8 | 3 | $1,856 |
| 2× units | 10 | 3 | $3,682 |
| #127 | 10 | 3 | $1,841 |
| #128 | 10 | 3 | $1,841 |
| 1× unit | 12 | 3 | $1,827 |
| 1× unit | 17 | 4 | $1,826 |
| 1× unit | 20 | 4 | $1,826 |
| Total (131 units) | $188,215 | ||
UW: 25.0% down · 7.5% · 30yr · 1.5% tax · 5.0% vac · 8.0% maint · 8.0% mgmt
Financing live
Cash to close
- Down payment
- $4,250,000
- Closing costs
- $510,000
- Reserves months
- —
- Total cash needed
- —
Loan-product check · same deal, 3 products live
Conventional
25% down · 7.5% · 30yr
- Down + closing
- —
- Monthly P&I
- —
- Monthly cashflow
- —
- DSCR
- —
- Eligible?
- —
Personal DTI + credit; lowest rate.
DSCR
20% down · 8.5% · 30yr
- Down + closing
- —
- Monthly P&I
- —
- Monthly cashflow
- —
- DSCR
- —
- Eligible?
- —
No personal income docs; deal must DSCR.
Hard money
10% down · 12.0% · 12mo
- Down + closing
- —
- Monthly P&I
- —
- Monthly cashflow
- —
- DSCR
- —
- Eligible?
- —
Short-term bridge; refi at stabilization.
Listing history 22 events
-
2026-06-18days on market $17,000,000 Active 73 DOM
-
2026-06-17days on market $17,000,000 Active 72 DOM
-
2026-06-16days on market $17,000,000 Active 71 DOM
-
2026-06-15days on market $17,000,000 Active 70 DOM
-
2026-06-14days on market $17,000,000 Active 68 DOM
-
2026-06-13days on market $17,000,000 Active 67 DOM
-
2026-06-10days on market $17,000,000 Active 65 DOM
-
2026-06-09days on market $17,000,000 Active 64 DOM
-
2026-06-08days on market $17,000,000 Active 63 DOM
-
2026-06-07days on market $17,000,000 Active 62 DOM
-
2026-06-05days on market $17,000,000 Active 59 DOM
-
2026-06-03days on market $17,000,000 Active 58 DOM
-
2026-06-02days on market $17,000,000 Active 57 DOM
-
2026-06-01days on market $17,000,000 Active 56 DOM
-
2026-05-31days on market $17,000,000 Active 55 DOM
-
2026-05-31days on market $17,000,000 Active 54 DOM
-
2026-04-06$17,000,000 New Listing 1209-char remark
Show marketing remark (1209 chars)
Prime investment opportunity! This turnkey residential RE portfolio includes 163 units (65 properties) located across Sherwood, North Little Rock & Jacksonville, currently operating with a strong occupancy rate. The portfolio offers excellent cash flow potential and long-term value, with many properties already updated, reducing immediate capital improvement needs. The diverse mix of property types provides strong income stability and risk diversification, including 37 single-family homes, 1 condo, 16 duplexes, four four-plexes, one five-plex, one six-plex, one eight-plex, two ten-plexes, one twelve-plex, one seventeen-plex & one twenty-plex. Additionally, seven properties feature four-bedroom floor plans currently renting between $1,350 and $1,675 per month, adding to the income potential. This portfolio is ideal for investors looking to scale their real estate holdings with an established asset base already producing income. The current management company is available to continue overseeing operations, providing a seamless transition for the next owner. Opportunities to acquire a portfolio of this size with strong occupancy and established management are rare. See agent notes.
-
2026-03-18historical
-
2025-12-03historical Take Backups
-
2025-09-03$17,335,000 New Listing
-
2025-05-01historical
-
2025-01-31$18,525,000 New Listing
ⓘ Source: listings_history table (triggers on properties + properties_extension) + one-shot
backfill from property_details.listing_events for pre-trigger history.
Nearby sold comps map
Loading sold comps map…
Walkable amenities ~0.75 mi
Loading nearby amenities…
Taxation est. · year 1
- Rental income
- $2,258,580
- − Mortgage interest
- −$952,264
- − Property taxes
- −$255,000
- − Insurance
- −$85,000
- − Repairs & maintenance
- −$180,686
- − Management
- −$180,686
- − Depreciation
- −$494,545
- Taxable income
- $110,397
- Est. tax owed @ 24.0%
- −$26,495
- After-tax cash flow
- $347,985/yr
For passive investors: Depreciation is non-cash, so a rental often shows a tax loss while cash-flowing — sheltering income. Rental losses are passive: they offset passive income freely, and up to $25,000/yr can offset ordinary (W-2) income if you actively participate and your MAGI is under $100k (phasing out to $0 by $150k); unused losses carry forward. On sale, claimed depreciation is recaptured at up to 25%, and gains may owe capital-gains tax (a 1031 exchange can defer both). Figures are a year-1 estimate at your 24.0% rate — not tax advice; consult a CPA.
Condition & rehab AI · 12 photos
This multi-family property requires moderate repairs and maintenance to improve its condition and value. Paint and roof work, along with driveway and parking lot repairs, would significantly enhance its appeal and marketability.
Repairs flagged
- Major roof — Signs of aging
- Major exterior siding — Weathered appearance
- Major driveway and parking lot — Signs of wear
Value-add opportunities
- Both Paint exterior and roof — Enhances curb appeal and value
- Both Replace driveway and parking lot — Improves functionality and aesthetics
Renovation cost estimate screening
| Repair item | Severity | Est. cost |
|---|---|---|
| roof · Signs of aging | Major | $15,000–50,000 |
| exterior siding · Weathered appearance | Major | $15,000–50,000 |
| driveway and parking lot · Signs of wear | Major | $15,000–50,000 |
| Total estimated repair cost · 3 items | $45,000–150,000 |
Value-add ROI direction
- Both Paint exterior and roof — Enhances curb appeal and value ↑
- Both Replace driveway and parking lot — Improves functionality and aesthetics ↑
ⓘ Cost ranges are severity-bucket heuristics (US national rule-of-thumb). Get contractor quotes + a written scope before underwriting a rehab budget.
Schools (NCES district)
- District
- Pulaski County Spec. School District
- NCES district ID
- 0511850
- Math proficiency
- 27% ▼ -13.00%
- Reading proficiency
- 31% ▼ -10.00%
- Median HH income
- $53,218
- Composite
- 25.67/100
- National rank
- #7394
- State rank
- #150 of 238 in AR
Livability — Sherwood
- Score
- 73/100
- State rank
- #19
- US rank
- #5246
Category grades
Schools grade is shown separately in the Schools card above.
Census & demographics
- Census place
- Sherwood, AR
- County
- Pulaski County · 372,764 people
- City population
- 34,365
- Metro
- Little Rock-North Little Rock-Conway, AR
- Population (ZIP)
- 34,365
- Household income
- $76,598
- Rent vs Own
- Severe rent burden
- 774.0
Population outlook (Pulaski County) Hauer SSP2
- Today (2025)
- 415,378 people
- By 2030
- 423,720 · +2.0%
- By 2040
- 435,182 · +4.8%
- By 2050
- 440,904 · +6.1%
- By 2075
- 445,521 · +7.3%
- By 2100
- 419,173 · +0.9%
Race, ethnicity, and origin ACS 2023
- Neighborhood character
- Predominantly White (65%)
- Race & ethnicity
- White 65% Black 26% Two or more races 5% Hispanic / Latino 4% Asian 1%
- Common ancestry
- Lithuanian 2% Slovak 1% Italian 1%
- Foreign-born
- 2% · Canada, South Korea
- Languages at home
- 96% English-only · Spanish 2% Korean 1%
Political lean MEDSL · Pulaski
- 2024 margin
- Strong D (+22.1) · D 59.8% · R 37.7% · Other 2.5%
- 2008→2024 swing
- +10.6pp toward D · 2008: 11.6pp · 2024: 22.1pp
- All cycles
- 2024: D+22.1 2020: D+22.5 2016: D+17.9 2012: D+11.4 2008: D+11.6
Not yet ingested
- Civics
- —
Market trends
- HPI YoY
- ▼ -134.93%
- Current HPI
- 198.9456
- Rent YoY
- ▲ 4.81%
- Metro
- Little Rock-North Little Rock-Conway, AR
- State GDP YoY
- ▲ 3.80%
- F500 in state
- 10
Industry mix (Fortune 500 HQ in AR)
| Industry | F500 HQs | Revenue |
|---|---|---|
| Retail | 1 | $681B |
|
||
| Food / Agriculture | 1 | $53B |
|
||
| Retail / Energy | 1 | $22B |
|
||
| Transportation / Logistics | 1 | $12B |
|
||
| Energy | 1 | $4B |
|
||
Price history
-8.2% since first listed6 events — show timeline
- 2026-04-06 Listed $17,000,000 CARMLS
- 2026-03-18 Listing Removed — CARMLS
- 2025-12-03 Contingent — CARMLS
- 2025-09-03 Listed $17,335,000 CARMLS
- 2025-05-01 Listing Removed — CARMLS
- 2025-01-31 Listed $18,525,000 CARMLS
Cash-flow waterfall
monthlySold comps — $/sqft
last 12 mo · ≤1 miLoading sold comps…