502 Cove Dr · Newport, NC
Flood risk No data
- FEMA flood zone
- —
- Chance of flooding over 30 yrs
- —
- Est. flood insurance / yr
- —
Fire risk No data
- Est. fire insurance / yr
- —
Heat risk No data
- Hot days now (above threshold)
- —
- Hot days in 30 yrs
- —
Wind risk No data
- Chance of severe wind over 30 yrs
- —
Air-quality risk No data
- Unhealthy air days now
- —
- Unhealthy air days in 30 yrs
- —
Risk factors via First Street. Map © Google.
Why this score? — see what drove the D+ grade
The composite is a weighted blend of 9 inputs, each scored 0–100. Each bar is that input's sub-score; the figure is the points it added to the 100-point composite (weight × sub-score).
- Cash flow +15.0/30.0
- ARV discount +7.6/15.0
- Schools +5.1/10.0
- 1% rule +5.0/10.0
- DSCR +5.0/10.0
- Condition / age +4.8/5.0
- Livability +3.2/5.0
- Rent growth +2.5/5.0
- Appreciation +0.0/10.0
$260,000
🖨 Deal sheet 📄 Offer letter ✓ Due diligence
Listing remarks
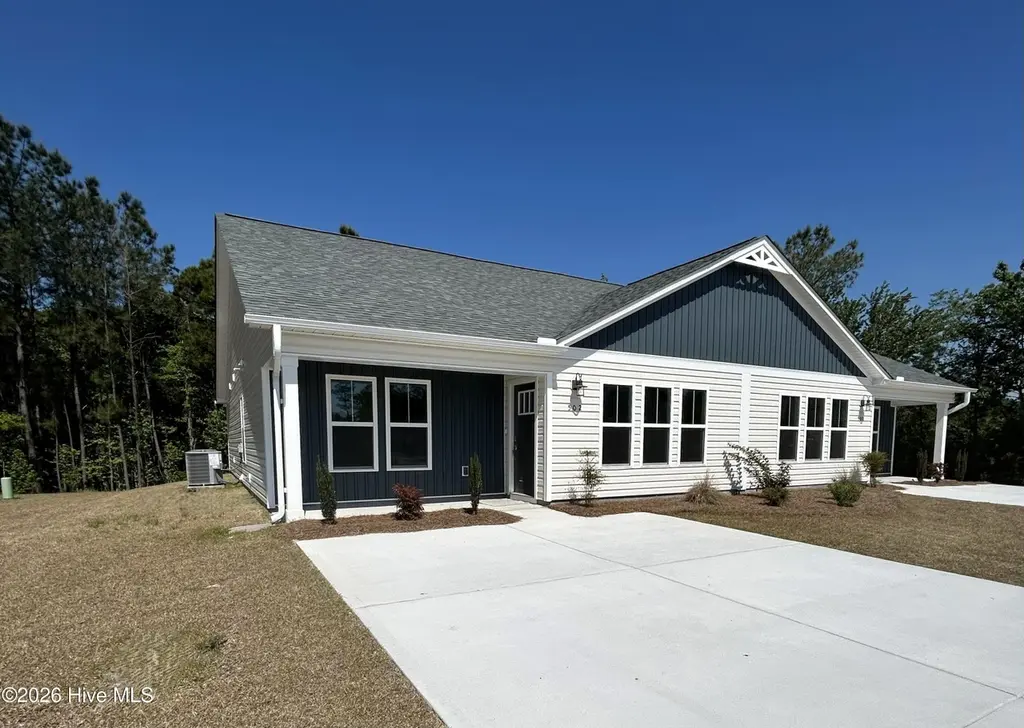
MOVE IN READY! Welcome to The Villas; your oasis of modern living in Newport! Nestled within a community of townhomes, this gem awaits on the left-hand side offering 3 bedrooms and 2 bathrooms. Designed for effortless living these townhomes give you the pleasure of settling into a brand-new construction with a low-maintenance yard. Upon entry, be greeted by an expansive open floor plan adorned with luxurious LVP flooring, complemented by vaulted ceilings that create an air of spaciousness and sophistication. Admire the natural light streaming through picture-framed windows, inviting the outdoors in and enhancing the ambiance of every room. Prepare to unleash your culinary skills in the chef
Key facts
- Open floor plan
- Low maintenance yard
- Natural light
Tags
Property features AI
Finance
- Other: Subdivision: The Villas at Newport; Zoning: R
- HOA & community: Homeowners association with annual fee of $3,600 (about $300/month); HOA covers grounds and structure maintenance; taxes noted
Exterior
- Parking: Attached garage; Concrete driveway / on-site parking
- Security: Smoke detector(s)
- Utilities: Public sewer connected; Public water connected; Electric service
- Home design: Townhouse; One level / single-story; Entry level: 1; New construction
- Construction: Vinyl siding with frame construction; Shingle roof; Slab foundation; Built as new construction
- Exterior features: Covered patio; Patio; Paved road access; Street lights in community; Has a view
Interior
- Kitchen: Electric oven; Electric cooktop; Microwave; Dishwasher; Disposal; Refrigerator
- Bedrooms: Master on main level
- Flooring: Carpet
- Bathrooms: 2 full bathrooms; Accessible full bath
- Heating & cooling: Heat pump heating; Electric heating; Central air conditioning
- Interior features: Master suite on main level; Vaulted ceilings; Ceiling fans; Pantry; Insulated windows; Smoke detectors; Accessible full bathroom; Ventilation for improved indoor air quality; Energy-efficient lighting and thermostat
- Laundry & utility: Washer hookup; Washer and dryer included; Laundry closet; Electric water heater
Neighborhood map
What this means for you Summary
Snapshot
- This is a 3-bed/2.0-bath townhouse listed at $260k. Condition is rated excellent.
Deal economics
- At list price, monthly cash flow is $8k ($94k/yr) — positive.
- The deal already cash-flows at list — no discount required.
- Meets the 1% rule at list price ($13k rent vs $260k).
- Recommended offer: $244k (6.0% below list) — sets the bar for market timing.
- Cap rate 42.6% vs local median 31.4% in Newport — top-decile yield for the area; either an underpriced asset or a hidden risk that comps aren't pricing in. Stress-test before assuming the spread holds.
Location & tenants
- Location reads 63/100 on livability (#385 in NC) — a middle-class / working-renter tenant base. Strengths: cost of living A+, housing A+; Watch: employment C-, amenities F, commute F.
- Carteret County Public Schools (rural): math 59% / reading 61% proficiency, ranked #31 of 178 in NC (top 17%) — acceptable for families but not a draw, mixed tenant base, ~2y average lease.
- Zoned schools: Newport Elementary (math 48% / reading 45%, grade D-, #542 of 1,410 statewide, top 39%, 645 students, 100% FRL); Newport Middle (math 39% / reading 56%, grade C-, #140 of 475 statewide, top 30%, 378 students, 98% FRL); West Carteret High (math 82% / reading 71%, grade A-, #89 of 535 statewide, top 16%, 1,146 students, 40% FRL) — zoned schools average 79% FRL vs 39% district-wide (40 pts higher); higher-poverty schools than district average — tighter screening recommended.
- Market conditions: 216 active listings in the ZIP; 935 units permitted in Carteret County in 2024 (360 in 5+ unit buildings).
- At $12,622/mo this rent would consume 216% of the median local household income ($70k/yr) (locally 461% of renters already pay >50% of income on rent) — very limited rent-growth headroom before tenants either downsize or default.
Forward outlook
- Local home prices are declining (-3.0%/yr); year-one equity from $2k of loan paydown is wiped out by about $8k of value loss. Plan a longer hold.
- Carteret County population projected at +9% by 2050 — modest demand growth; plan on rents tracking national, not racing it.
- At projected returns (-3.0% appreciation + 3.0% rent growth), your $73k cash investment doubles in ~1 year — after that, you're playing with house money.
Negotiation context
- It's been on market 79 days — a 6% lower offer ($244k) is reasonable based on typical stale-listing flexibility.
Questions for the listing agent
- It's been on market 79 days. Have you received any prior offers? Is the seller open to a 6% concession, seller financing, or rate buy-down credit?
- What does the HOA fee cover, when was the last increase, and are there any pending special assessments or reserve-fund shortfalls?
- Why hasn't it sold? Are there any deal-killer items the seller is aware of (foundation, flood, title, zoning, code violations)?
- Is there a deadline driving the sale (1031 exchange, divorce, estate, relocation)? That informs how much negotiation room exists.
- The area grade is low — what's the realistic commute time and amenity access for the typical tenant pool here? Any planned neighborhood developments (good or bad) we should know about?
- What's the average days-on-market for RENTAL listings here right now (not sales)? A rising rental-DOM trend means longer vacancies and softer asking-rent achievability than the comps imply.
- What's the recent tenant-quality profile in this submarket — average credit score on applications, eviction rate, late-payment / NSF rate, and stable-employment percentage? A property-management company in the area should have these aggregated.
- How much new for-sale + rental construction is in the pipeline within 1–3 miles? Heavy new supply typically softens prices + rents 12–24 months out; constrained supply supports both.
Investment metrics
- 1% rule
- 4.85% ✓
- Cap rate
- 42.64%
- Cash-on-cash
- 129.80%
- DSCR
- 6.78
- GRM
- 1.7
CMA / ARV
- ARV (on-the-fly)
- $260,496
- Comps found
- 12
Show comp detail 12 sales within ~0.75 mi
| Address | Dist | Beds/Ba | Sqft | Sold | Price | $/sf | Match |
|---|---|---|---|---|---|---|---|
| 500 Cove Dr | 0.01mi | 3/2.0 | 1,296 (0%) | 1mo | $260,000 | $201 | 98 |
| 802 Discovery Cv | 0.05mi | 3/2.0 | 1,296 (0%) | 3mo | $254,000 | $196 | 95 |
| 804 Discovery Cv | 0.05mi | 3/2.0 | 1,296 (0%) | 5mo | $260,000 | $201 | 94 |
| 800 Discovery Cv | 0.03mi | 3/2.0 | 1,296 (0%) | 6mo | $254,000 | $196 | 93 |
| 808 Discovery Cv | 0.05mi | 3/2.0 | 1,296 (0%) | 6mo | $260,000 | $201 | 93 |
| 810 Discovery Cv | 0.05mi | 3/2.0 | 1,296 (0%) | 6mo | $261,260 | $202 | 93 |
| 300 Sweetwater Cv | 0.09mi | 3/2.0 | 1,342 (+4%) | 1mo | $289,000 | $215 | 89 |
| 400 Jade Cv | 0.05mi | 3/2.0 | 1,346 (+4%) | 2mo | $270,000 | $201 | 89 |
| 110 Treasure Cv | 0.15mi | 3/2.0 | 1,344 (+4%) | 4mo | $265,000 | $197 | 84 |
| 203 Diamond Cv | 0.20mi | 2/2.0 (-1) | 1,272 (-2%) | 3mo | $282,500 | $222 | 81 |
| 100 Treasure Cv | 0.18mi | 2/2.0 (-1) | 1,272 (-2%) | 7mo | $275,000 | $216 | 78 |
| 201 Diamond Cv | 0.19mi | 3/2.0 | 1,374 (+6%) | 6mo | $277,500 | $202 | 76 |
Match score weights: distance 35% · size 25% · config 20% · recency 20%. Top-matched comps best support the ARV.
Projected returns pro-forma
-3.0% appreciation · 3.0% rent growth · sell at horizon
- IRR
- —
- Equity multiple
- 7.32×
- Total profit
- $459,789
- Equity at exit
- $38,767
- IRR
- —
- Equity multiple
- 15.39×
- Total profit
- $1,047,718
- Equity at exit
- $22,480
Cash invested: $72,800 (down + closing). Projections, not guarantees.
Landlord ↔ Tenant lean methodology
- Overall (STATE)
- 85 Strongly Landlord-Friendly
- State North Carolina
- 85 Strongly Landlord-Friendly · R+3
- County
- — inherits STATE
- City
- — inherits STATE
ZIP-level market 28570
- Home prices YoY
- -16.2%
- Active inventory
- 216
- Price-to-rent
- 1.7×
Monthly cashflow live
- Estimated rent
- $12,622 medium interval (Pro) →
- Mortgage (P&I)
- −$1,363
- Tax est. 1.5%
- −$325 /mo · $3,900/yr
- Insurance
- −$108
- HOA
- −$300
- Vacancy / Maint / Mgmt
- −$2,651
- Net cashflow
- $7,875
Break-even live
UW: 25.0% down · 7.5% · 30yr · 1.5% tax · 5.0% vac · 8.0% maint · 8.0% mgmt
Financing live
Cash to close
- Down payment
- $65,000
- Closing costs
- $7,800
- Reserves months
- —
- Total cash needed
- —
Loan-product check · same deal, 3 products live
Conventional
25% down · 7.5% · 30yr
- Down + closing
- —
- Monthly P&I
- —
- Monthly cashflow
- —
- DSCR
- —
- Eligible?
- —
Personal DTI + credit; lowest rate.
DSCR
20% down · 8.5% · 30yr
- Down + closing
- —
- Monthly P&I
- —
- Monthly cashflow
- —
- DSCR
- —
- Eligible?
- —
No personal income docs; deal must DSCR.
Hard money
10% down · 12.0% · 12mo
- Down + closing
- —
- Monthly P&I
- —
- Monthly cashflow
- —
- DSCR
- —
- Eligible?
- —
Short-term bridge; refi at stabilization.
HOA detail
- Monthly dues
- $300 · $3,600/yr
Listing history 17 events
-
2026-06-19days on market $260,000 Active 79 DOM
-
2026-06-18days on market $260,000 Active 78 DOM
-
2026-06-17days on market $260,000 Active 77 DOM
-
2026-06-16days on market $260,000 Active 76 DOM
-
2026-06-15days on market $260,000 Active 75 DOM
-
2026-06-14days on market $260,000 Active 73 DOM
-
2026-06-12days on market $260,000 Active 72 DOM
-
2026-06-09days on market $260,000 Active 69 DOM
-
2026-06-08days on market $260,000 Active 68 DOM
-
2026-06-07days on market $260,000 Active 67 DOM
-
2026-06-05days on market $260,000 Active 64 DOM
-
2026-06-03days on market $260,000 Active 63 DOM
-
2026-06-02days on market $260,000 Active 62 DOM
-
2026-06-01days on market $260,000 Active 61 DOM
-
2026-05-31days on market $260,000 Active 60 DOM
-
2026-05-30days on market $260,000 Active 59 DOM
-
2026-04-01$260,000 Active
ⓘ Source: listings_history table (triggers on properties + properties_extension) + one-shot
backfill from property_details.listing_events for pre-trigger history.
Nearby sold comps map
Loading sold comps map…
Walkable amenities ~0.75 mi
Loading nearby amenities…
Taxation est. · year 1
- Rental income
- $151,466
- − Mortgage interest
- −$14,564
- − Property taxes
- −$3,900
- − Insurance
- −$1,300
- − Repairs & maintenance
- −$12,117
- − Management
- −$12,117
- − HOA
- −$3,600
- − Depreciation
- −$7,564
- Taxable income
- $96,304
- Est. tax owed @ 24.0%
- −$23,113
- After-tax cash flow
- $71,384/yr
For passive investors: Depreciation is non-cash, so a rental often shows a tax loss while cash-flowing — sheltering income. Rental losses are passive: they offset passive income freely, and up to $25,000/yr can offset ordinary (W-2) income if you actively participate and your MAGI is under $100k (phasing out to $0 by $150k); unused losses carry forward. On sale, claimed depreciation is recaptured at up to 25%, and gains may owe capital-gains tax (a 1031 exchange can defer both). Figures are a year-1 estimate at your 24.0% rate — not tax advice; consult a CPA.
Condition & rehab AI · 13 photos
This move-in-ready townhouse is in excellent condition with modern finishes and minimal maintenance required. Enhancing the landscaping and painting the exterior can further increase its value.
Value-add opportunities
- Both Landscaping — Enhancing the landscaping can improve both the resale and rental value by making the property more attractive.
- Both Painting exterior — Fresh paint can improve the curb appeal and make the property more attractive to potential buyers or renters.
Renovation cost estimate screening
Value-add ROI direction
- Both Landscaping — Enhancing the landscaping can improve both the resale and rental value by making the property more attractive. ↑
- Both Painting exterior — Fresh paint can improve the curb appeal and make the property more attractive to potential buyers or renters. ↑
ⓘ Cost ranges are severity-bucket heuristics (US national rule-of-thumb). Get contractor quotes + a written scope before underwriting a rehab budget.
Schools (NCES district)
- District
- Carteret County Public Schools
- NCES district ID
- 3700630
- Math proficiency
- 59% ▲ 5.00%
- Reading proficiency
- 61% ▲ 2.00%
- Median HH income
- $48,330
- Composite
- 50.92/100
- National rank
- #1786
- State rank
- #31 of 178 in NC
Livability — Newport
- Score
- 63/100
- State rank
- #385
- US rank
- #15094
Category grades
Schools grade is shown separately in the Schools card above.
Census & demographics
- Census place
- Newport, NC
- County
- Carteret County · 52,389 people
- City population
- 22,197
- Metro
- Morehead City, NC
- Population (ZIP)
- 22,197
- Household income
- $70,229
- Rent vs Own
- Severe rent burden
- 461.0
Population outlook (Carteret County) Hauer SSP2
- Today (2025)
- 73,443 people
- By 2030
- 75,344 · +2.6%
- By 2040
- 78,142 · +6.4%
- By 2050
- 80,091 · +9.1%
- By 2075
- 86,120 · +17.3%
- By 2100
- 89,408 · +21.7%
Race, ethnicity, and origin ACS 2023
- Neighborhood character
- Predominantly White (82%)
- Race & ethnicity
- White 82% Hispanic / Latino 7% Two or more races 6% Black 3% Asian 1%
- Hispanic origin (detail)
- Mexican 4%
- Common ancestry
- Slovak 3% Romanian 3% Lithuanian 2%
- Foreign-born
- 5% · Canada, Dominican Republic
- Languages at home
- 92% English-only · Spanish 6% German/W. Germanic 1%
Political lean MEDSL · Carteret
- 2024 margin
- Solid R (+43.1) · D 28.0% · R 71.1%
- 2008→2024 swing
- -8.4pp toward R · 2008: -34.7pp · 2024: -43.1pp
- All cycles
- 2024: R+43.1 2020: R+42.0 2016: R+44.5 2012: R+41.0 2008: R+34.7
Not yet ingested
- Civics
- —
Market trends
- HPI YoY
- ▼ -53.54%
- Current HPI
- 276.6589
- Rent YoY
- —
- Metro
- Morehead City, NC
- State GDP YoY
- ▲ 3.28%
- F500 in state
- 26
Industry mix (Fortune 500 HQ in NC)
| Industry | F500 HQs | Revenue |
|---|---|---|
| Financial Services | 2 | $213B |
|
||
| Retail | 2 | $95B |
|
||
| Industrial Conglomerate | 1 | $38B |
|
||
| Metals / Steel | 1 | $35B |
|
||
| Utilities | 1 | $30B |
|
||
| Industrial Machinery | 1 | $19B |
|
||
Price history
1 event — show timeline
- 2026-04-01 Listed $260,000 Hive MLS
Cash-flow waterfall
monthlySold comps — $/sqft
last 12 mo · ≤1 miLoading sold comps…