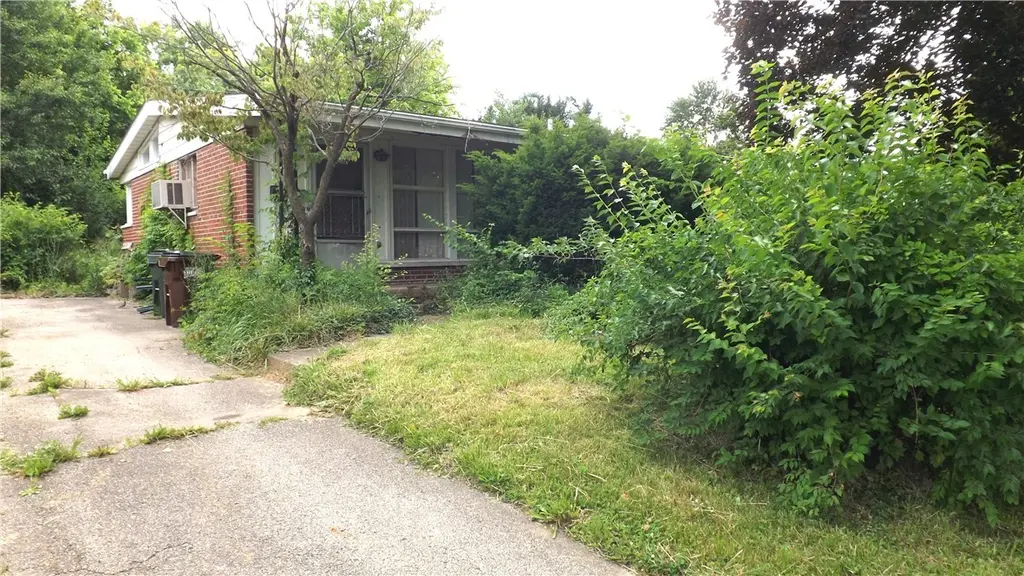
2558 La Plata Dr · Kettering, OH
Flood risk 1/10 · Minimal
- FEMA flood zone
- X (unshaded)
- Chance of flooding over 30 yrs
- 0.0%
- Est. flood insurance / yr
- $473 – $860
Fire risk 1/10 · Minimal
- Est. fire insurance / yr
- $713 – $1,323
Heat risk 3/10 · Minor
- Hot days now (above 100°F)
- 7 days/yr
- Hot days in 30 yrs
- 18 days/yr
Wind risk 2/10 · Minimal
- Chance of severe wind over 30 yrs
- 0.0%
Air-quality risk 3/10 · Minor
- Unhealthy air days now
- 2 days/yr
- Unhealthy air days in 30 yrs
- 3 days/yr
Risk factors via First Street. Map © Google.
Why this score? — see what drove the B grade
The composite is a weighted blend of 9 inputs, each scored 0–100. Each bar is that input's sub-score; the figure is the points it added to the 100-point composite (weight × sub-score).
- Cash flow +30.0/30.0
- 1% rule +10.0/10.0
- DSCR +10.0/10.0
- ARV discount +7.5/15.0
- Schools +5.2/10.0
- Livability +4.2/5.0
- Rent growth +3.7/5.0
- Condition / age +2.5/5.0
- Appreciation +0.0/10.0
$84,900
🖨 Deal sheet 📄 Offer letter ✓ Due diligence
Listing remarks
Investors take a look at this Rosewood Gardens ranch in Kettering. This property must be trashed out and completely renovated. Major neglect of all systems. The furnace and water heater are shot. Unable to check any operations as all utilities are off at the premises. Purchaser will have to turn utilities on to check operation of systems.
Key facts
- 8,250 sq ft lot
- Built 1957
Property features AI
Finance
- Financial info: Offered for sale
Exterior
- Parking: No garage
- Utilities: Natural gas available; Public water; Sewer available (storm sewer); Cable available
- Home design: Single-story home
- Construction: Brick, frame, and vinyl siding construction
- Exterior features: Patio; Lot approximately 60 x 125 (0.189 acres); Residential zoning
Interior
- Kitchen: Gas water heater (appliance listed)
- Bedrooms: Three bedrooms on the main level (approx. 10 x 12, 9 x 12, 9 x 12)
- Bathrooms: One full bathroom; One half bathroom; Two bathrooms on the main level
- Heating & cooling: Natural gas heat; Window air conditioning units
- Interior features: Aluminum window frames; Vaulted ceilings; Full unfinished basement
- Laundry & utility: Basement utility space
Neighborhood map
What this means for you Summary
Snapshot
- This is a 3-bed/1.5-bath single-family listed at $85k.
Deal economics
- At list price, monthly cash flow is $585 ($7k/yr) — positive.
- The deal already cash-flows at list — no discount required.
- Meets the 1% rule at list price ($2k rent vs $85k).
- Cap rate 14.6% vs local median 4.4% in Kettering — top-decile yield for the area; either an underpriced asset or a hidden risk that comps aren't pricing in. Stress-test before assuming the spread holds.
Location & tenants
- Location reads 83/100 on livability (#61 in OH, #922 nationally) — a professional / high-income tenant draw. Strengths: schools A+, crime A+, cost of living A+; Watch: commute F.
- Kettering City School District (suburban): math 54% / reading 68% proficiency, ranked #277 of 656 in OH (top 42%) — acceptable for families but not a draw, mixed tenant base, ~2y average lease.
- Market conditions: Rents rising fast (+4.8%/yr); 106 active listings in the ZIP; 12 comparable units currently listed for rent nearby; rentals at typical pace (median 14d on market — plan ~3-4 weeks tenant-placement turnaround); 907 units permitted in Montgomery County in 2024 (416 in 5+ unit buildings).
- This rent runs 32% of the median local income ($61k/yr) — at the standard rent-burdened threshold; future hikes will face affordability resistance.
Forward outlook
- Local home prices are declining (-3.0%/yr); year-one equity from $587 of loan paydown is wiped out by about $3k of value loss. Plan a longer hold.
- Montgomery County population projected at -10% by 2050 — secular population decline; favor cash flow + early exit over multi-decade hold.
- At projected returns (-3.0% appreciation + 4.8% rent growth), your $24k cash investment doubles in ~4 years — after that, you're playing with house money.
Negotiation context
- Only 1 days on market — expect competitive offers; lowballing is unlikely to land.
- Current owner paid $67k; 27% above their basis — modest negotiation headroom, anchor on the comps not their cost.
Risks & watch-outs
- Watch-outs: property tax is 2.9% of price; built in 1957 — expect roof / HVAC / electrical / plumbing capex.
Questions for the listing agent
- Built in 1957 — when were the roof, HVAC, electrical panel, plumbing, and water heater last replaced?
- Property tax is high relative to price — has the assessment been appealed recently, and will the sale trigger a re-assessment?
- Is there a deadline driving the sale (1031 exchange, divorce, estate, relocation)? That informs how much negotiation room exists.
- Schools are A-rated — typically a magnet for longer-tenancy family renters. What's the average tenant stay here, and is there a school-zone premium baked into asking?
- What's the average days-on-market for RENTAL listings here right now (not sales)? A rising rental-DOM trend means longer vacancies and softer asking-rent achievability than the comps imply.
- What's the recent tenant-quality profile in this submarket — average credit score on applications, eviction rate, late-payment / NSF rate, and stable-employment percentage? A property-management company in the area should have these aggregated.
- How much new for-sale + rental construction is in the pipeline within 1–3 miles? Heavy new supply typically softens prices + rents 12–24 months out; constrained supply supports both.
Investment metrics
- 1% rule
- 1.89% ✓
- Cap rate
- 14.57%
- Cash-on-cash
- 29.55%
- DSCR
- 2.31
- GRM
- 4.4
CMA / ARV
- ARV (on-the-fly)
- $201,096
- Comps found
- 12
Show comp detail 12 sales within ~0.75 mi
| Address | Dist | Beds/Ba | Sqft | Sold | Price | $/sf | Match |
|---|---|---|---|---|---|---|---|
| 3009 La Plata Dr | 0.10mi | 3/1.5 | 1,064 (0%) | 2mo | $235,000 | $221 | 93 |
| 2971 Peony Pl | 0.19mi | 3/2.0 | 1,056 (-1%) | 3mo | $199,900 | $189 | 86 |
| 2816 Blackhawk Rd | 0.39mi | 3/1.0 | 1,050 (-1%) | 0mo | $215,000 | $205 | 78 |
| 3336 Braddock | 0.35mi | 2/2.0 (-1) | 1,064 (0%) | 1mo | $230,000 | $216 | 76 |
| 2916 Blackhawk Rd | 0.44mi | 3/1.0 | 1,050 (-1%) | 0mo | $160,000 | $152 | 75 |
| 3428 Pobst Dr | 0.43mi | 3/1.5 | 1,092 (+3%) | 1mo | $252,500 | $231 | 75 |
| 2804 Blackhawk Rd | 0.39mi | 3/1.0 | 1,050 (-1%) | 4mo | $155,000 | $148 | 74 |
| 2808 Whitehorse Ave | 0.49mi | 3/1.0 | 1,050 (-1%) | 4mo | $199,000 | $190 | 70 |
| 3438 Blocker Dr | 0.42mi | 3/1.5 | 1,108 (+4%) | 4mo | $170,000 | $153 | 70 |
| 2855 Whitehorse Ave | 0.54mi | 3/1.0 | 1,050 (-1%) | 5mo | $182,000 | $173 | 67 |
| 3320 Valleywood Dr | 0.67mi | 3/2.0 | 1,160 (+9%) | 3mo | $210,000 | $181 | 49 |
| 3420 Annabelle Dr | 0.75mi | 3/1.0 | 960 (-10%) | 5mo | $175,000 | $182 | 42 |
Match score weights: distance 35% · size 25% · config 20% · recency 20%. Top-matched comps best support the ARV.
Projected returns pro-forma
-3.0% appreciation · 4.82% rent growth · sell at horizon
- IRR
- 26.3%
- Equity multiple
- 2.12×
- Total profit
- $26,613
- Equity at exit
- $12,659
- IRR
- 35.2%
- Equity multiple
- 4.55×
- Total profit
- $84,304
- Equity at exit
- $7,341
Cash invested: $23,772 (down + closing). Projections, not guarantees.
Landlord ↔ Tenant lean methodology
- Overall (STATE)
- 73 Landlord-Friendly
- State Ohio
- 73 Landlord-Friendly · R+6
- County
- — inherits STATE
- City
- — inherits STATE
ZIP-level market 45420
- Rents YoY
- 4.8%
- Active inventory
- 106
- Price-to-rent
- 4.4×
Monthly cashflow live
- Estimated rent
- $1,608 high interval (Pro) →
- Mortgage (P&I)
- −$445
- Tax from tax record
- −$205 /mo · $2,456/yr
- Insurance
- −$35
- HOA
- −$0
- Vacancy / Maint / Mgmt
- −$338
- Net cashflow
- $585
Break-even live
UW: 25.0% down · 7.5% · 30yr · 1.5% tax · 5.0% vac · 8.0% maint · 8.0% mgmt
Financing live
Cash to close
- Down payment
- $21,225
- Closing costs
- $2,547
- Reserves months
- —
- Total cash needed
- —
Loan-product check · same deal, 3 products live
Conventional
25% down · 7.5% · 30yr
- Down + closing
- —
- Monthly P&I
- —
- Monthly cashflow
- —
- DSCR
- —
- Eligible?
- —
Personal DTI + credit; lowest rate.
DSCR
20% down · 8.5% · 30yr
- Down + closing
- —
- Monthly P&I
- —
- Monthly cashflow
- —
- DSCR
- —
- Eligible?
- —
No personal income docs; deal must DSCR.
Hard money
10% down · 12.0% · 12mo
- Down + closing
- —
- Monthly P&I
- —
- Monthly cashflow
- —
- DSCR
- —
- Eligible?
- —
Short-term bridge; refi at stabilization.
Rent comps 12 comps
| Address | Beds | Baths | Sqft | Rent | $/sqft | DOM | Units | Dist |
|---|---|---|---|---|---|---|---|---|
| 2974 Woodman Dr Dayton, OH | 3.0 | 1.0 | 864 | $1,625 | $1.88 | 14d | 1 | 0.34mi |
| 3040 E Dorothy Ln Unit 23 Dayton, OH | 3.0 | 2.0 | 1300 | $1,500 | $1.15 | 43d | 1 | 0.51mi |
| 3101 Bromley Pl #23 Dayton, OH | 3.0 | 2.0 | 1300 | $1,500 | $1.15 | 2d | 1 | 0.55mi |
| 3101 Bromley Pl #21 Dayton, OH | 3.0 | 2.0 | 1350 | $1,600 | $1.19 | 43d | 1 | 0.55mi |
| 3049 E Stroop Rd Dayton, OH | 3.0 | 2.0 | 1440 | $2,300 | $1.60 | 2d | 1 | 0.87mi |
| 3970 Parliament Pl Dayton, OH | 1.0–2.0 | 1.0 | 774 | $1,040 | $1.34 | 2d | 3 | 0.98mi |
| 340 Clover Ln Beavercreek, OH | 1.0–3.0 | 1.0–2.0 | 1063 | $2,075 | $1.95 | 2d | 19 | 1.25mi |
| 4427 Wilmington Pike Dayton, OH | 1.0–3.0 | 1.0–1.5 | 870 | $1,395 | $1.60 | 2d | 17 | 1.35mi |
| 1934 Farmside Dr Dayton, OH | 3.0 | 1.0 | 1008 | $1,395 | $1.38 | 43d | 1 | 1.39mi |
| 4516 Drayton Ct Dayton, OH | 3.0 | 2.0 | 1442 | $2,550 | $1.77 | 11d | 1 | 1.44mi |
| 1532 Lynnfield Dr Unit 1530 Kettering, OH | 2.0 | 1.0 | 1000 | $1,450 | $1.45 | 23d | 1 | 1.49mi |
| 2212 Farmside Dr Dayton, OH | 3.0 | 1.0 | 1008 | $1,395 | $1.38 | 43d | 1 | 1.49mi |
Listing history 2 events
-
2026-06-02remarks 340-char remark
-
2026-06-02$84,900 Pending 1 DOM
ⓘ Source: listings_history table (triggers on properties + properties_extension) + one-shot
backfill from property_details.listing_events for pre-trigger history.
Tax reassessment forecast OH · Partial reset (capped growth)
- Current annual tax
- $2,456 · $205/mo
- Projected year-2 tax
- $2,456 · $205/mo
- Expected delta
- $0/yr ($0/mo · 0.0%)
ⓘ Screening estimate from a state-policy table — verify with the county assessor before closing.
Climate risk First Street
- Flood 1/10 Low FEMA zone X (unshaded) · 0% chance over 30 yrs
- Wildfire 1/10 Low
- Heat 3/10 Moderate 7 d/yr ≥100°F today · 18 d/yr by 30 yrs out
- Wind 2/10 Low 0% chance of damaging wind over 30 yrs
- Air quality 3/10 Moderate 2 unhealthy d/yr today · 3 by 30 yrs out
Nearby sold comps map
Loading sold comps map…
Walkable amenities ~0.75 mi
Loading nearby amenities…
Taxation est. · year 1
- Rental income
- $19,302
- − Mortgage interest
- −$4,756
- − Property taxes
- −$2,456
- − Insurance
- −$424
- − Repairs & maintenance
- −$1,544
- − Management
- −$1,544
- − Depreciation
- −$2,470
- Taxable income
- $6,108
- Est. tax owed @ 24.0%
- −$1,466
- After-tax cash flow
- $5,560/yr
For passive investors: Depreciation is non-cash, so a rental often shows a tax loss while cash-flowing — sheltering income. Rental losses are passive: they offset passive income freely, and up to $25,000/yr can offset ordinary (W-2) income if you actively participate and your MAGI is under $100k (phasing out to $0 by $150k); unused losses carry forward. On sale, claimed depreciation is recaptured at up to 25%, and gains may owe capital-gains tax (a 1031 exchange can defer both). Figures are a year-1 estimate at your 24.0% rate — not tax advice; consult a CPA.
Schools (NCES district)
- District
- Kettering City School District
- NCES district ID
- 3904418
- Math proficiency
- 54% ▼ -21.00%
- Reading proficiency
- 68% ▼ -9.00%
- Median HH income
- $50,353
- Composite
- 51.89/100
- National rank
- #1653
- State rank
- #277 of 656 in OH
Livability — Kettering
- Score
- 83/100
- State rank
- #61
- US rank
- #922
Category grades
Schools grade is shown separately in the Schools card above.
Census & demographics
- Census place
- Kettering, OH
- County
- Montgomery County · 459,541 people
- City population
- 73,116
- Metro
- Dayton-Kettering, OH
- Population (ZIP)
- 24,411
- Household income
- $60,588
- Rent vs Own
- Severe rent burden
- 856.0
Population outlook (Montgomery County) Hauer SSP2
- Today (2025)
- 523,241 people
- By 2030
- 514,948 · -1.6%
- By 2040
- 493,378 · -5.7%
- By 2050
- 469,639 · -10.2%
- By 2075
- 418,360 · -20.0%
- By 2100
- 353,315 · -32.5%
Race, ethnicity, and origin ACS 2023
- Neighborhood character
- Predominantly White (83%)
- Race & ethnicity
- White 83% Black 7% Two or more races 6% Hispanic / Latino 3% Asian 3%
- Common ancestry
- Lithuanian 3% Slovak 2% Italian 2%
- Foreign-born
- 7% · Canada, China
- Languages at home
- 93% English-only · Other Indo-European 2% Spanish 2% Chinese 0%
Political lean MEDSL · Montgomery
- 2024 margin
- Toss-up / Even · D 49.8% · R 49.3%
- 2008→2024 swing
- -5.8pp toward R · 2008: 6.2pp · 2024: 0.5pp
- All cycles
- 2024: D+0.5 2020: D+2.2 2016: R+1.2 2012: D+3.1 2008: D+6.2
Not yet ingested
- Civics
- —
Market trends
- HPI YoY
- ▼ -192.56%
- Current HPI
- 241.6543
- Rent YoY
- ▲ 4.82%
- Metro
- Dayton-Kettering, OH
- State GDP YoY
- ▲ 1.98%
- F500 in state
- 48
Industry mix (Fortune 500 HQ in OH)
| Industry | F500 HQs | Revenue |
|---|---|---|
| Insurance | 3 | $145B |
|
||
| Industrial Machinery | 3 | $49B |
|
||
| Financial Services | 3 | $24B |
|
||
| Consumer Goods | 2 | $93B |
|
||
| Aerospace / Defense | 2 | $47B |
|
||
| Utilities | 2 | $33B |
|
||
Price history
+121.1% since first listed5 events — show timeline
- 2026-06-01 Pending — Dayton MLS
- 2026-06-01 Listed $84,900 Dayton MLS
- 1990-12-27 Sold (Public Records) $67,000 Public Records
- 1978-06-05 Sold (Public Records) $38,400 Public Records
- 1978-06-01 Sold (Public Records) $38,400 Public Records
Property tax history
+0.5%/yrLatest (2025): $2,456 · -1.1% YoY. Source: county tax records.
Cash-flow waterfall
monthlySold comps — $/sqft
last 12 mo · ≤1 miLoading sold comps…