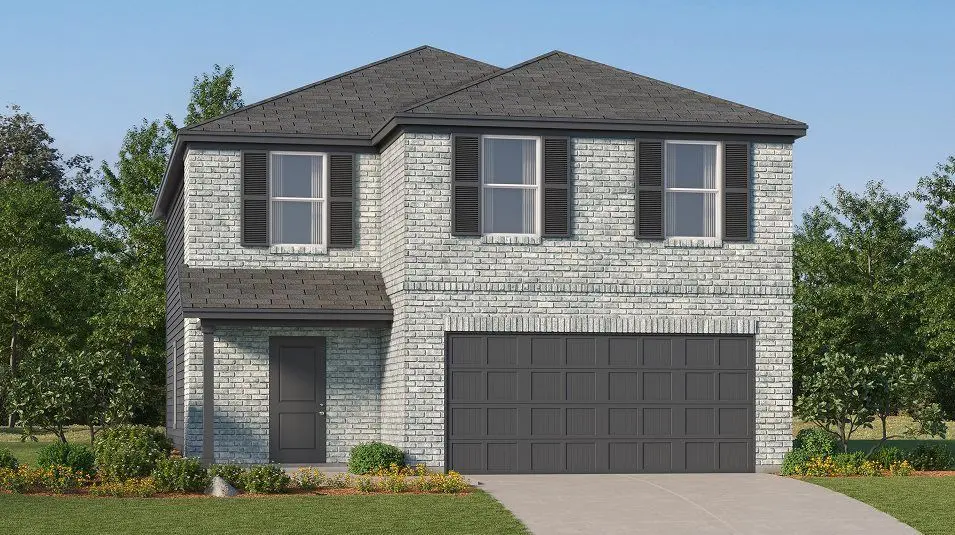
14323 Brooke Path · San Antonio, TX
Flood risk No data
- FEMA flood zone
- —
- Chance of flooding over 30 yrs
- —
- Est. flood insurance / yr
- —
Fire risk No data
- Est. fire insurance / yr
- —
Heat risk No data
- Hot days now (above threshold)
- —
- Hot days in 30 yrs
- —
Wind risk No data
- Chance of severe wind over 30 yrs
- —
Air-quality risk No data
- Unhealthy air days now
- —
- Unhealthy air days in 30 yrs
- —
Risk factors via First Street. Map © Google.
Why this score? — see what drove the D+ grade
The composite is a weighted blend of 9 inputs, each scored 0–100. Each bar is that input's sub-score; the figure is the points it added to the 100-point composite (weight × sub-score).
- ARV discount +15.0/15.0
- Cash flow +10.8/30.0
- Appreciation +6.0/10.0
- Condition / age +4.8/5.0
- Livability +4.0/5.0
- 1% rule +3.2/10.0
- DSCR +3.1/10.0
- Schools +1.8/10.0
- Rent growth +0.7/5.0
$227,999
🖨 Deal sheet (PDF) 📄 Offer letter ✓ Due diligence
Listing remarks
This new two-story home is host to an open-concept floorplan on the first level combining the kitchen, dining area and family room for effortless entertaining and multitasking. A versatile game room is located upstairs near four bedrooms, including the luxe owner's suite with a spa-inspired bathroom and generous walk-in closet.
Key facts
- Luxe owner's suite
- Game room
- 2 garage spots
Tags
Property features AI
Finance
- Financial info: List price $227,999
Exterior
- Parking: 2 total parking spaces; 2-car garage
- Home design: Single-family home; Barlow plan
- Exterior features: Living area approximately 2,173
Interior
- Bedrooms: 4 bedrooms
- Bathrooms: 2 bathrooms
- Interior features: Spec home (new construction, Barlow plan)
Neighborhood map
What this means for you Summary
Snapshot
- This is a 4-bed/2.0-bath single-family listed at $228k. Condition is rated excellent.
Deal economics
- At list price, monthly cash flow is $-103 ($-1k/yr) — negative.
- To cash-flow at today's rent, offer at most $213k (6.5% below list).
- To meet the 1% rule (rent ≥ 1% of price), the offer needs to be $186k (18.2% below list).
- Recommended offer: $186k (18.2% below list) — sets the bar for 1% rule.
- Cap rate 5.8% vs local median 3.8% in San Antonio — top-decile yield for the area; either an underpriced asset or a hidden risk that comps aren't pricing in. Stress-test before assuming the spread holds.
Location & tenants
- Location reads 80/100 on livability (#31 in TX, #1,616 nationally) — a professional / high-income tenant draw. Strengths: amenities A+, commute A+, cost of living A+; Watch: crime F.
- Southside ISD (rural): math 16% / reading 25% proficiency, ranked #771 of 826 in TX (top 93%) — low school quality limits family demand, transient renter base, plan for 1-2y turnover; 76% free/reduced lunch — lower-income household profile, screen leases tightly.
- Zoned schools: Julian C Gallardo El (math 13% / reading 22%, grade F, #3,805 of 4,322 statewide, top 89%, 544 students, 87% FRL); Julius L Matthey Middle (math 17% / reading 25%, grade F, #1,387 of 1,662 statewide, top 85%, 604 students, 92% FRL); Southside H S (math 18% / reading 25%, grade F, #1,377 of 1,632 statewide, top 85%, 1,685 students, 85% FRL).
- Market conditions: Rents falling (-7.2%/yr); 389 active listings in the ZIP; 14 comparable units currently listed for rent nearby; rentals at typical pace (median 26d on market — plan ~3-4 weeks tenant-placement turnaround); 8,308 units permitted in Bexar County in 2024 (2,506 in 5+ unit buildings).
- This rent runs 35% of the median local income ($64k/yr) — at the standard rent-burdened threshold; future hikes will face affordability resistance.
Forward outlook
- In year one you build about $6k of equity ($2k loan paydown + $5k appreciation (2.0% local appreciation)).
- Bexar County population projected at +50% by 2050 — long-run rental-demand tailwind backs the buy-and-hold thesis.
- By year 6, paydown + projected appreciation supports a ~$33k cash-out refi (75% LTV) — recoverable capital for the next deal without selling this one.
Negotiation context
- Only 12 days on market — expect competitive offers; lowballing is unlikely to land.
Questions for the listing agent
- What do current leases actually rent for vs. the listed asking? Can we see a recent rent roll and the last 12 months of T-12 income?
- Is there a deadline driving the sale (1031 exchange, divorce, estate, relocation)? That informs how much negotiation room exists.
- Crime grade is F in this area — have there been break-ins, vandalism, or insurance claims at this property in the last 3 years? What carrier currently insures it and at what premium?
- The area grade is low — what's the realistic commute time and amenity access for the typical tenant pool here? Any planned neighborhood developments (good or bad) we should know about?
- What's the average days-on-market for RENTAL listings here right now (not sales)? A rising rental-DOM trend means longer vacancies and softer asking-rent achievability than the comps imply.
- What's the recent tenant-quality profile in this submarket — average credit score on applications, eviction rate, late-payment / NSF rate, and stable-employment percentage? A property-management company in the area should have these aggregated.
- How much new for-sale + rental construction is in the pipeline within 1–3 miles? Heavy new supply typically softens prices + rents 12–24 months out; constrained supply supports both.
Investment metrics
- 1% rule
- 0.82% ✗
- Cap rate
- 5.75%
- Cash-on-cash
- -1.94%
- DSCR
- 0.91
- GRM
- 10.2
CMA / ARV
- ARV (on-the-fly)
- $286,836
- Comps found
- 12
Show comp detail 12 sales within ~0.75 mi
| Address | Dist | Beds/Ba | Sqft | Sold | Price | $/sf | Match |
|---|---|---|---|---|---|---|---|
| 14431 Brooke Path | 0.00mi | 4/3.5 | 2,149 (-1%) | 2mo | $267,999 | $125 | 91 |
| 9914 Chavaneaux Lndg | 0.05mi | 4/2.5 | 2,260 (+4%) | 0mo | $314,990 | $139 | 89 |
| 9902 Chavaneaux Lndg | 0.03mi | 4/2.5 | 2,260 (+4%) | 2mo | $314,990 | $139 | 88 |
| 9883 Chavaneaux Lndg | 0.08mi | 4/3.0 | 2,396 (+10%) | 2mo | $319,990 | $134 | 74 |
| 830 Middlebury Farms | 0.43mi | 4/2.5 | 2,121 (-2%) | 0mo | $277,990 | $131 | 74 |
| 1002 Catalonia Pass | 0.39mi | 5/2.5 (+1) | 1,971 (-9%) | 2mo | $251,020 | $127 | 58 |
| 830 Tranchet Trl | 0.55mi | 4/2.0 | 2,381 (+10%) | 0mo | $335,684 | $141 | 58 |
| 1010 Catalonia Pass | 0.40mi | 5/2.5 (+1) | 1,892 (-13%) | 0mo | $245,050 | $130 | 52 |
| 1007 Catalonia Pass | 0.37mi | 5/2.5 (+1) | 1,892 (-13%) | 2mo | $284,050 | $150 | 52 |
| 9630 Pleasanton Pl | 0.73mi | 3/2.5 (-1) | 2,249 (+4%) | 2mo | $230,000 | $102 | 52 |
| 9610 Pleasanton Pl | 0.74mi | 3/2.5 (-1) | 2,249 (+4%) | 2mo | $230,000 | $102 | 51 |
| 822 Bifurcate Bnd | 0.63mi | 3/2.5 (-1) | 1,908 (-12%) | 1mo | $252,068 | $132 | 42 |
Match score weights: distance 35% · size 25% · config 20% · recency 20%. Top-matched comps best support the ARV.
Projected returns pro-forma
2.03% appreciation · 0.0% rent growth · sell at horizon
- IRR
- 1.2%
- Equity multiple
- 1.06×
- Total profit
- $3,969
- Equity at exit
- $90,280
- IRR
- 3.8%
- Equity multiple
- 1.50×
- Total profit
- $31,869
- Equity at exit
- $130,275
Cash invested: $63,840 (down + closing). Projections, not guarantees.
Landlord ↔ Tenant lean methodology
- Overall (STATE)
- 87 Strongly Landlord-Friendly
- State Texas
- 87 Strongly Landlord-Friendly · R+5
- County
- — inherits STATE
- City
- — inherits STATE
ZIP-level market 78221
- Home prices YoY
- 0.8%
- Rents YoY
- -7.2%
- Active inventory
- 389
- Price-to-rent
- 10.2×
Monthly cashflow live
- Estimated rent
- $1,864 high interval (Pro) →
- Mortgage (P&I)
- −$1,196
- Tax est. 1.5%
- −$285 /mo · $3,420/yr
- Insurance
- −$95
- HOA
- −$0
- Vacancy / Maint / Mgmt
- −$391
- Net cashflow
- $-103
Break-even live
Sensitivity live
| Price | -10% $55 | -5% $-24 | +0% $-103 | +5% $-182 | +10% $-261 |
|---|---|---|---|---|---|
| Rent | -10% $-250 | -5% $-177 | +0% $-103 | +5% $-29 | +10% $44 |
| Rate | -1.0pp $12 | -0.5pp $-45 | base $-103 | +0.5pp $-162 | +1.0pp $-222 |
UW: 25.0% down · 7.5% · 30yr · 1.5% tax · 5.0% vac · 8.0% maint · 8.0% mgmt
Financing live
Cash to close
- Down payment
- $57,000
- Closing costs
- $6,840
- Reserves months
- —
- Total cash needed
- —
Loan-product check · same deal, 3 products live
Conventional
25% down · 7.5% · 30yr
- Down + closing
- —
- Monthly P&I
- —
- Monthly cashflow
- —
- DSCR
- —
- Eligible?
- —
Personal DTI + credit; lowest rate.
DSCR
20% down · 8.5% · 30yr
- Down + closing
- —
- Monthly P&I
- —
- Monthly cashflow
- —
- DSCR
- —
- Eligible?
- —
No personal income docs; deal must DSCR.
Hard money
10% down · 12.0% · 12mo
- Down + closing
- —
- Monthly P&I
- —
- Monthly cashflow
- —
- DSCR
- —
- Eligible?
- —
Short-term bridge; refi at stabilization.
Rent comps 14 comps
| Address | Beds | Baths | Sqft | Rent | $/sqft | DOM | Units | Dist |
|---|---|---|---|---|---|---|---|---|
| 9879 Chavaneaux Lndg San Antonio, TX | 4.0 | 2.0 | 1585 | $1,700 | $1.07 | 25d | 1 | 0.09mi |
| 1011 Catalonia Pass San Antonio, TX | 3.0 | 2.5 | 1470 | $1,700 | $1.16 | 25d | 1 | 0.38mi |
| 9606 Pleasanton Sq San Antonio, TX | 3.0 | 2.5 | 1903 | $1,700 | $0.89 | 13d | 1 | 0.71mi |
| 9419 Platte Pl San Antonio, TX | 3.0 | 2.5 | 1780 | $1,799 | $1.01 | 12d | 1 | 0.78mi |
| 9406 Hinterlands Dr San Antonio, TX | 3.0 | 2.0 | 1675 | $1,899 | $1.13 | 19d | 1 | 0.80mi |
| 9403 Hinterlands Dr San Antonio, TX | 3.0 | 2.5 | 2726 | $2,400 | $0.88 | 25d | 1 | 0.82mi |
| 11426 Four Iron Way San Antonio, TX | 4.0 | 2.5 | 1814 | $1,695 | $0.93 | 6d | 1 | 0.97mi |
| 8930 Scarlett Pl San Antonio, TX | 4.0 | 2.5 | 1956 | $1,700 | $0.87 | 45d | 1 | 1.15mi |
| 8919 Scarlett Pl San Antonio, TX | 3.0 | 2.5 | 1777 | $1,645 | $0.93 | 25d | 1 | 1.17mi |
| 8818 Scarlett Pl San Antonio, TX | 3.0 | 2.5 | 1645 | $1,630 | $0.99 | 25d | 1 | 1.24mi |
| 11723 Faldo Way San Antonio, TX | 4.0 | 3.5 | 2680 | $3,500 | $1.31 | 0d | 1 | 1.26mi |
| 614 Barberry St Unit 201 San Antonio, TX | 3.0 | 2.0 | 1718 | $1,550 | $0.90 | 45d | 1 | 1.27mi |
| 710 Titleist Cv San Antonio, TX | 4.0 | 2.5 | 1950 | $1,680 | $0.86 | 45d | 1 | 1.34mi |
| 2203 Cielo Rio, Lot 102 San Antonio, TX | 2.0–4.0 | 2.0–2.5 | 1574 | $2,845 | $1.81 | 0d | 150 | 1.43mi |
Listing history 6 events
-
2026-06-07days on market $227,999 Active 12 DOM
-
2026-06-04days on market $227,999 Active 9 DOM
-
2026-06-03days on market $227,999 Active 8 DOM
-
2026-06-02days on market $227,999 Active 7 DOM
-
2026-06-01days on market $227,999 Active 6 DOM
-
2026-05-31days on market $227,999 Active 5 DOM
ⓘ Source: listings_history table (triggers on properties + properties_extension) + one-shot
backfill from property_details.listing_events for pre-trigger history.
Nearby sold comps map
Loading sold comps map…
Walkable amenities ~0.75 mi
Loading nearby amenities…
Taxation est. · year 1
- Rental income
- $22,370
- − Mortgage interest
- −$12,771
- − Property taxes
- −$3,420
- − Insurance
- −$1,140
- − Repairs & maintenance
- −$1,790
- − Management
- −$1,790
- − Depreciation
- −$6,633
- Taxable loss
- −$5,174
- Est. tax savings @ 24.0%
- +$1,242
- After-tax cash flow
- $6/yr
For passive investors: Depreciation is non-cash, so a rental often shows a tax loss while cash-flowing — sheltering income. Rental losses are passive: they offset passive income freely, and up to $25,000/yr can offset ordinary (W-2) income if you actively participate and your MAGI is under $100k (phasing out to $0 by $150k); unused losses carry forward. On sale, claimed depreciation is recaptured at up to 25%, and gains may owe capital-gains tax (a 1031 exchange can defer both). Figures are a year-1 estimate at your 24.0% rate — not tax advice; consult a CPA.
Condition & rehab AI · 25 photos
This new two-story home is move-in ready with an open-concept floorplan and modern finishes. It offers excellent curb appeal and is well-maintained throughout.
Value-add opportunities
- Resale Painting the exterior brick — Fresh paint can enhance curb appeal and home value
- Resale Landscaping improvements — Enhanced landscaping can attract more potential buyers
- Both Adding smart home features — Smart home features can increase both resale and rental value
Renovation cost estimate screening
Value-add ROI direction
- Resale Painting the exterior brick — Fresh paint can enhance curb appeal and home value ↑
- Resale Landscaping improvements — Enhanced landscaping can attract more potential buyers ↑
- Both Adding smart home features — Smart home features can increase both resale and rental value ↑
ⓘ Cost ranges are severity-bucket heuristics (US national rule-of-thumb). Get contractor quotes + a written scope before underwriting a rehab budget.
Schools (NCES district)
- District
- Southside ISD
- NCES district ID
- 4840920
- Math proficiency
- 16% ▼ -15.00%
- Reading proficiency
- 25% ▼ -2.00%
- Median HH income
- $43,526
- Composite
- 17.68/100
- National rank
- #9027
- State rank
- #771 of 826 in TX
Livability — San Antonio
- Score
- 80/100
- State rank
- #31
- US rank
- #1616
Category grades
Schools grade is shown separately in the Schools card above.
Census & demographics
- Census place
- San Antonio, TX
- County
- Bexar County · 1,990,555 people
- City population
- 1,806,925
- Metro
- San Antonio-New Braunfels, TX
- Population (ZIP)
- 42,178
- Household income
- $63,811
- Rent vs Own
- Severe rent burden
- 1180.0
Population outlook (Bexar County) Hauer SSP2
- Today (2025)
- 2,336,851 people
- By 2030
- 2,560,728 · +9.6%
- By 2040
- 3,020,569 · +29.3%
- By 2050
- 3,493,522 · +49.5%
- By 2075
- 4,668,459 · +99.8%
- By 2100
- 5,533,242 · +136.8%
Race, ethnicity, and origin ACS 2023
- Neighborhood character
- Predominantly Hispanic (89%)
- Race & ethnicity
- Hispanic / Latino 89% Two or more races 28% White 9% Native American 2%
- Hispanic origin (detail)
- Mexican 74%
- Common ancestry
- Lithuanian 1% Romanian 1%
- Foreign-born
- 16% · Canada
- Languages at home
- 45% English-only · Spanish 54%
Political lean MEDSL · Bexar
- 2024 margin
- Lean D (+9.8) · D 54.3% · R 44.6% · Other 1.1%
- 2008→2024 swing
- +4.2pp toward D · 2008: 5.6pp · 2024: 9.8pp
- All cycles
- 2024: D+9.8 2020: D+18.2 2016: D+13.5 2012: D+4.6 2008: D+5.6
Not yet ingested
- Civics
- —
Market trends
- HPI YoY
- ▲ 2.03%
- Current HPI
- 251.1635
- Rent YoY
- ▼ -7.21%
- Metro
- San Antonio-New Braunfels, TX
- State GDP YoY
- ▲ 3.95%
- F500 in state
- 110
Industry mix (Fortune 500 HQ in TX)
| Industry | F500 HQs | Revenue |
|---|---|---|
| Energy | 16 | $1,198B |
|
||
| Technology | 5 | $198B |
|
||
| Engineering / Construction | 4 | $72B |
|
||
| Energy Services | 3 | $60B |
|
||
| Utilities | 3 | $41B |
|
||
| Healthcare | 2 | $330B |
|
||
Cash-flow waterfall
monthlySold comps — $/sqft
last 12 mo · ≤1 miLoading sold comps…