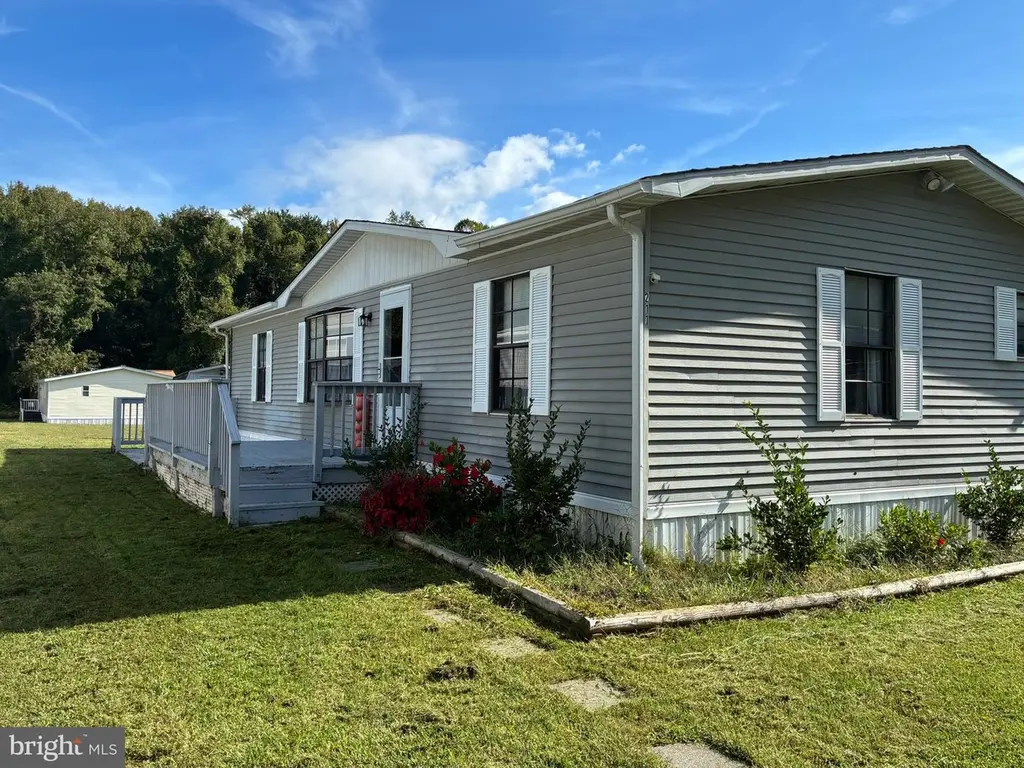
211 Forest Grn · Perryman, MD
Flood risk No data
- FEMA flood zone
- —
- Chance of flooding over 30 yrs
- —
- Est. flood insurance / yr
- —
Fire risk No data
- Est. fire insurance / yr
- —
Heat risk No data
- Hot days now (above threshold)
- —
- Hot days in 30 yrs
- —
Wind risk No data
- Chance of severe wind over 30 yrs
- —
Air-quality risk No data
- Unhealthy air days now
- —
- Unhealthy air days in 30 yrs
- —
Risk factors via First Street. Map © Google.
Why this score? — see what drove the B grade
The composite is a weighted blend of 9 inputs, each scored 0–100. Each bar is that input's sub-score; the figure is the points it added to the 100-point composite (weight × sub-score).
- Cash flow +30.0/30.0
- ARV discount +12.8/15.0
- 1% rule +10.0/10.0
- DSCR +10.0/10.0
- Livability +3.2/5.0
- Schools +2.9/10.0
- Rent growth +2.6/5.0
- Condition / age +2.5/5.0
- Appreciation +0.0/10.0
$75,000
🖨 Deal sheet 📄 Offer letter ✓ Due diligence
Listing remarks
3 bed 2 bath Doublewide with double-deck in a quiet private country setting community within walking distance to water view and a fishing hole. Remodeled, new flooring, new roof, new countertops & light fixtures. All bedrooms have walk in closets. One story ranch style open floor plan. Lot rent includes lot, Prop tax, trash and snow removal, water and sewer hook up, community management and maintenance, playground, basketball hoop and pavilion .
Key facts
- Remodeled
- New flooring
- Walk in closets
Tags
Property features AI
Finance
- Other: Ownership is ground rent
- Financial info: Ground rent exists and is paid monthly
Exterior
- Parking: Other parking
- Utilities: Public water; Public sewer; Electric service; Cable TV available
- Home design: Manufactured home; Above-grade living space (estimated finished area)
- Construction: Frame construction; Asphalt roof; Double-pane windows; No basement
- Exterior features: Deck(s); Shed; Other lot features
Interior
- Kitchen: Electric range/oven (self-cleaning); Refrigerator; Dishwasher
- Bedrooms: 3 bedrooms on the main level
- Bathrooms: 2 full bathrooms (both on the main level)
- Heating & cooling: Forced-air heating (electric); Central air conditioning; Ceiling fan(s)
- Interior features: Kitchen with table space; Dining area; Storm door(s); Other interior features
- Laundry & utility: Washer; Dryer; Electric hot water
Neighborhood map
What this means for you Summary
Snapshot
- This is a 3-bed/2.0-bath single-family listed at $75k.
Deal economics
- At list price, monthly cash flow is $1k ($15k/yr) — positive.
- The deal already cash-flows at list — no discount required.
- Meets the 1% rule at list price ($2k rent vs $75k).
- Recommended offer: $73k (3.0% below list) — sets the bar for market timing.
- Cap rate 26.6% vs local median 5.7% in Perryman — top-decile yield for the area; either an underpriced asset or a hidden risk that comps aren't pricing in. Stress-test before assuming the spread holds.
Location & tenants
- Location reads 63/100 on livability (#293 in MD) — a middle-class / working-renter tenant base. Strengths: housing A+, crime A-, cost of living A-; Watch: employment C-, commute D+, schools F.
- Harford County Public Schools (suburban): math 22% / reading 39% proficiency, ranked #9 of 24 in MD (top 38%) — families likely to look elsewhere, expect single-tenant / working-renter base with shorter leases.
- Market conditions: Rents flat; 186 active listings in the ZIP; solid renter incomes; 803 units permitted in Harford County in 2024 (26 in 5+ unit buildings).
- This rent runs 33% of the median local income ($83k/yr) — at the standard rent-burdened threshold; future hikes will face affordability resistance.
Forward outlook
- Local home prices are declining (-3.0%/yr); year-one equity from $519 of loan paydown is wiped out by about $2k of value loss. Plan a longer hold.
- At projected returns (-3.0% appreciation + 0.3% rent growth), your $21k cash investment doubles in ~2 years — after that, you're playing with house money.
Negotiation context
- It's been on market 42 days — a 3% lower offer ($73k) is reasonable based on typical stale-listing flexibility.
- 8 sale attempts since 31y ago with the ask held roughly flat each time — persistent listings suggest the price (not the market) is what's stuck; bring a comps-based counter.
Questions for the listing agent
- It's been on market 42 days. Have you received any prior offers? Is the seller open to a 3% concession, seller financing, or rate buy-down credit?
- Is there a deadline driving the sale (1031 exchange, divorce, estate, relocation)? That informs how much negotiation room exists.
- Schools are F-rated, which usually means shorter tenancies and higher turnover. Who's the typical renter profile here, and what's been the actual vacancy rate?
- What's the average days-on-market for RENTAL listings here right now (not sales)? A rising rental-DOM trend means longer vacancies and softer asking-rent achievability than the comps imply.
- What's the recent tenant-quality profile in this submarket — average credit score on applications, eviction rate, late-payment / NSF rate, and stable-employment percentage? A property-management company in the area should have these aggregated.
- How much new for-sale + rental construction is in the pipeline within 1–3 miles? Heavy new supply typically softens prices + rents 12–24 months out; constrained supply supports both.
Investment metrics
- 1% rule
- 3.02% ✓
- Cap rate
- 26.63%
- Cash-on-cash
- 72.64%
- DSCR
- 4.23
- GRM
- 2.8
CMA / ARV
- ARV (median comp)
- $84,979
- List price
- $75,000
- Delta
- -11.74%
- Verdict
- UNDERPRICED
- Comps
- 20 within 1.0 mi
Show comp detail 6 sales within ~0.75 mi
| Address | Dist | Beds/Ba | Sqft | Sold | Price | $/sf | Match |
|---|---|---|---|---|---|---|---|
| 225 Poclain Dr | 0.33mi | 3/2.0 | 1,400 (+4%) | 1mo | $104,990 | $75 | 77 |
| 1922 Fletcher Rd | 0.29mi | 3/2.0 | 1,344 (0%) | 14mo | $89,900 | $67 | 75 |
| 1903 Bennett Rd | 0.23mi | 3/2.0 | 1,250 (-7%) | 4mo | $90,000 | $72 | 74 |
| 306 Heron St | 0.43mi | 3/2.5 | 1,332 (-1%) | 4mo | $288,000 | $216 | 73 |
| 1912 Perryman Rd | 0.47mi | 3/2.5 | 1,332 (-1%) | 7mo | $300,000 | $225 | 69 |
| 302 Seagull Dr | 0.47mi | 4/2.0 (+1) | 1,475 (+10%) | 17mo | $374,000 | $254 | 42 |
Match score weights: distance 35% · size 25% · config 20% · recency 20%. Top-matched comps best support the ARV.
Projected returns pro-forma
-3.0% appreciation · 0.28% rent growth · sell at horizon
- IRR
- 69.2%
- Equity multiple
- 3.99×
- Total profit
- $62,806
- Equity at exit
- $11,183
- IRR
- 72.5%
- Equity multiple
- 7.46×
- Total profit
- $135,624
- Equity at exit
- $6,485
Cash invested: $21,000 (down + closing). Projections, not guarantees.
Landlord ↔ Tenant lean methodology
- Overall (STATE)
- 27 Tenant-Leaning
- State Maryland
- 27 Tenant-Leaning · D+14
- County
- — inherits STATE
- City
- — inherits STATE
ZIP-level market 21001
- Home prices YoY
- -30.5%
- Rents YoY
- 0.3%
- Active inventory
- 186
- Price-to-rent
- 2.8×
Monthly cashflow live
- Estimated rent
- $2,265 medium interval (Pro) →
- Mortgage (P&I)
- −$393
- Tax est. 1.5%
- −$94 /mo · $1,125/yr
- Insurance
- −$31
- HOA
- −$0
- Vacancy / Maint / Mgmt
- −$476
- Net cashflow
- $1,271
Break-even live
UW: 25.0% down · 7.5% · 30yr · 1.5% tax · 5.0% vac · 8.0% maint · 8.0% mgmt
Financing live
Cash to close
- Down payment
- $18,750
- Closing costs
- $2,250
- Reserves months
- —
- Total cash needed
- —
Loan-product check · same deal, 3 products live
Conventional
25% down · 7.5% · 30yr
- Down + closing
- —
- Monthly P&I
- —
- Monthly cashflow
- —
- DSCR
- —
- Eligible?
- —
Personal DTI + credit; lowest rate.
DSCR
20% down · 8.5% · 30yr
- Down + closing
- —
- Monthly P&I
- —
- Monthly cashflow
- —
- DSCR
- —
- Eligible?
- —
No personal income docs; deal must DSCR.
Hard money
10% down · 12.0% · 12mo
- Down + closing
- —
- Monthly P&I
- —
- Monthly cashflow
- —
- DSCR
- —
- Eligible?
- —
Short-term bridge; refi at stabilization.
Listing history 34 events
-
2026-06-18days on market $75,000 Active 42 DOM
-
2026-06-17days on market $75,000 Active 41 DOM
-
2026-06-16days on market $75,000 Active 40 DOM
-
2026-06-15days on market $75,000 Active 39 DOM
-
2026-06-13days on market $75,000 Active 37 DOM
-
2026-06-09days on market $75,000 Active 33 DOM
-
2026-06-08days on market $75,000 Active 32 DOM
-
2026-06-07days on market $75,000 Active 31 DOM
-
2026-06-04days on market $75,000 Active 28 DOM
-
2026-06-03days on market $75,000 Active 27 DOM
-
2026-06-02days on market $75,000 Active 26 DOM
-
2026-06-01days on market $75,000 Active 25 DOM
-
2026-05-31days on market $75,000 Active 24 DOM
-
2026-05-13status Pending 456-char remark
-
2026-04-27$75,000 Active 456-char remark
-
2026-03-31historical
-
2026-02-11price $80,000
-
2025-11-09price $95,000
-
2025-10-29price $99,000
-
2025-10-03$105,000 Active
-
2025-10-01historical
-
2025-08-11historical
-
2025-06-26$82,000 Active
-
2025-06-24historical
-
2025-03-20historical
-
2025-02-21$78,500 Active
-
2024-07-11soldstatus $90,325 Closed
-
2024-06-23status Pending
-
2024-06-21status Active
-
2024-06-13status Pending
-
2024-05-16$94,500 Active
-
1995-06-01soldstatus $33,500
-
1995-05-09historical
-
1995-01-27$34,900
ⓘ Source: listings_history table (triggers on properties + properties_extension) + one-shot
backfill from property_details.listing_events for pre-trigger history.
Nearby sold comps map
Loading sold comps map…
Walkable amenities ~0.75 mi
Loading nearby amenities…
Taxation est. · year 1
- Rental income
- $27,182
- − Mortgage interest
- −$4,201
- − Property taxes
- −$1,125
- − Insurance
- −$375
- − Repairs & maintenance
- −$2,175
- − Management
- −$2,175
- − Depreciation
- −$2,182
- Taxable income
- $14,950
- Est. tax owed @ 24.0%
- −$3,588
- After-tax cash flow
- $11,666/yr
For passive investors: Depreciation is non-cash, so a rental often shows a tax loss while cash-flowing — sheltering income. Rental losses are passive: they offset passive income freely, and up to $25,000/yr can offset ordinary (W-2) income if you actively participate and your MAGI is under $100k (phasing out to $0 by $150k); unused losses carry forward. On sale, claimed depreciation is recaptured at up to 25%, and gains may owe capital-gains tax (a 1031 exchange can defer both). Figures are a year-1 estimate at your 24.0% rate — not tax advice; consult a CPA.
Schools (NCES district)
- District
- Harford County Public Schools
- NCES district ID
- 2400390
- Math proficiency
- 22% ▼ -23.00%
- Reading proficiency
- 39% ▼ -12.00%
- Median HH income
- $79,569
- Composite
- 29.38/100
- National rank
- #6527
- State rank
- #9 of 24 in MD
Livability — Perryman
- Score
- 63/100
- State rank
- #293
- US rank
- #15253
Category grades
Schools grade is shown separately in the Schools card above.
Census & demographics
- Census place
- Perryman, MD
- County
- Harford County · 198,512 people
- City population
- 75
- Metro
- Baltimore-Columbia-Towson, MD
- Population (ZIP)
- 27,168
- Household income
- $83,238
- Rent vs Own
- Severe rent burden
- 736.0
Population outlook (Harford County) Hauer SSP2
- Today (2025)
- 262,292 people
- By 2030
- 266,437 · +1.6%
- By 2040
- 269,954 · +2.9%
- By 2050
- 265,659 · +1.3%
- By 2075
- 252,886 · -3.6%
- By 2100
- 224,014 · -14.6%
Race, ethnicity, and origin ACS 2023
- Neighborhood character
- Diverse neighborhood (Simpson 0.62)
- Race & ethnicity
- White 54% Black 28% Hispanic / Latino 9% Two or more races 9% Asian 3%
- Hispanic origin (detail)
- Mexican 3% Puerto Rican 2% Dominican 1%
- Common ancestry
- Romanian 3% Slovak 1% Scotch-Irish 1%
- Foreign-born
- 8% · Canada, China, South Korea
- Languages at home
- 89% English-only · Spanish 4% Other Indo-European 1% German/W. Germanic 1%
Political lean MEDSL · Harford
- 2024 margin
- R (+13.8) · D 41.9% · R 55.7% · Other 2.4%
- 2008→2024 swing
- +5.0pp toward D · 2008: -18.8pp · 2024: -13.8pp
- All cycles
- 2024: R+13.8 2020: R+12.0 2016: R+24.5 2012: R+19.5 2008: R+18.8
Not yet ingested
- Civics
- —
Market trends
- HPI YoY
- ▼ -108.65%
- Current HPI
- 247.668
- Rent YoY
- ▲ 0.28%
- Metro
- Baltimore-Columbia-Towson, MD
- State GDP YoY
- ▲ 2.97%
- F500 in state
- 12
Industry mix (Fortune 500 HQ in MD)
| Industry | F500 HQs | Revenue |
|---|---|---|
| Aerospace / Defense | 1 | $71B |
|
||
| Utilities | 1 | $25B |
|
||
| Hotels | 1 | $24B |
|
||
| Consumer Goods | 1 | $7B |
|
||
| Real Estate | 1 | $6B |
|
||
| Chemicals | 1 | $2B |
|
||
Price history
+114.9% since first listed22 events — show timeline
- 2026-05-22 Relisted — BRIGHT MLS
- 2026-05-13 Pending — BRIGHT MLS
- 2026-04-27 Listed $75,000 BRIGHT MLS
- 2026-03-31 Listing Removed — BRIGHT MLS
- 2026-02-11 Price Changed $80,000 BRIGHT MLS
- 2025-11-09 Price Changed $95,000 BRIGHT MLS
- 2025-10-29 Price Changed $99,000 BRIGHT MLS
- 2025-10-03 Listed $105,000 BRIGHT MLS
- 2025-10-01 Coming Soon — BRIGHT MLS
- 2025-08-11 Listing Removed — BRIGHT MLS
- 2025-06-26 Listed $82,000 BRIGHT MLS
- 2025-06-24 Coming Soon — BRIGHT MLS
- 2025-03-20 Listing Removed — BRIGHT MLS
- 2025-02-21 Listed $78,500 BRIGHT MLS
- 2024-07-11 Sold (MLS) $90,325 BRIGHT MLS
- 2024-06-23 Pending — BRIGHT MLS
- 2024-06-21 Relisted — BRIGHT MLS
- 2024-06-13 Pending — BRIGHT MLS
- 2024-05-16 Listed $94,500 BRIGHT MLS
- 1995-06-01 Sold (MLS) $33,500 MRIS
- 1995-05-09 Delisted — MRIS
- 1995-01-27 Listed $34,900 MRIS
Cash-flow waterfall
monthlySold comps — $/sqft
last 12 mo · ≤1 miLoading sold comps…