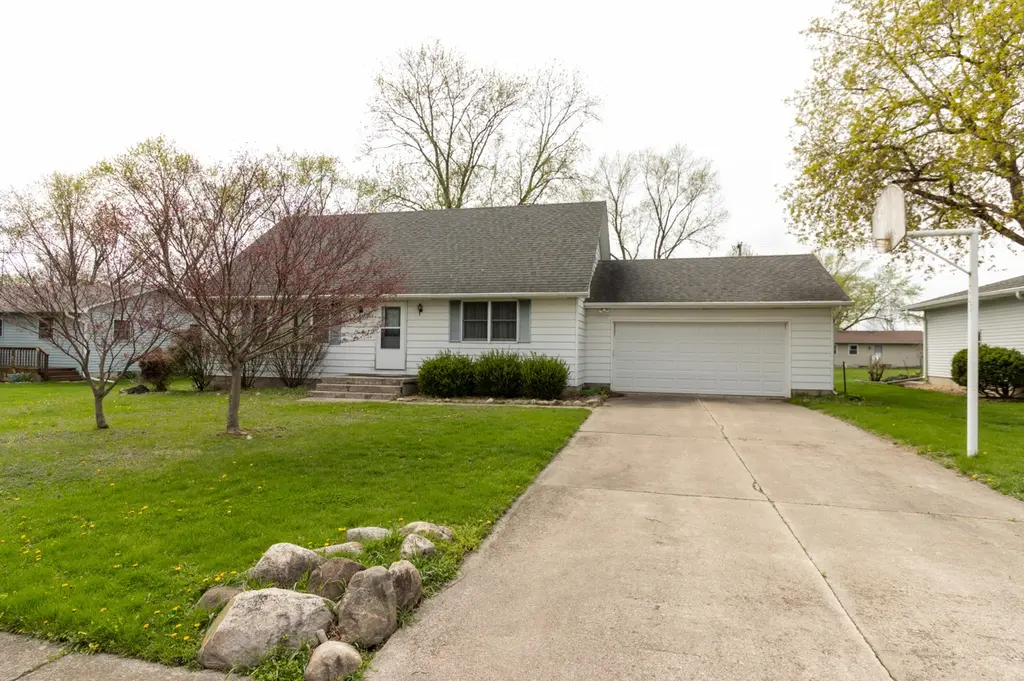
263 Bel Aire Dr · Lowell, IN
Flood risk 1/10 · Minimal
- FEMA flood zone
- X (unshaded)
- Chance of flooding over 30 yrs
- 0.0%
- Est. flood insurance / yr
- $473 – $860
Fire risk 1/10 · Minimal
- Est. fire insurance / yr
- $717 – $1,331
Heat risk 3/10 · Minor
- Hot days now (above 101°F)
- 7 days/yr
- Hot days in 30 yrs
- 16 days/yr
Wind risk 2/10 · Minimal
- Chance of severe wind over 30 yrs
- —
Air-quality risk 2/10 · Minimal
- Unhealthy air days now
- 1 days/yr
- Unhealthy air days in 30 yrs
- 2 days/yr
Risk factors via First Street. Map © Google.
Why this score? — see what drove the B- grade
The composite is a weighted blend of 9 inputs, each scored 0–100. Each bar is that input's sub-score; the figure is the points it added to the 100-point composite (weight × sub-score).
- Cash flow +23.4/30.0
- ARV discount +15.0/15.0
- DSCR +7.5/10.0
- 1% rule +6.5/10.0
- Schools +4.5/10.0
- Livability +3.8/5.0
- Rent growth +2.5/5.0
- Condition / age +2.5/5.0
- Appreciation +0.0/10.0
$242,500
🖨 Deal sheet 📄 Offer letter ✓ Due diligence
Listing remarks MLS
Investor Special | Sweat Equity Opportunity | Craftsman Charm Call it sweat equity, an investor special, or a rehab lover's dream--this solidly built Craftsman-style home is full of potential and ready for its next chapter. With great bones and timeless character, it simply needs updates and a cosmetic refresh to truly shine. Featuring 4 bedrooms and 2 full baths, this home offers the space and layout buyers are looking for--making it the perfect opportunity to build instant equity. Located in the heart of a well-established neighborhood where many original homeowners still reside, opportunities like this are rare. Homes here don't come available often--don't miss your chance to bring this one back to life! Bring your highest and best. Selling as-is. Multiple offers likely--don't wait.
Key facts
- 0.27 acre lot
- 2 garage spots
- Built 1972
Neighborhood map
What this means for you Summary
Snapshot
- This is a 3-bed/1.0-bath single-family listed at $242k.
Deal economics
- At list price, monthly cash flow is $449 ($5k/yr) — positive.
- The deal already cash-flows at list — no discount required.
- Meets the 1% rule at list price ($3k rent vs $242k).
- Recommended offer: $239k (1.5% below list) — sets the bar for market timing.
- Cap rate 8.5% vs local median 3.9% in Lowell — top-decile yield for the area; either an underpriced asset or a hidden risk that comps aren't pricing in. Stress-test before assuming the spread holds.
Location & tenants
- Location reads 76/100 on livability (#51 in IN, #3,455 nationally) — a middle-class / working-renter tenant base. Strengths: crime A+, cost of living A+, housing A+; Watch: health & safety C-, amenities F, commute F.
- Tri-Creek School Corporation (town): math 46% / reading 56% proficiency, ranked #39 of 301 in IN (top 13%) — acceptable for families but not a draw, mixed tenant base, ~2y average lease.
- Market conditions: 350 active listings in the ZIP; 1 comparable units currently listed for rent nearby; 1,642 units permitted in Lake County in 2024 (14 in 5+ unit buildings).
Forward outlook
- Local home prices are declining (-3.0%/yr); year-one equity from $2k of loan paydown is wiped out by about $7k of value loss. Plan a longer hold.
- Lake County population projected to shrink 7% by 2050 — rents likely to lag national; underwrite the cash flow, not the appreciation.
Negotiation context
- It's been on market 16 days — a 2% lower offer ($239k) is reasonable based on typical stale-listing flexibility.
- 2 sale attempts with the ask held roughly flat each time — persistent listings suggest the price (not the market) is what's stuck; bring a comps-based counter.
Questions for the listing agent
- Built in 1972 — when were the roof, HVAC, electrical panel, plumbing, and water heater last replaced?
- Is there a deadline driving the sale (1031 exchange, divorce, estate, relocation)? That informs how much negotiation room exists.
- What's the average days-on-market for RENTAL listings here right now (not sales)? A rising rental-DOM trend means longer vacancies and softer asking-rent achievability than the comps imply.
- What's the recent tenant-quality profile in this submarket — average credit score on applications, eviction rate, late-payment / NSF rate, and stable-employment percentage? A property-management company in the area should have these aggregated.
- How much new for-sale + rental construction is in the pipeline within 1–3 miles? Heavy new supply typically softens prices + rents 12–24 months out; constrained supply supports both.
Investment metrics
- 1% rule
- 1.15% ✓
- Cap rate
- 8.51%
- Cash-on-cash
- 7.93%
- DSCR
- 1.35
- GRM
- 7.2
CMA / ARV
- ARV (median comp)
- $359,198
- List price
- $242,500
- Delta
- -32.49%
- Verdict
- UNDERPRICED
- Comps
- 20 within 1.0 mi
Show comp detail 12 sales within ~0.75 mi
| Address | Dist | Beds/Ba | Sqft | Sold | Price | $/sf | Match |
|---|---|---|---|---|---|---|---|
| 263 Bel Aire Dr | 0.00mi | 4/2.0 (+1) | 2,240 (0%) | 1mo | $215,000 | $96 | 90 |
| 5510 Malibu Dr | 0.52mi | 4/3.0 (+1) | 2,282 (+2%) | 1mo | $395,000 | $173 | 59 |
| 2183 Oakwood Ln | 0.43mi | 3/2.0 | 2,101 (-6%) | 11mo | $339,900 | $162 | 57 |
| 4902 Richard Dr | 0.55mi | 3/2.0 | 2,113 (-6%) | 11mo | $480,000 | $227 | 52 |
| 4944 Stephen Ln | 0.60mi | 3/2.0 | 2,113 (-6%) | 9mo | $503,550 | $238 | 51 |
| 4875 Richard Dr | 0.59mi | 3/2.0 | 2,113 (-6%) | 9mo | $528,460 | $250 | 51 |
| 17603 Mount St | 0.39mi | 4/2.0 (+1) | 2,016 (-10%) | 7mo | $445,000 | $221 | 50 |
| 17359 Camelot Dr | 0.67mi | 3/3.0 | 2,376 (+6%) | 4mo | $340,000 | $143 | 47 |
| 1328 Hilltop Dr | 0.57mi | 3/1.5 | 1,912 (-15%) | 1mo | $269,900 | $141 | 46 |
| 6264 W 177th Ave | 0.65mi | 4/2.0 (+1) | 2,112 (-6%) | 10mo | $330,000 | $156 | 43 |
| 4851 Richard Dr | 0.61mi | 4/2.0 (+1) | 2,034 (-9%) | 7mo | $499,090 | $245 | 42 |
| 18363 Judith Way | 0.65mi | 4/2.5 (+1) | 2,454 (+10%) | 3mo | $551,550 | $225 | 40 |
Match score weights: distance 35% · size 25% · config 20% · recency 20%. Top-matched comps best support the ARV.
Projected returns pro-forma
-3.0% appreciation · 3.0% rent growth · sell at horizon
- IRR
- -4.2%
- Equity multiple
- 0.84×
- Total profit
- $-10,607
- Equity at exit
- $36,158
- IRR
- 5.6%
- Equity multiple
- 1.41×
- Total profit
- $27,970
- Equity at exit
- $20,967
Cash invested: $67,900 (down + closing). Projections, not guarantees.
Landlord ↔ Tenant lean methodology
- Overall (STATE)
- 90 Strongly Landlord-Friendly
- State Indiana
- 90 Strongly Landlord-Friendly · R+11
- County
- — inherits STATE
- City
- — inherits STATE
ZIP-level market 46356
- Home prices YoY
- -30.1%
- Active inventory
- 350
- Price-to-rent
- 7.2×
Monthly cashflow live
- Estimated rent
- $2,800 medium interval (Pro) →
- Mortgage (P&I)
- −$1,272
- Tax from tax record
- −$390 /mo · $4,684/yr
- Insurance
- −$101
- HOA
- −$0
- Vacancy / Maint / Mgmt
- −$588
- Net cashflow
- $449
Break-even live
UW: 25.0% down · 7.5% · 30yr · 1.5% tax · 5.0% vac · 8.0% maint · 8.0% mgmt
Financing live
Cash to close
- Down payment
- $60,625
- Closing costs
- $7,275
- Reserves months
- —
- Total cash needed
- —
Loan-product check · same deal, 3 products live
Conventional
25% down · 7.5% · 30yr
- Down + closing
- —
- Monthly P&I
- —
- Monthly cashflow
- —
- DSCR
- —
- Eligible?
- —
Personal DTI + credit; lowest rate.
DSCR
20% down · 8.5% · 30yr
- Down + closing
- —
- Monthly P&I
- —
- Monthly cashflow
- —
- DSCR
- —
- Eligible?
- —
No personal income docs; deal must DSCR.
Hard money
10% down · 12.0% · 12mo
- Down + closing
- —
- Monthly P&I
- —
- Monthly cashflow
- —
- DSCR
- —
- Eligible?
- —
Short-term bridge; refi at stabilization.
Rent comps 1 comps
| Address | Beds | Baths | Sqft | Rent | $/sqft | DOM | Units | Dist |
|---|---|---|---|---|---|---|---|---|
| 4507 W 173rd Ave Lowell, IN | 4.0 | 3.0 | 1900 | $2,800 | $1.47 | 18d | 1 | 0.90mi |
Listing history 4 events
-
2026-05-02status Pending 798-char remark
Show marketing remark (798 chars)
Investor Special | Sweat Equity Opportunity | Craftsman Charm Call it sweat equity, an investor special, or a rehab lover's dream--this solidly built Craftsman-style home is full of potential and ready for its next chapter. With great bones and timeless character, it simply needs updates and a cosmetic refresh to truly shine. Featuring 4 bedrooms and 2 full baths, this home offers the space and layout buyers are looking for--making it the perfect opportunity to build instant equity. Located in the heart of a well-established neighborhood where many original homeowners still reside, opportunities like this are rare. Homes here don't come available often--don't miss your chance to bring this one back to life! Bring your highest and best. Selling as-is. Multiple offers likely--don't wait.
-
2026-04-25status Active 798-char remark
Show marketing remark (798 chars)
Investor Special | Sweat Equity Opportunity | Craftsman Charm Call it sweat equity, an investor special, or a rehab lover's dream--this solidly built Craftsman-style home is full of potential and ready for its next chapter. With great bones and timeless character, it simply needs updates and a cosmetic refresh to truly shine. Featuring 4 bedrooms and 2 full baths, this home offers the space and layout buyers are looking for--making it the perfect opportunity to build instant equity. Located in the heart of a well-established neighborhood where many original homeowners still reside, opportunities like this are rare. Homes here don't come available often--don't miss your chance to bring this one back to life! Bring your highest and best. Selling as-is. Multiple offers likely--don't wait.
-
2026-04-21historical Active Under Contract 798-char remark
Show marketing remark (798 chars)
Investor Special | Sweat Equity Opportunity | Craftsman Charm Call it sweat equity, an investor special, or a rehab lover's dream--this solidly built Craftsman-style home is full of potential and ready for its next chapter. With great bones and timeless character, it simply needs updates and a cosmetic refresh to truly shine. Featuring 4 bedrooms and 2 full baths, this home offers the space and layout buyers are looking for--making it the perfect opportunity to build instant equity. Located in the heart of a well-established neighborhood where many original homeowners still reside, opportunities like this are rare. Homes here don't come available often--don't miss your chance to bring this one back to life! Bring your highest and best. Selling as-is. Multiple offers likely--don't wait.
-
2026-04-16$242,500 Active 798-char remark
Show marketing remark (798 chars)
Investor Special | Sweat Equity Opportunity | Craftsman Charm Call it sweat equity, an investor special, or a rehab lover's dream--this solidly built Craftsman-style home is full of potential and ready for its next chapter. With great bones and timeless character, it simply needs updates and a cosmetic refresh to truly shine. Featuring 4 bedrooms and 2 full baths, this home offers the space and layout buyers are looking for--making it the perfect opportunity to build instant equity. Located in the heart of a well-established neighborhood where many original homeowners still reside, opportunities like this are rare. Homes here don't come available often--don't miss your chance to bring this one back to life! Bring your highest and best. Selling as-is. Multiple offers likely--don't wait.
ⓘ Source: listings_history table (triggers on properties + properties_extension) + one-shot
backfill from property_details.listing_events for pre-trigger history.
Tax reassessment forecast IN · Partial reset (capped growth)
- Current annual tax
- $4,684 · $390/mo
- Projected year-2 tax
- $4,684 · $390/mo
- Expected delta
- $0/yr ($0/mo · 0.0%)
ⓘ Screening estimate from a state-policy table — verify with the county assessor before closing.
Climate risk First Street
- Flood 1/10 Low FEMA zone X (unshaded) · 0% chance over 30 yrs
- Wildfire 1/10 Low
- Heat 3/10 Moderate 7 d/yr ≥101°F today · 16 d/yr by 30 yrs out
- Wind 2/10 Low
- Air quality 2/10 Low 1 unhealthy d/yr today · 2 by 30 yrs out
Nearby sold comps map
Loading sold comps map…
Walkable amenities ~0.75 mi
Loading nearby amenities…
Taxation est. · year 1
- Rental income
- $33,600
- − Mortgage interest
- −$13,584
- − Property taxes
- −$4,684
- − Insurance
- −$1,212
- − Repairs & maintenance
- −$2,688
- − Management
- −$2,688
- − Depreciation
- −$7,055
- Taxable income
- $1,689
- Est. tax owed @ 24.0%
- −$405
- After-tax cash flow
- $4,982/yr
For passive investors: Depreciation is non-cash, so a rental often shows a tax loss while cash-flowing — sheltering income. Rental losses are passive: they offset passive income freely, and up to $25,000/yr can offset ordinary (W-2) income if you actively participate and your MAGI is under $100k (phasing out to $0 by $150k); unused losses carry forward. On sale, claimed depreciation is recaptured at up to 25%, and gains may owe capital-gains tax (a 1031 exchange can defer both). Figures are a year-1 estimate at your 24.0% rate — not tax advice; consult a CPA.
Schools (NCES district)
- District
- Tri-Creek School Corporation
- NCES district ID
- 1811460
- Math proficiency
- 46% ▼ -8.00%
- Reading proficiency
- 56% ▼ -5.00%
- Median HH income
- $64,614
- Composite
- 44.97/100
- National rank
- #2704
- State rank
- #39 of 301 in IN
Livability — Lowell
- Score
- 76/100
- State rank
- #51
- US rank
- #3455
Category grades
Schools grade is shown separately in the Schools card above.
Census & demographics
- Census place
- Lowell, IN
- City population
- 19,396
- Population (ZIP)
- 19,396
Population outlook (Lake County) Hauer SSP2
- Today (2025)
- 484,026 people
- By 2030
- 478,091 · -1.2%
- By 2040
- 462,974 · -4.3%
- By 2050
- 449,894 · -7.1%
- By 2075
- 436,169 · -9.9%
- By 2100
- 426,607 · -11.9%
Race, ethnicity, and origin ACS 2023
- Neighborhood character
- Predominantly White (88%)
- Race & ethnicity
- White 88% Hispanic / Latino 9% Two or more races 6%
- Hispanic origin (detail)
- Mexican 8%
- Common ancestry
- Romanian 16% Iranian 10% Lithuanian 2%
- Foreign-born
- 4% · Canada
- Languages at home
- 95% English-only · Spanish 4% Russian/Polish/Slavic 1%
Political lean MEDSL · Lake
- 2024 margin
- Lean D (+5.6) · D 52.1% · R 46.5% · Other 1.5%
- 2008→2024 swing
- -28.6pp toward R · 2008: 34.3pp · 2024: 5.6pp
- All cycles
- 2024: D+5.6 2020: D+15.1 2016: D+20.6 2012: D+31.0 2008: D+34.3
Not yet ingested
- Civics
- —
Market trends
- HPI YoY
- ▼ -110.73%
- Current HPI
- 256.6224
- Rent YoY
- —
- Metro
- —
- State GDP YoY
- ▲ 2.90%
- F500 in state
- 18
Industry mix (Fortune 500 HQ in IN)
| Industry | F500 HQs | Revenue |
|---|---|---|
| Industrial Machinery | 2 | $37B |
|
||
| Healthcare | 1 | $177B |
|
||
| Pharmaceuticals | 1 | $45B |
|
||
| Metals / Steel | 1 | $18B |
|
||
| Agriculture | 1 | $17B |
|
||
| Packaging | 1 | $12B |
|
||
Price history
4 events — show timeline
- 2026-05-02 Pending — NIRA MLS as Distributed by MLS Grid
- 2026-04-25 Relisted — NIRA MLS as Distributed by MLS Grid
- 2026-04-21 Contingent — NIRA MLS as Distributed by MLS Grid
- 2026-04-16 Listed $242,500 NIRA MLS as Distributed by MLS Grid
Property tax history
+11.4%/yrLatest (2024): $4,684 · +4.2% YoY. Source: county tax records.
Cash-flow waterfall
monthlySold comps — $/sqft
last 12 mo · ≤1 miLoading sold comps…