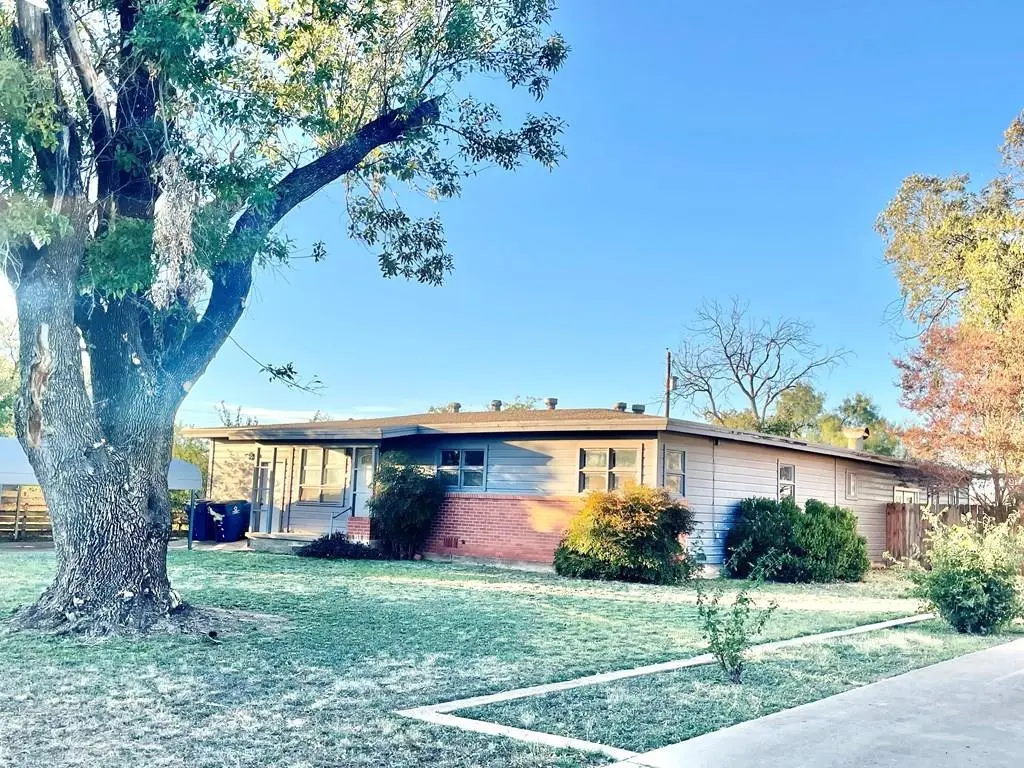
306 Laurel Dr · Winters, TX
Flood risk No data
- FEMA flood zone
- —
- Chance of flooding over 30 yrs
- —
- Est. flood insurance / yr
- —
Fire risk No data
- Est. fire insurance / yr
- —
Heat risk No data
- Hot days now (above threshold)
- —
- Hot days in 30 yrs
- —
Wind risk No data
- Chance of severe wind over 30 yrs
- —
Air-quality risk No data
- Unhealthy air days now
- —
- Unhealthy air days in 30 yrs
- —
Risk factors via First Street. Map © Google.
Why this score? — see what drove the C- grade
The composite is a weighted blend of 9 inputs, each scored 0–100. Each bar is that input's sub-score; the figure is the points it added to the 100-point composite (weight × sub-score).
- Cash flow +15.0/30.0
- Appreciation +8.2/10.0
- ARV discount +7.0/15.0
- DSCR +4.6/10.0
- 1% rule +4.3/10.0
- Livability +3.6/5.0
- Schools +2.6/10.0
- Rent growth +2.5/5.0
- Condition / age +2.5/5.0
$129,900
🖨 Deal sheet 📄 Offer letter ✓ Due diligence
Listing remarks MLS
Check out this 3/2 with Large den/ gameroom! the kitchen has oversized eat-at island and is an open concept with plenty of custom cabinetry. Original hardwoods grace the living room and bedrooms. Bedrooms have good closets. There is a full bath and a half bath. The half bath is plumbed to be a full bath. In the rear of the home is the large sunken den with retro fireplace that opens to the backyard and patio. Perfect for entertaining! Back yard has an ample sized shop/storage and newer privacy fence. This one is just waiting for it's next owner to love it and breathe life back into it!
Key facts
- Custom cabinetry
- Original hardwoods
- Open concept
Tags
Neighborhood map
What this means for you Summary
Snapshot
- This is a 3-bed/1.5-bath single-family listed at $130k.
Deal economics
- At list price, monthly cash flow is $39 ($474/yr) — positive.
- The deal already cash-flows at list — no discount required.
- To meet the 1% rule (rent ≥ 1% of price), the offer needs to be $120k (7.5% below list).
- Recommended offer: $114k (12.0% below list) — sets the bar for market timing.
Location & tenants
- Location reads 72/100 on livability (#271 in TX) — a middle-class / working-renter tenant base. Strengths: crime A+, cost of living A+, housing A+; Watch: schools F, amenities F, commute F.
- Winters ISD (town): math 31% / reading 31% proficiency, ranked #616 of 826 in TX (top 75%) — families likely to look elsewhere, expect single-tenant / working-renter base with shorter leases.
- Market conditions: 30 active listings in the ZIP; 2 units permitted in Runnels County in 2024 (0 in 5+ unit buildings).
Forward outlook
- In year one you build about $9k of equity ($898 loan paydown + $8k appreciation (6.4% local appreciation)).
- At projected returns (6.4% appreciation + 3.0% rent growth), your $36k cash investment doubles in ~4 years — after that, you're playing with house money.
- By year 4, paydown + projected appreciation supports a ~$31k cash-out refi (75% LTV) — recoverable capital for the next deal without selling this one.
Negotiation context
- It's been on market 219 days — a 12% lower offer ($114k) is reasonable based on typical stale-listing flexibility.
Questions for the listing agent
- It's been on market 219 days. Have you received any prior offers? Is the seller open to a 12% concession, seller financing, or rate buy-down credit?
- Built in 1965 — when were the roof, HVAC, electrical panel, plumbing, and water heater last replaced?
- Why hasn't it sold? Are there any deal-killer items the seller is aware of (foundation, flood, title, zoning, code violations)?
- Is there a deadline driving the sale (1031 exchange, divorce, estate, relocation)? That informs how much negotiation room exists.
- Schools are F-rated, which usually means shorter tenancies and higher turnover. Who's the typical renter profile here, and what's been the actual vacancy rate?
- What's the average days-on-market for RENTAL listings here right now (not sales)? A rising rental-DOM trend means longer vacancies and softer asking-rent achievability than the comps imply.
- What's the recent tenant-quality profile in this submarket — average credit score on applications, eviction rate, late-payment / NSF rate, and stable-employment percentage? A property-management company in the area should have these aggregated.
- How much new for-sale + rental construction is in the pipeline within 1–3 miles? Heavy new supply typically softens prices + rents 12–24 months out; constrained supply supports both.
Investment metrics
- 1% rule
- 0.93% ✗
- Cap rate
- 6.66%
- Cash-on-cash
- 1.30%
- DSCR
- 1.06
- GRM
- 9.0
CMA / ARV
- ARV (median comp)
- $128,447
- List price
- $129,900
- Delta
- 1.13%
- Verdict
- FAIR
- Comps
- 12 within 1.0 mi
Projected returns pro-forma
6.39% appreciation · 3.0% rent growth · sell at horizon
- IRR
- 17.3%
- Equity multiple
- 2.18×
- Total profit
- $43,058
- Equity at exit
- $84,865
- IRR
- 17.0%
- Equity multiple
- 4.41×
- Total profit
- $124,008
- Equity at exit
- $156,744
Cash invested: $36,372 (down + closing). Projections, not guarantees.
Landlord ↔ Tenant lean methodology
- Overall (STATE)
- 87 Strongly Landlord-Friendly
- State Texas
- 87 Strongly Landlord-Friendly · R+5
- County
- — inherits STATE
- City
- — inherits STATE
ZIP-level market 79567
- Home prices YoY
- 4.7%
- Active inventory
- 30
- Price-to-rent
- 9.0×
Monthly cashflow live
- Estimated rent
- $1,202 medium interval (Pro) →
- Mortgage (P&I)
- −$681
- Tax from tax record
- −$175 /mo · $2,097/yr
- Insurance
- −$54
- HOA
- −$0
- Vacancy / Maint / Mgmt
- −$252
- Net cashflow
- $39
Break-even live
UW: 25.0% down · 7.5% · 30yr · 1.5% tax · 5.0% vac · 8.0% maint · 8.0% mgmt
Financing live
Cash to close
- Down payment
- $32,475
- Closing costs
- $3,897
- Reserves months
- —
- Total cash needed
- —
Loan-product check · same deal, 3 products live
Conventional
25% down · 7.5% · 30yr
- Down + closing
- —
- Monthly P&I
- —
- Monthly cashflow
- —
- DSCR
- —
- Eligible?
- —
Personal DTI + credit; lowest rate.
DSCR
20% down · 8.5% · 30yr
- Down + closing
- —
- Monthly P&I
- —
- Monthly cashflow
- —
- DSCR
- —
- Eligible?
- —
No personal income docs; deal must DSCR.
Hard money
10% down · 12.0% · 12mo
- Down + closing
- —
- Monthly P&I
- —
- Monthly cashflow
- —
- DSCR
- —
- Eligible?
- —
Short-term bridge; refi at stabilization.
Listing history 19 events
-
2026-06-18days on market $129,900 Active 219 DOM
-
2026-06-17days on market $129,900 Active 218 DOM
-
2026-06-16days on market $129,900 Active 217 DOM
-
2026-06-15days on market $129,900 Active 216 DOM
-
2026-06-15days on market $129,900 Active 215 DOM
-
2026-06-13days on market $129,900 Active 214 DOM
-
2026-06-12days on market $129,900 Active 213 DOM
-
2026-06-09days on market $129,900 Active 210 DOM
-
2026-06-08days on market $129,900 Active 209 DOM
-
2026-06-08days on market $129,900 Active 208 DOM
-
2026-06-07days on market $129,900 Active 207 DOM
-
2026-06-03days on market $129,900 Active 204 DOM
-
2026-06-02days on market $129,900 Active 203 DOM
-
2026-06-01days on market $129,900 Active 202 DOM
-
2026-05-31days on market $129,900 Active 201 DOM
-
2025-11-12$129,900 Active 592-char remark
Show marketing remark (592 chars)
Check out this 3/2 with Large den/ gameroom! the kitchen has oversized eat-at island and is an open concept with plenty of custom cabinetry. Original hardwoods grace the living room and bedrooms. Bedrooms have good closets. There is a full bath and a half bath. The half bath is plumbed to be a full bath. In the rear of the home is the large sunken den with retro fireplace that opens to the backyard and patio. Perfect for entertaining! Back yard has an ample sized shop/storage and newer privacy fence. This one is just waiting for it's next owner to love it and breathe life back into it!
-
2022-05-20soldstatus
-
2008-05-20soldstatus
-
2004-05-11soldstatus
ⓘ Source: listings_history table (triggers on properties + properties_extension) + one-shot
backfill from property_details.listing_events for pre-trigger history.
Tax reassessment forecast TX · Resets to sale price
- Current annual tax
- $2,097 · $175/mo
- Projected year-2 tax
- $2,377 · $198/mo
- Expected delta
- +$280/yr (+$23/mo · 13.4%)
ⓘ Screening estimate from a state-policy table — verify with the county assessor before closing.
Nearby sold comps map
Loading sold comps map…
Walkable amenities ~0.75 mi
Loading nearby amenities…
Taxation est. · year 1
- Rental income
- $14,424
- − Mortgage interest
- −$7,276
- − Property taxes
- −$2,097
- − Insurance
- −$650
- − Repairs & maintenance
- −$1,154
- − Management
- −$1,154
- − Depreciation
- −$3,779
- Taxable loss
- −$1,686
- Est. tax savings @ 24.0%
- +$405
- After-tax cash flow
- $878/yr
For passive investors: Depreciation is non-cash, so a rental often shows a tax loss while cash-flowing — sheltering income. Rental losses are passive: they offset passive income freely, and up to $25,000/yr can offset ordinary (W-2) income if you actively participate and your MAGI is under $100k (phasing out to $0 by $150k); unused losses carry forward. On sale, claimed depreciation is recaptured at up to 25%, and gains may owe capital-gains tax (a 1031 exchange can defer both). Figures are a year-1 estimate at your 24.0% rate — not tax advice; consult a CPA.
Schools (NCES district)
- District
- Winters ISD
- NCES district ID
- 4846260
- Math proficiency
- 31% ▼ -6.00%
- Reading proficiency
- 31% ▼ -4.00%
- Median HH income
- $39,510
- Composite
- 26.04/100
- National rank
- #7304
- State rank
- #616 of 826 in TX
Livability — Winters
- Score
- 72/100
- State rank
- #271
- US rank
- #6348
Category grades
Schools grade is shown separately in the Schools card above.
Census & demographics
- Census place
- Winters, TX
- Population (ZIP)
- 2,924
Population outlook (Runnels County) Hauer SSP2
- Today (2025)
- 10,754 people
- By 2030
- 10,843 · +0.8%
- By 2040
- 10,946 · +1.8%
- By 2050
- 10,981 · +2.1%
- By 2075
- 11,103 · +3.2%
- By 2100
- 10,051 · -6.5%
Race, ethnicity, and origin ACS 2023
- Neighborhood character
- Majority White (55%)
- Race & ethnicity
- White 55% Hispanic / Latino 39% Two or more races 24% Black 2%
- Hispanic origin (detail)
- Mexican 31%
- Common ancestry
- Italian 8% Slovak 2% Iranian 1%
- Foreign-born
- 5% · Canada
- Languages at home
- 73% English-only · Spanish 27%
Political lean MEDSL · Runnels
- 2024 margin
- Solid R (+77.1) · D 11.1% · R 88.3%
- 2008→2024 swing
- -15.1pp toward R · 2008: -62.0pp · 2024: -77.1pp
- All cycles
- 2024: R+77.1 2020: R+73.8 2016: R+74.1 2012: R+70.6 2008: R+62.0
Not yet ingested
- Civics
- —
Market trends
- HPI YoY
- ▲ 6.39%
- Current HPI
- 143.6466
- Rent YoY
- —
- Metro
- —
- State GDP YoY
- ▲ 3.95%
- F500 in state
- 110
Industry mix (Fortune 500 HQ in TX)
| Industry | F500 HQs | Revenue |
|---|---|---|
| Energy | 16 | $1,198B |
|
||
| Technology | 5 | $198B |
|
||
| Engineering / Construction | 4 | $72B |
|
||
| Energy Services | 3 | $60B |
|
||
| Utilities | 3 | $41B |
|
||
| Healthcare | 2 | $330B |
|
||
Price history
4 events — show timeline
- 2025-11-12 Listed $129,900 SAAR TX
- 2022-05-20 Sold (Public Records) — Public Records
- 2008-05-20 Sold (Public Records) — Public Records
- 2004-05-11 Sold (Public Records) — Public Records
Property tax history
+5.1%/yrLatest (2025): $2,097 · +29.1% YoY. Source: county tax records.
Cash-flow waterfall
monthlySold comps — $/sqft
last 12 mo · ≤1 miLoading sold comps…