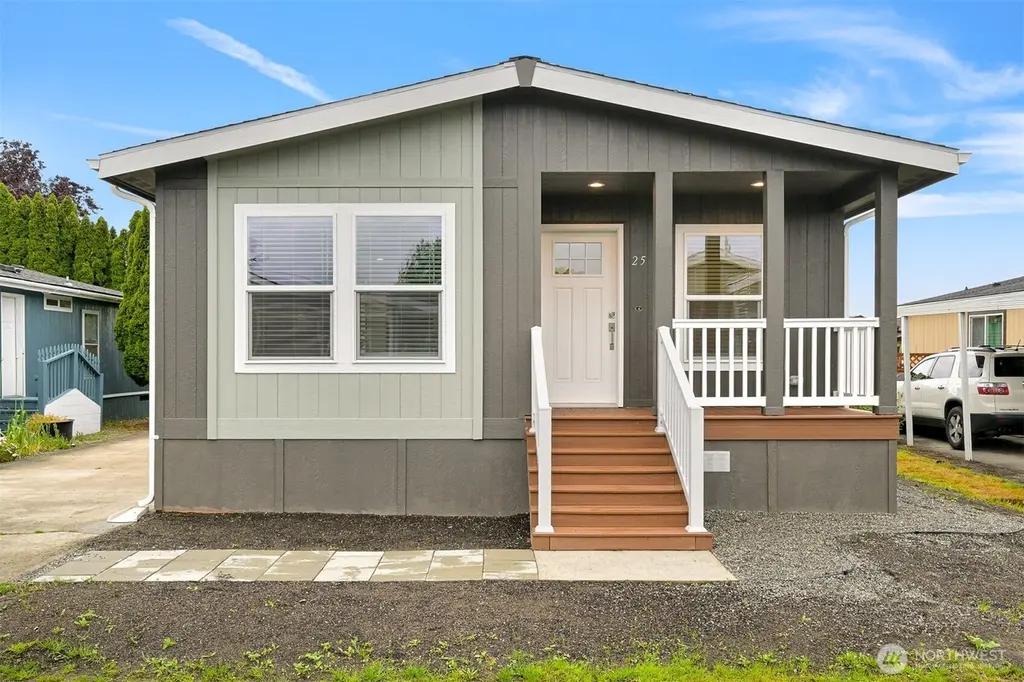
1120 S 25th St #25 · Mount Vernon, WA
Flood risk 1/10 · Minimal
- FEMA flood zone
- X
- Chance of flooding over 30 yrs
- 0.0%
- Est. flood insurance / yr
- $507 – $1,088
Fire risk 3/10 · Minor
- Est. fire insurance / yr
- $604 – $1,122
Heat risk 2/10 · Minimal
- Hot days now (above 81°F)
- 8 days/yr
- Hot days in 30 yrs
- 21 days/yr
Wind risk 1/10 · Minimal
- Chance of severe wind over 30 yrs
- —
Air-quality risk 5/10 · Moderate
- Unhealthy air days now
- 7 days/yr
- Unhealthy air days in 30 yrs
- 7 days/yr
Risk factors via First Street. Map © Google.
Why this score? — see what drove the C+ grade
The composite is a weighted blend of 9 inputs, each scored 0–100. Each bar is that input's sub-score; the figure is the points it added to the 100-point composite (weight × sub-score).
- Cash flow +28.3/30.0
- DSCR +10.0/10.0
- 1% rule +7.8/10.0
- Condition / age +4.8/5.0
- Schools +4.0/10.0
- Livability +4.0/5.0
- Rent growth +2.5/5.0
- ARV discount +1.7/15.0
- Appreciation +0.0/10.0
$187,200
🖨 Deal sheet 📄 Offer letter ✓ Due diligence
Listing remarks
Nestled in the highly sought-after, all-age community at Viewmont Mobile Estates, this beautiful new Marlette home offers modern comfort. The spacious, light-filled layout features 3 bedrooms and 2 bathrooms, highlighted by an open contemporary design. The primary suite includes a generous walk-in closet and a private en suite with dual sinks for added convenience. The stunning kitchen stands out with its large island, elegant tile backsplash, and abundant hardwood cabinetry, complemented by brand-new appliances throughout. Step outside to a yard to create a garden or design a cozy patio area. A prime location close to shopping, schools, parks, and easy freeway access, this residence delive
Key facts
- Private en suite
- Walk-in closet
- Large island
Tags
Property features AI
Finance
- Other: Calculated living area: 1,176; MLS square footage source: Floor plan
- Financial info: Acceptable financing: Cash, Conventional, FHA
- HOA & community: Land lease: $1,100
Exterior
- Utilities: Public water (Skagit PUD); Sewer provided by City of Mount Vernon; Power by PSE; Electric
- Home design: Manufactured double-wide home (Marlette model 55TPO24523PH26); One level
- Construction: Composition roof; Manufactured after 06/15/1976; Manufactured house, double wide
- Exterior features: Located in Viewmont Mobile Estates (mobile home park approved for sale)
Interior
- Kitchen: Dishwasher; Garbage disposal; Refrigerator; Stove/Range
- Bedrooms: 3 bedrooms
- Flooring: Vinyl
- Bathrooms: 1 full bathroom; 1 three-quarter bathroom
- Heating & cooling: Forced air heating; Electric energy source
- Interior features: Dishwasher; Garbage disposal; Refrigerator; Stove/Range; Vinyl flooring; Double pane windows; Walk-in closet; Forced air heating
- Laundry & utility: Utility room
Neighborhood map
What this means for you Summary
Snapshot
- This is a 3-bed/2.0-bath manufactured listed at $187k. Condition is rated excellent.
Deal economics
- At list price, monthly cash flow is $601 ($7k/yr) — positive.
- The deal already cash-flows at list — no discount required.
- Meets the 1% rule at list price ($2k rent vs $187k).
- Cap rate 10.1% vs local median 2.4% in Mount Vernon — top-decile yield for the area; either an underpriced asset or a hidden risk that comps aren't pricing in. Stress-test before assuming the spread holds.
Location & tenants
- Location reads 79/100 on livability (#106 in WA, #2,120 nationally) — a middle-class / working-renter tenant base. Strengths: commute A+, housing A+, health & safety A+; Watch: cost of living D+.
- Mount Vernon School District (urban): math 41% / reading 47% proficiency, ranked #189 of 291 in WA (top 65%) — families likely to look elsewhere, expect single-tenant / working-renter base with shorter leases.
- Market conditions: 171 active listings in the ZIP; 10 comparable units currently listed for rent nearby; rentals lingering (median 44d on market — plan ~5-8 weeks vacancy on turnover, expect pricing pressure); 70% of comp listings sitting > 30 days — soft ceiling on asking rent; solid renter incomes; 561 units permitted in Skagit County in 2024 (270 in 5+ unit buildings).
Forward outlook
- Local home prices are declining (-3.0%/yr); year-one equity from $1k of loan paydown is wiped out by about $6k of value loss. Plan a longer hold.
- Skagit County population projected at +11% by 2050 — modest demand growth; plan on rents tracking national, not racing it.
- At projected returns (-3.0% appreciation + 3.0% rent growth), your $52k cash investment doubles in ~9 years — after that, you're playing with house money.
Negotiation context
- Only 7 days on market — expect competitive offers; lowballing is unlikely to land.
Questions for the listing agent
- Is there a deadline driving the sale (1031 exchange, divorce, estate, relocation)? That informs how much negotiation room exists.
- What's the average days-on-market for RENTAL listings here right now (not sales)? A rising rental-DOM trend means longer vacancies and softer asking-rent achievability than the comps imply.
- What's the recent tenant-quality profile in this submarket — average credit score on applications, eviction rate, late-payment / NSF rate, and stable-employment percentage? A property-management company in the area should have these aggregated.
- How much new for-sale + rental construction is in the pipeline within 1–3 miles? Heavy new supply typically softens prices + rents 12–24 months out; constrained supply supports both.
Investment metrics
- 1% rule
- 1.28% ✓
- Cap rate
- 10.14%
- Cash-on-cash
- 13.75%
- DSCR
- 1.61
- GRM
- 6.5
CMA / ARV
- ARV (on-the-fly)
- $165,816
- Comps found
- 10
Show comp detail 10 sales within ~0.75 mi
| Address | Dist | Beds/Ba | Sqft | Sold | Price | $/sf | Match |
|---|---|---|---|---|---|---|---|
| 1120 S 25th St #27 | 0.01mi | 3/2.0 | 1,296 (+10%) | 8mo | $167,999 | $130 | 76 |
| 224 Widnor Dr | 0.37mi | 2/2.0 (-1) | 1,162 (-1%) | 9mo | $359,900 | $310 | 68 |
| 1120 S 25th St #33 | 0.01mi | 3/2.0 | 1,296 (+10%) | 20mo | $168,000 | $130 | 66 |
| 1120 S 25th St #26 | 0.01mi | 3/2.0 | 1,339 (+14%) | 17mo | $159,000 | $119 | 62 |
| 2610 E Section St #2 | 0.30mi | 2/2.0 (-1) | 1,136 (-3%) | 20mo | $160,000 | $141 | 59 |
| 2610 E Section St #80 | 0.46mi | 2/2.0 (-1) | 1,160 (-1%) | 19mo | $150,000 | $129 | 55 |
| 2610 E Section St #15 | 0.46mi | 3/2.0 | 1,296 (+10%) | 15mo | $242,500 | $187 | 49 |
| 2610 E Section St #7 | 0.47mi | 2/2.0 (-1) | 1,058 (-10%) | 14mo | $215,000 | $203 | 44 |
| 2610 E Section St #17 | 0.47mi | 2/2.0 (-1) | 1,265 (+8%) | 21mo | $176,900 | $140 | 43 |
| 319 Widnor Dr | 0.35mi | 3/2.0 | 1,344 (+14%) | 24mo | $390,000 | $290 | 40 |
Match score weights: distance 35% · size 25% · config 20% · recency 20%. Top-matched comps best support the ARV.
Projected returns pro-forma
-3.0% appreciation · 3.0% rent growth · sell at horizon
- IRR
- 3.9%
- Equity multiple
- 1.15×
- Total profit
- $7,960
- Equity at exit
- $27,912
- IRR
- 13.5%
- Equity multiple
- 2.07×
- Total profit
- $56,341
- Equity at exit
- $16,186
Cash invested: $52,416 (down + closing). Projections, not guarantees.
Landlord ↔ Tenant lean methodology
- Overall (STATE)
- 28 Tenant-Leaning
- State Washington
- 28 Tenant-Leaning · D+8
- County
- — inherits STATE
- City
- — inherits STATE
ZIP-level market 98274
- Active inventory
- 171
- Price-to-rent
- 6.5×
Monthly cashflow live
- Estimated rent
- $2,398 high interval (Pro) →
- Mortgage (P&I)
- −$982
- Tax est. 1.5%
- −$234 /mo · $2,808/yr
- Insurance
- −$78
- HOA
- −$0
- Vacancy / Maint / Mgmt
- −$504
- Net cashflow
- $601
Break-even live
UW: 25.0% down · 7.5% · 30yr · 1.5% tax · 5.0% vac · 8.0% maint · 8.0% mgmt
Financing live
Cash to close
- Down payment
- $46,800
- Closing costs
- $5,616
- Reserves months
- —
- Total cash needed
- —
Loan-product check · same deal, 3 products live
Conventional
25% down · 7.5% · 30yr
- Down + closing
- —
- Monthly P&I
- —
- Monthly cashflow
- —
- DSCR
- —
- Eligible?
- —
Personal DTI + credit; lowest rate.
DSCR
20% down · 8.5% · 30yr
- Down + closing
- —
- Monthly P&I
- —
- Monthly cashflow
- —
- DSCR
- —
- Eligible?
- —
No personal income docs; deal must DSCR.
Hard money
10% down · 12.0% · 12mo
- Down + closing
- —
- Monthly P&I
- —
- Monthly cashflow
- —
- DSCR
- —
- Eligible?
- —
Short-term bridge; refi at stabilization.
Rent comps 10 comps
| Address | Beds | Baths | Sqft | Rent | $/sqft | DOM | Units | Dist |
|---|---|---|---|---|---|---|---|---|
| 119 N 29th Pl Mount Vernon, WA | 3.0 | 1.0 | 1098 | $2,700 | $2.46 | 43d | 1 | 0.52mi |
| 130 Stanford Dr Unit C Mount Vernon, WA | 2.0 | 1.0 | 800 | $1,595 | $1.99 | 43d | 1 | 0.58mi |
| 1511 Shirley Pl Mount Vernon, WA | 2.0 | 1.0 | 936 | $2,250 | $2.40 | 43d | 1 | 0.63mi |
| 1002 S 12th St Mount Vernon, WA | 2.0 | 1.0 | 1052 | $2,575 | $2.45 | 20d | 1 | 0.79mi |
| 1221 S 12th St Mount Vernon, WA | 2.0 | 1.0 | 833 | $2,195 | $2.64 | 43d | 1 | 0.83mi |
| 1115 Nylin Ct Mount Vernon, WA | 3.0 | 1.0 | 1032 | $2,500 | $2.42 | 43d | 1 | 1.15mi |
| 1521 N 26th St Mount Vernon, WA | 1.0–3.0 | 1.0 | 807 | $1,995 | $2.47 | 20d | 8 | 1.33mi |
| 1516 N 19th St Mount Vernon, WA | 2.0 | 1.0 | 850 | $1,795 | $2.11 | 20d | 1 | 1.45mi |
| 115 E Cedar St Mount Vernon, WA | 2.0 | 1.0 | 850 | $1,600 | $1.88 | 43d | 1 | 1.47mi |
| 3316 E College Way Unit A Mount Vernon, WA | 3.0 | 1.0 | 916 | $2,000 | $2.18 | 43d | 1 | 1.50mi |
Listing history 7 events
-
2026-06-19days on market $187,200 Active 7 DOM
-
2026-06-18days on market $187,200 Active 6 DOM
-
2026-06-17days on market $187,200 Active 5 DOM
-
2026-06-16days on market $187,200 Active 4 DOM
-
2026-06-15days on market $187,200 Active 3 DOM
-
2026-06-13remarks 699-char remark
-
2026-06-13$187,200 Active 1 DOM
ⓘ Source: listings_history table (triggers on properties + properties_extension) + one-shot
backfill from property_details.listing_events for pre-trigger history.
Climate risk First Street
- Flood 1/10 Low FEMA zone X · 0% chance over 30 yrs
- Wildfire 3/10 Moderate
- Heat 2/10 Low 8 d/yr ≥81°F today · 21 d/yr by 30 yrs out
- Wind 1/10 Low
- Air quality 5/10 Major 7 unhealthy d/yr today · 7 by 30 yrs out
Nearby sold comps map
Loading sold comps map…
Walkable amenities ~0.75 mi
Loading nearby amenities…
Taxation est. · year 1
- Rental income
- $28,775
- − Mortgage interest
- −$10,486
- − Property taxes
- −$2,808
- − Insurance
- −$936
- − Repairs & maintenance
- −$2,302
- − Management
- −$2,302
- − Depreciation
- −$5,446
- Taxable income
- $4,495
- Est. tax owed @ 24.0%
- −$1,079
- After-tax cash flow
- $6,129/yr
For passive investors: Depreciation is non-cash, so a rental often shows a tax loss while cash-flowing — sheltering income. Rental losses are passive: they offset passive income freely, and up to $25,000/yr can offset ordinary (W-2) income if you actively participate and your MAGI is under $100k (phasing out to $0 by $150k); unused losses carry forward. On sale, claimed depreciation is recaptured at up to 25%, and gains may owe capital-gains tax (a 1031 exchange can defer both). Figures are a year-1 estimate at your 24.0% rate — not tax advice; consult a CPA.
Condition & rehab AI · 13 photos
This home is in excellent condition with modern finishes and a well-maintained exterior. It is move-in ready and would benefit from a fresh coat of paint and landscaping improvements to further enhance its appeal.
Value-add opportunities
- Both Painting the exterior and interior walls — Fresh paint can enhance the curb appeal and interior aesthetics, making the home more attractive to potential buyers and renters.
- Both Landscaping improvements — Enhancing the landscaping can increase the home's curb appeal and make it more inviting for potential buyers and renters.
Renovation cost estimate screening
Value-add ROI direction
- Both Painting the exterior and interior walls — Fresh paint can enhance the curb appeal and interior aesthetics, making the home more attractive to potential buyers and renters. ↑
- Both Landscaping improvements — Enhancing the landscaping can increase the home's curb appeal and make it more inviting for potential buyers and renters. ↑
ⓘ Cost ranges are severity-bucket heuristics (US national rule-of-thumb). Get contractor quotes + a written scope before underwriting a rehab budget.
Schools (NCES district)
- District
- Mount Vernon School District
- NCES district ID
- 5305400
- Math proficiency
- 41% ▼ -1.00%
- Reading proficiency
- 47% ▲ 1.00%
- Median HH income
- $50,829
- Composite
- 40.14/100
- National rank
- #7848
- State rank
- #189 of 291 in WA
Livability — Mount Vernon
- Score
- 79/100
- State rank
- #106
- US rank
- #2120
Category grades
Schools grade is shown separately in the Schools card above.
Census & demographics
- Census place
- Mount Vernon, WA
- County
- Skagit County · 118,108 people
- City population
- 48,861
- Metro
- Mount Vernon-Anacortes, WA
- Population (ZIP)
- 18,860
- Household income
- $96,177
- Rent vs Own
- Severe rent burden
- 412.0
Population outlook (Skagit County) Hauer SSP2
- Today (2025)
- 131,498 people
- By 2030
- 135,556 · +3.1%
- By 2040
- 141,717 · +7.8%
- By 2050
- 145,714 · +10.8%
- By 2075
- 152,201 · +15.7%
- By 2100
- 147,980 · +12.5%
Race, ethnicity, and origin ACS 2023
- Neighborhood character
- Majority White (64%)
- Race & ethnicity
- White 64% Hispanic / Latino 24% Two or more races 10% Asian 3% Native American 1% Black 1%
- Hispanic origin (detail)
- Mexican 21%
- Common ancestry
- Portuguese 7% Italian 5% Iranian 2%
- Foreign-born
- 13% · Canada, Vietnam, China
- Languages at home
- 78% English-only · Spanish 16% Russian/Polish/Slavic 1% Tagalog/Filipino 1%
Political lean MEDSL · Skagit
- 2024 margin
- Lean D (+8.9) · D 52.9% · R 44.0% · Other 3.0%
- 2008→2024 swing
- -0.7pp no change · 2008: 9.6pp · 2024: 8.9pp
- All cycles
- 2024: D+8.9 2020: D+7.5 2016: D+3.2 2012: D+5.8 2008: D+9.6
Not yet ingested
- Civics
- —
Market trends
- HPI YoY
- ▼ -587.88%
- Current HPI
- 363.1257
- Rent YoY
- —
- Metro
- Mount Vernon-Anacortes, WA
- State GDP YoY
- ▲ 4.65%
- F500 in state
- 22
Industry mix (Fortune 500 HQ in WA)
| Industry | F500 HQs | Revenue |
|---|---|---|
| Retail | 2 | $269B |
|
||
| Technology / Retail | 1 | $638B |
|
||
| Technology | 1 | $245B |
|
||
| Telecommunications | 1 | $38B |
|
||
| Food / Beverage | 1 | $36B |
|
||
| Automotive / Trucks | 1 | $34B |
|
||
Price history
1 event — show timeline
- 2026-06-12 Listed $187,200 NWMLS as Distributed by MLS Grid
Cash-flow waterfall
monthlySold comps — $/sqft
last 12 mo · ≤1 miLoading sold comps…