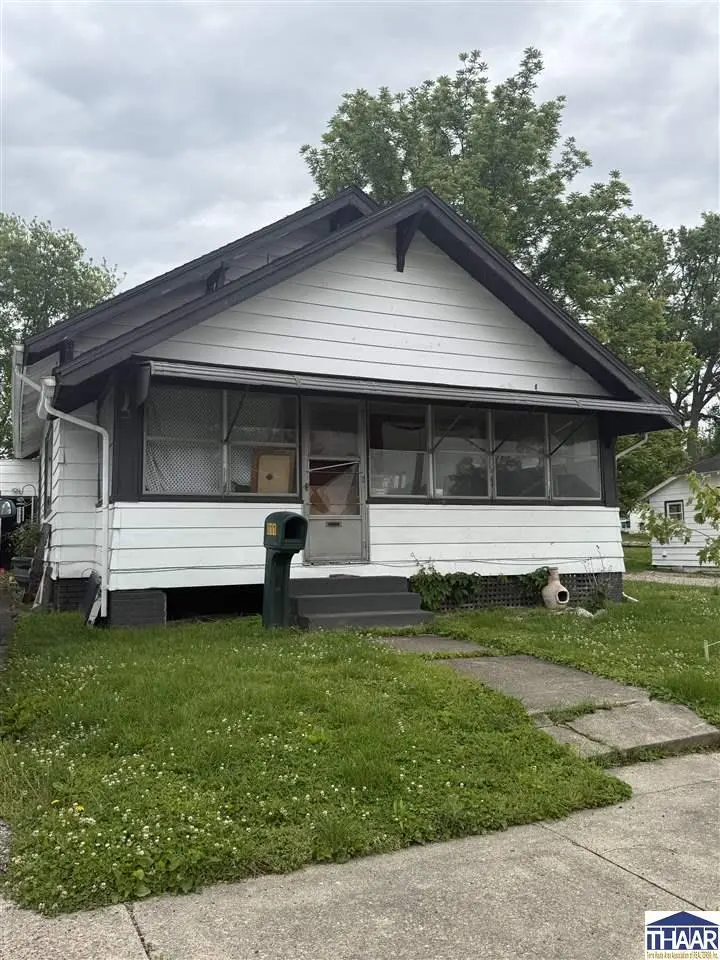
311 S Section St · Sullivan, IN
Flood risk 1/10 · Minimal
- FEMA flood zone
- —
- Chance of flooding over 30 yrs
- 0.0%
- Est. flood insurance / yr
- —
Fire risk 1/10 · Minimal
- Est. fire insurance / yr
- $717 – $1,331
Heat risk 4/10 · Minor
- Hot days now (above 105°F)
- 7 days/yr
- Hot days in 30 yrs
- 19 days/yr
Wind risk 2/10 · Minimal
- Chance of severe wind over 30 yrs
- 2.0%
Air-quality risk 2/10 · Minimal
- Unhealthy air days now
- 1 days/yr
- Unhealthy air days in 30 yrs
- 2 days/yr
Risk factors via First Street. Map © Google.
Why this score? — see what drove the B- grade
The composite is a weighted blend of 9 inputs, each scored 0–100. Each bar is that input's sub-score; the figure is the points it added to the 100-point composite (weight × sub-score).
- Cash flow +30.0/30.0
- 1% rule +10.0/10.0
- DSCR +10.0/10.0
- ARV discount +7.5/15.0
- Schools +3.5/10.0
- Livability +3.5/5.0
- Rent growth +2.5/5.0
- Condition / age +2.5/5.0
- Appreciation +0.0/10.0
$50,000
🖨 Deal sheet 📄 Offer letter ✓ Due diligence
Listing remarks
A Great Opportunity to Make It Your Own You’ve been looking for a home with potential, character, and a location that makes sense—and this one is full of opportunity. This 2-bedroom, 1-bath home offers a comfortable layout and an enclosed front porch, giving you extra space to relax, unwind, or create a cozy sitting area. While the home needs a little TLC, it gives you the chance to add your own style and build equity along the way. Whether you’re a first-time buyer, investor, or someone looking for a project with promise, this property is worth a look. Located in a good location, you’ll enjoy convenience and the potential to create something truly special. This isn
Key facts
- Comfortable layout
- Enclosed front porch
- 0.48 acre lot
Tags
Property features AI
Exterior
- Parking: Gravel parking
- Utilities: Public sewer
- Home design: Single-family residence; Single story
- Construction: Metal siding; Shingle roof
- Exterior features: Front porch; Shed(s)
Interior
- Bathrooms: One full bathroom
- Heating & cooling: Central air conditioning; Natural gas heating
- Interior features: Crawl space basement
Neighborhood map
What this means for you Summary
Snapshot
- This is a 3-bed/1.5-bath single-family listed at $50k.
Deal economics
- At list price, monthly cash flow is $413 ($5k/yr) — positive.
- The deal already cash-flows at list — no discount required.
- Meets the 1% rule at list price ($995 rent vs $50k).
- Recommended offer: $48k (3.0% below list) — sets the bar for market timing.
- Cap rate 16.2% vs local median 4.5% in Sullivan — top-decile yield for the area; either an underpriced asset or a hidden risk that comps aren't pricing in. Stress-test before assuming the spread holds.
Location & tenants
- Location reads 70/100 on livability (#167 in IN) — a middle-class / working-renter tenant base. Strengths: cost of living A+, housing A+, health & safety A+; Watch: amenities F, commute F, employment D-.
- Southwest School Corporation (rural): math 40% / reading 42% proficiency, ranked #137 of 301 in IN (top 46%) — families likely to look elsewhere, expect single-tenant / working-renter base with shorter leases.
- Zoned schools: Sullivan Elementary School (math 43% / reading 40%, grade F, #478 of 994 statewide, top 49%, 663 students, 50% FRL); Sullivan Middle School (math 39% / reading 45%, grade D-, #102 of 330 statewide, top 32%, 298 students, 49% FRL); Sullivan High School (math 32% / reading 52%, grade F, #197 of 369 statewide, top 57%, 499 students, 46% FRL).
- Market conditions: 79 active listings in the ZIP; 2 comparable units currently listed for rent nearby; 4 units permitted in Sullivan County in 2024 (0 in 5+ unit buildings).
Forward outlook
- Local home prices are declining (-3.0%/yr); year-one equity from $346 of loan paydown is wiped out by about $2k of value loss. Plan a longer hold.
- Sullivan County population projected at -12% by 2050 — secular population decline; favor cash flow + early exit over multi-decade hold.
- At projected returns (-3.0% appreciation + 3.0% rent growth), your $14k cash investment doubles in ~4 years — after that, you're playing with house money.
Negotiation context
- It's been on market 34 days — a 3% lower offer ($48k) is reasonable based on typical stale-listing flexibility.
- 3 sale attempts since 4y ago; this cycle's ask has dropped $25k (33%) from the opening price — seller is motivated, your offer sets the floor, not the list.
- Current owner paid $25k; list at $50k implies a 100% gain — meaningful room to come down on a strong offer.
Risks & watch-outs
- Watch-outs: built in 1920 — expect roof / HVAC / electrical / plumbing capex.
Questions for the listing agent
- It's been on market 34 days. Have you received any prior offers? Is the seller open to a 3% concession, seller financing, or rate buy-down credit?
- Built in 1920 — when were the roof, HVAC, electrical panel, plumbing, and water heater last replaced?
- Is there a deadline driving the sale (1031 exchange, divorce, estate, relocation)? That informs how much negotiation room exists.
- Schools are D-rated, which usually means shorter tenancies and higher turnover. Who's the typical renter profile here, and what's been the actual vacancy rate?
- What's the average days-on-market for RENTAL listings here right now (not sales)? A rising rental-DOM trend means longer vacancies and softer asking-rent achievability than the comps imply.
- What's the recent tenant-quality profile in this submarket — average credit score on applications, eviction rate, late-payment / NSF rate, and stable-employment percentage? A property-management company in the area should have these aggregated.
- How much new for-sale + rental construction is in the pipeline within 1–3 miles? Heavy new supply typically softens prices + rents 12–24 months out; constrained supply supports both.
Investment metrics
- 1% rule
- 1.99% ✓
- Cap rate
- 16.20%
- Cash-on-cash
- 35.37%
- DSCR
- 2.57
- GRM
- 4.2
CMA / ARV
- ARV (median comp)
- $107,421
- List price
- $50,000
- Delta
- -53.45%
- Verdict
- UNDERPRICED
- Comps
- 20 within 1.0 mi
Show comp detail 12 sales within ~0.75 mi
| Address | Dist | Beds/Ba | Sqft | Sold | Price | $/sf | Match |
|---|---|---|---|---|---|---|---|
| 219 S Court St | 0.11mi | 2/1.0 (-1) | 1,224 (+0%) | 1mo | $139,000 | $114 | 86 |
| 221 S State St | 0.22mi | 2/2.0 (-1) | 1,197 (-2%) | 5mo | $157,500 | $132 | 76 |
| 321 E Wall St | 0.44mi | 3/2.0 | 1,232 (+1%) | 1mo | $230,400 | $187 | 75 |
| 314 E Washington St | 0.44mi | 3/2.0 | 1,232 (+1%) | 1mo | $230,499 | $187 | 75 |
| 316 E Washington St | 0.44mi | 3/2.0 | 1,176 (-4%) | 1mo | $219,899 | $187 | 70 |
| 312 E Washington St | 0.44mi | 3/2.0 | 1,161 (-5%) | 1mo | $215,500 | $186 | 69 |
| 323 E Wall St | 0.44mi | 3/2.0 | 1,161 (-5%) | 1mo | $215,123 | $185 | 69 |
| 562 S Court St St | 0.30mi | 2/1.0 (-1) | 1,288 (+6%) | 5mo | $135,000 | $105 | 66 |
| 419 S Bell St St | 0.27mi | 3/2.0 | 1,363 (+12%) | 3mo | $230,000 | $169 | 64 |
| 501 E Beech St | 0.66mi | 3/2.0 | 1,232 (+1%) | 7mo | $174,900 | $142 | 60 |
| 720 E Chaney St | 0.67mi | 3/2.0 | 1,248 (+2%) | 5mo | $175,000 | $140 | 59 |
| 202 E Depot St St | 0.69mi | 3/1.0 | 1,200 (-2%) | 7mo | $119,900 | $100 | 58 |
Match score weights: distance 35% · size 25% · config 20% · recency 20%. Top-matched comps best support the ARV.
Projected returns pro-forma
-3.0% appreciation · 3.0% rent growth · sell at horizon
- IRR
- 31.0%
- Equity multiple
- 2.30×
- Total profit
- $18,214
- Equity at exit
- $7,455
- IRR
- 38.2%
- Equity multiple
- 4.56×
- Total profit
- $49,835
- Equity at exit
- $4,323
Cash invested: $14,000 (down + closing). Projections, not guarantees.
Landlord ↔ Tenant lean methodology
- Overall (STATE)
- 90 Strongly Landlord-Friendly
- State Indiana
- 90 Strongly Landlord-Friendly · R+11
- County
- — inherits STATE
- City
- — inherits STATE
ZIP-level market 47882
- Home prices YoY
- -11.1%
- Active inventory
- 79
- Price-to-rent
- 4.2×
Monthly cashflow live
- Estimated rent
- $995 medium interval (Pro) →
- Mortgage (P&I)
- −$262
- Tax from tax record
- −$90 /mo · $1,084/yr
- Insurance
- −$21
- HOA
- −$0
- Vacancy / Maint / Mgmt
- −$209
- Net cashflow
- $413
Break-even live
UW: 25.0% down · 7.5% · 30yr · 1.5% tax · 5.0% vac · 8.0% maint · 8.0% mgmt
Financing live
Cash to close
- Down payment
- $12,500
- Closing costs
- $1,500
- Reserves months
- —
- Total cash needed
- —
Loan-product check · same deal, 3 products live
Conventional
25% down · 7.5% · 30yr
- Down + closing
- —
- Monthly P&I
- —
- Monthly cashflow
- —
- DSCR
- —
- Eligible?
- —
Personal DTI + credit; lowest rate.
DSCR
20% down · 8.5% · 30yr
- Down + closing
- —
- Monthly P&I
- —
- Monthly cashflow
- —
- DSCR
- —
- Eligible?
- —
No personal income docs; deal must DSCR.
Hard money
10% down · 12.0% · 12mo
- Down + closing
- —
- Monthly P&I
- —
- Monthly cashflow
- —
- DSCR
- —
- Eligible?
- —
Short-term bridge; refi at stabilization.
Rent comps 2 comps
| Address | Beds | Baths | Sqft | Rent | $/sqft | DOM | Units | Dist |
|---|---|---|---|---|---|---|---|---|
| 564 S Court St Sullivan, IN | 2.0 | 1.0 | 978 | $995 | $1.02 | 14d | 1 | 0.28mi |
| 564 S Court St Sullivan, IN | 2.0 | 1.0 | 978 | $995 | $1.02 | 12d | 1 | 0.28mi |
Listing history 28 events
-
2026-06-18days on market $50,000 Active 34 DOM
-
2026-06-17days on market $50,000 Active 33 DOM
-
2026-06-16days on market $50,000 Active 32 DOM
-
2026-06-15days on market $50,000 Active 31 DOM
-
2026-06-13days on market $50,000 Active 29 DOM
-
2026-06-12days on market $50,000 Active 28 DOM
-
2026-06-09days on market $50,000 Active 25 DOM
-
2026-06-08days on market $50,000 Active 24 DOM
-
2026-06-07days on market $50,000 Active 23 DOM
-
2026-06-07pricedays on market $50,000 Active 22 DOM
-
2026-06-04days on market $75,000 Active 19 DOM
-
2026-06-02days on market $75,000 Active 18 DOM
-
2026-06-01days on market $75,000 Active 17 DOM
-
2026-05-31days on market $75,000 Active 16 DOM
-
2026-05-31days on market $75,000 Active 15 DOM
-
2026-05-14$75,000 Active 779-char remark
-
2026-03-31historical
-
2026-01-11price $60,000
-
2025-11-12price $80,500
-
2025-08-30price $81,500
-
2025-07-31historical
-
2025-03-31historical
-
2025-02-14price $85,900
-
2025-01-31price $90,900
-
2024-12-31historical
-
2024-04-04$70,000 Active
-
2022-04-26soldstatus $25,000
-
2022-02-17$40,000
ⓘ Source: listings_history table (triggers on properties + properties_extension) + one-shot
backfill from property_details.listing_events for pre-trigger history.
Tax reassessment forecast IN · Partial reset (capped growth)
- Current annual tax
- $1,084 · $90/mo
- Projected year-2 tax
- $1,084 · $90/mo
- Expected delta
- $0/yr ($0/mo · 0.0%)
ⓘ Screening estimate from a state-policy table — verify with the county assessor before closing.
Climate risk First Street
- Flood 1/10 Low 0% chance over 30 yrs
- Wildfire 1/10 Low
- Heat 4/10 Moderate 7 d/yr ≥105°F today · 19 d/yr by 30 yrs out
- Wind 2/10 Low 2% chance of damaging wind over 30 yrs
- Air quality 2/10 Low 1 unhealthy d/yr today · 2 by 30 yrs out
Nearby sold comps map
Loading sold comps map…
Walkable amenities ~0.75 mi
Loading nearby amenities…
Taxation est. · year 1
- Rental income
- $11,940
- − Mortgage interest
- −$2,801
- − Property taxes
- −$1,084
- − Insurance
- −$250
- − Repairs & maintenance
- −$955
- − Management
- −$955
- − Depreciation
- −$1,455
- Taxable income
- $4,440
- Est. tax owed @ 24.0%
- −$1,066
- After-tax cash flow
- $3,886/yr
For passive investors: Depreciation is non-cash, so a rental often shows a tax loss while cash-flowing — sheltering income. Rental losses are passive: they offset passive income freely, and up to $25,000/yr can offset ordinary (W-2) income if you actively participate and your MAGI is under $100k (phasing out to $0 by $150k); unused losses carry forward. On sale, claimed depreciation is recaptured at up to 25%, and gains may owe capital-gains tax (a 1031 exchange can defer both). Figures are a year-1 estimate at your 24.0% rate — not tax advice; consult a CPA.
Schools (NCES district)
- District
- Southwest School Corporation
- NCES district ID
- 1810860
- Math proficiency
- 40% ▼ -10.00%
- Reading proficiency
- 42% ▼ -9.00%
- Median HH income
- $43,624
- Composite
- 34.71/100
- National rank
- #5136
- State rank
- #137 of 301 in IN
Livability — Sullivan
- Score
- 70/100
- State rank
- #167
- US rank
- #7960
Category grades
Schools grade is shown separately in the Schools card above.
Census & demographics
- Census place
- Sullivan, IN
- City population
- 8,494
- Population (ZIP)
- 8,494
Population outlook (Sullivan County) Hauer SSP2
- Today (2025)
- 20,313 people
- By 2030
- 19,908 · -2.0%
- By 2040
- 19,009 · -6.4%
- By 2050
- 17,972 · -11.5%
- By 2075
- 14,929 · -26.5%
- By 2100
- 11,391 · -43.9%
Race, ethnicity, and origin ACS 2023
- Neighborhood character
- Predominantly White (95%)
- Race & ethnicity
- White 95% Two or more races 3%
- Common ancestry
- Italian 2% Slovak 2% Iranian 2%
- Foreign-born
- 1% · China
- Languages at home
- 99% English-only · Spanish 1%
Political lean MEDSL · Sullivan
- 2024 margin
- Solid R (+52.7) · D 22.8% · R 75.5% · Other 1.7%
- 2008→2024 swing
- -52.0pp toward R · 2008: -0.7pp · 2024: -52.7pp
- All cycles
- 2024: R+52.7 2020: R+50.5 2016: R+47.0 2012: R+20.6 2008: R+0.7
Not yet ingested
- Civics
- —
Market trends
- HPI YoY
- ▼ -23.79%
- Current HPI
- 190.5334
- Rent YoY
- —
- Metro
- —
- State GDP YoY
- ▲ 2.90%
- F500 in state
- 18
Industry mix (Fortune 500 HQ in IN)
| Industry | F500 HQs | Revenue |
|---|---|---|
| Industrial Machinery | 2 | $37B |
|
||
| Healthcare | 1 | $177B |
|
||
| Pharmaceuticals | 1 | $45B |
|
||
| Metals / Steel | 1 | $18B |
|
||
| Agriculture | 1 | $17B |
|
||
| Packaging | 1 | $12B |
|
||
Price history
+25.0% since first listed14 events — show timeline
- 2026-06-04 Price Changed $50,000 THAAR
- 2026-05-14 Listed $75,000 THAAR
- 2026-03-31 Listing Removed — MIBOR as Distributed by MLS Grid
- 2026-01-11 Price Changed $60,000 MIBOR as Distributed by MLS Grid
- 2025-11-12 Price Changed $80,500 MIBOR as Distributed by MLS Grid
- 2025-08-30 Price Changed $81,500 MIBOR as Distributed by MLS Grid
- 2025-07-31 Listing Removed — MIBOR as Distributed by MLS Grid
- 2025-03-31 Listing Removed — MIBOR as Distributed by MLS Grid
- 2025-02-14 Price Changed $85,900 MIBOR as Distributed by MLS Grid
- 2025-01-31 Price Changed $90,900 MIBOR as Distributed by MLS Grid
- 2024-12-31 Listing Removed — MIBOR as Distributed by MLS Grid
- 2024-04-04 Listed $70,000 MIBOR as Distributed by MLS Grid
- 2022-04-26 Sold (MLS) $25,000 THAAR
- 2022-02-17 Listed $40,000 THAAR
Property tax history
+1.4%/yrLatest (2024): $1,084 · +43.6% YoY. Source: county tax records.
Cash-flow waterfall
monthlySold comps — $/sqft
last 12 mo · ≤1 miLoading sold comps…