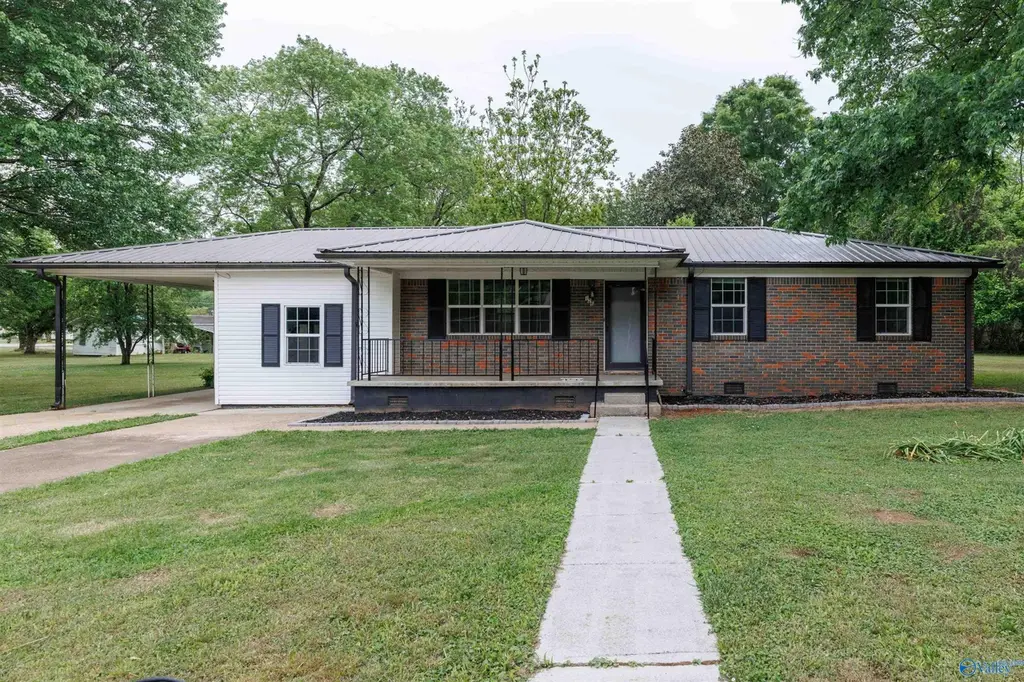
126 Helena Dr · Moores Mill, AL
Flood risk 1/10 · Minimal
- FEMA flood zone
- X (unshaded)
- Chance of flooding over 30 yrs
- 0.0%
- Est. flood insurance / yr
- $507 – $1,088
Fire risk 3/10 · Minor
- Est. fire insurance / yr
- $916 – $1,700
Heat risk 5/10 · Moderate
- Hot days now (above 105°F)
- 7 days/yr
- Hot days in 30 yrs
- 19 days/yr
Wind risk 4/10 · Minor
- Chance of severe wind over 30 yrs
- 17.0%
Air-quality risk 2/10 · Minimal
- Unhealthy air days now
- 1 days/yr
- Unhealthy air days in 30 yrs
- 2 days/yr
Risk factors via First Street. Map © Google.
Why this score? — see what drove the C grade
The composite is a weighted blend of 9 inputs, each scored 0–100. Each bar is that input's sub-score; the figure is the points it added to the 100-point composite (weight × sub-score).
- Cash flow +18.6/30.0
- ARV discount +13.8/15.0
- DSCR +5.9/10.0
- Rent growth +4.2/5.0
- 1% rule +4.0/10.0
- Schools +3.7/10.0
- Livability +3.3/5.0
- Condition / age +2.5/5.0
- Appreciation +1.4/10.0
$209,900
🖨 Deal sheet (PDF) 📄 Offer letter ✓ Due diligence
Listing remarks MLS
NEWLY REMODELED
Key facts
- New kitchen
- New bathroom
- Completely remodeled
Tags
Property features AI
Finance
- HOA & community: No association
Exterior
- Parking: Carport (1 space)
- Utilities: Septic tank sewer
- Home design: Single-family residence; One story; Built in 1963; Brick construction
- Construction: Brick construction; Built in 1963; Crawl space basement
- Exterior features: Deck
Interior
- Bathrooms: 1 full bathroom
- Heating & cooling: Central cooling (electric); Natural gas heating
- Interior features: Storm shelter
Neighborhood map
What this means for you Summary
Snapshot
- This is a 3-bed/1.0-bath single-family listed at $210k.
Deal economics
- At list price, monthly cash flow is $205 ($2k/yr) — positive.
- The deal already cash-flows at list — no discount required.
- To meet the 1% rule (rent ≥ 1% of price), the offer needs to be $188k (10.4% below list).
- Recommended offer: $188k (10.4% below list) — sets the bar for 1% rule.
- Cap rate 7.5% vs local median 3.8% in Moores Mill — top-decile yield for the area; either an underpriced asset or a hidden risk that comps aren't pricing in. Stress-test before assuming the spread holds.
Location & tenants
- Location reads 66/100 on livability (#109 in AL) — a middle-class / working-renter tenant base. Strengths: crime A+, employment A+, cost of living A+; Watch: amenities F, commute F, health & safety F.
- Madison County (rural): math 27% / reading 56% proficiency, ranked #19 of 129 in AL (top 15%) — families likely to look elsewhere, expect single-tenant / working-renter base with shorter leases.
- Zoned schools: Mt Carmel Elementary School (math 37% / reading 72%, grade C, #87 of 627 statewide, top 15%, 646 students, 34% FRL); Riverton Intermediate School (math 25% / reading 63%, grade D, #42 of 257 statewide, top 17%, 813 students, 36% FRL); Buckhorn High School (math 31% / reading 33%, grade F, #59 of 305 statewide, top 21%, 1,287 students, 34% FRL).
- Market conditions: Rents rising fast (+6.8%/yr); 560 active listings in the ZIP; 9 comparable units currently listed for rent nearby; rentals at typical pace (median 24d on market — plan ~3-4 weeks tenant-placement turnaround); 44% of comp listings sitting > 30 days — soft ceiling on asking rent; solid renter incomes; 4,709 units permitted in Madison County in 2024 (1,186 in 5+ unit buildings).
Forward outlook
- Local home prices are declining (-3.0%/yr); year-one equity from $1k of loan paydown is wiped out by about $6k of value loss. Plan a longer hold.
- Madison County population projected at +18% by 2050 — long-run rental-demand tailwind backs the buy-and-hold thesis.
Negotiation context
- It's been on market 55 days — a 3% lower offer ($204k) is reasonable based on typical stale-listing flexibility.
- 4 sale attempts since 6y ago with the ask held roughly flat each time — persistent listings suggest the price (not the market) is what's stuck; bring a comps-based counter.
Risks & watch-outs
- Climate carrying-cost: extreme-heat days projected 7→19/yr by 2055 (HVAC capex compounding) — expect insurance premiums to compound above CPI over the hold.
Questions for the listing agent
- It's been on market 55 days. Have you received any prior offers? Is the seller open to a 10% concession, seller financing, or rate buy-down credit?
- Built in 1963 — when were the roof, HVAC, electrical panel, plumbing, and water heater last replaced?
- Is there a deadline driving the sale (1031 exchange, divorce, estate, relocation)? That informs how much negotiation room exists.
- Schools are F-rated, which usually means shorter tenancies and higher turnover. Who's the typical renter profile here, and what's been the actual vacancy rate?
- What's the average days-on-market for RENTAL listings here right now (not sales)? A rising rental-DOM trend means longer vacancies and softer asking-rent achievability than the comps imply.
- What's the recent tenant-quality profile in this submarket — average credit score on applications, eviction rate, late-payment / NSF rate, and stable-employment percentage? A property-management company in the area should have these aggregated.
- How much new for-sale + rental construction is in the pipeline within 1–3 miles? Heavy new supply typically softens prices + rents 12–24 months out; constrained supply supports both.
Investment metrics
- 1% rule
- 0.90% ✗
- Cap rate
- 7.46%
- Cash-on-cash
- 4.18%
- DSCR
- 1.19
- GRM
- 9.3
CMA / ARV
- ARV (median comp)
- $243,893
- List price
- $209,900
- Delta
- -13.94%
- Verdict
- UNDERPRICED
- Comps
- 20 within 1.0 mi
Show comp detail 12 sales within ~0.75 mi
| Address | Dist | Beds/Ba | Sqft | Sold | Price | $/sf | Match |
|---|---|---|---|---|---|---|---|
| 7133 Moores Mill Rd | 0.16mi | 3/1.0 | 1,380 (+8%) | 19mo | $68,000 | $49 | 63 |
| 6860 Moores Mill Rd | 0.49mi | 3/2.0 | 1,240 (-3%) | 9mo | $250,000 | $202 | 60 |
| 398 Little Lones Rd | 0.73mi | 3/2.0 | 1,240 (-3%) | 2mo | $246,000 | $198 | 55 |
| 380 Little Lones Rd | 0.70mi | 3/2.0 | 1,255 (-2%) | 9mo | $242,000 | $193 | 52 |
| 202 Chanel Dr | 0.71mi | 3/2.0 | 1,355 (+6%) | 2mo | $255,000 | $188 | 51 |
| 276 Ruby Dr | 0.33mi | 3/2.0 | 1,139 (-11%) | 14mo | $205,000 | $180 | 51 |
| 151 Laredo Cir | 0.68mi | 3/2.0 | 1,320 (+3%) | 14mo | $265,000 | $201 | 47 |
| 105 Braves Dr | 0.61mi | 3/2.0 | 1,330 (+4%) | 21mo | $270,000 | $203 | 44 |
| 207 Vintage Point Cir | 0.52mi | 3/2.0 | 1,371 (+7%) | 22mo | $270,000 | $197 | 42 |
| 216 Vintage Point Cir | 0.54mi | 3/2.0 | 1,420 (+11%) | 16mo | $250,000 | $176 | 39 |
| 6820 Moores Mill Rd | 0.57mi | 3/2.0 | 1,420 (+11%) | 16mo | $235,000 | $165 | 38 |
| 232 Maddux Ct | 0.56mi | 3/2.0 | 1,393 (+9%) | 23mo | $265,000 | $190 | 36 |
Match score weights: distance 35% · size 25% · config 20% · recency 20%. Top-matched comps best support the ARV.
Projected returns pro-forma
-3.0% appreciation · 6.81% rent growth · sell at horizon
- IRR
- -6.0%
- Equity multiple
- 0.77×
- Total profit
- $-13,559
- Equity at exit
- $31,297
- IRR
- 7.4%
- Equity multiple
- 1.65×
- Total profit
- $37,918
- Equity at exit
- $18,148
Cash invested: $58,772 (down + closing). Projections, not guarantees.
Landlord ↔ Tenant lean methodology
- Overall (STATE)
- 90 Strongly Landlord-Friendly
- State Alabama
- 90 Strongly Landlord-Friendly · R+15
- County
- — inherits STATE
- City
- — inherits STATE
ZIP-level market 35811
- Home prices YoY
- -2.1%
- Rents YoY
- 6.8%
- Active inventory
- 560
- Price-to-rent
- 9.3×
Monthly cashflow live
- Estimated rent
- $1,881 high interval (Pro) →
- Mortgage (P&I)
- −$1,101
- Tax from tax record
- −$93 /mo · $1,121/yr
- Insurance
- −$87
- HOA
- −$0
- Vacancy / Maint / Mgmt
- −$395
- Net cashflow
- $205
Break-even live
Sensitivity live
| Price | -10% $324 | -5% $264 | +0% $205 | +5% $145 | +10% $86 |
|---|---|---|---|---|---|
| Rent | -10% $56 | -5% $130 | +0% $205 | +5% $279 | +10% $353 |
| Rate | -1.0pp $310 | -0.5pp $258 | base $205 | +0.5pp $150 | +1.0pp $95 |
UW: 25.0% down · 7.5% · 30yr · 1.5% tax · 5.0% vac · 8.0% maint · 8.0% mgmt
Financing live
Cash to close
- Down payment
- $52,475
- Closing costs
- $6,297
- Reserves months
- —
- Total cash needed
- —
Loan-product check · same deal, 3 products live
Conventional
25% down · 7.5% · 30yr
- Down + closing
- —
- Monthly P&I
- —
- Monthly cashflow
- —
- DSCR
- —
- Eligible?
- —
Personal DTI + credit; lowest rate.
DSCR
20% down · 8.5% · 30yr
- Down + closing
- —
- Monthly P&I
- —
- Monthly cashflow
- —
- DSCR
- —
- Eligible?
- —
No personal income docs; deal must DSCR.
Hard money
10% down · 12.0% · 12mo
- Down + closing
- —
- Monthly P&I
- —
- Monthly cashflow
- —
- DSCR
- —
- Eligible?
- —
Short-term bridge; refi at stabilization.
Rent comps 9 comps
| Address | Beds | Baths | Sqft | Rent | $/sqft | DOM | Units | Dist |
|---|---|---|---|---|---|---|---|---|
| 153 LILLIAN FARMS Blvd Huntsville, AL | 3.0 | 2.0 | 1703 | $1,900 | $1.12 | 24d | 1 | 0.64mi |
| 150 LILLIAN FARMS Blvd Huntsville, AL | 3.0 | 2.0 | 1703 | $1,900 | $1.12 | 24d | 1 | 0.64mi |
| 337 Mistfield St Huntsville, AL | 3.0 | 2.0 | 1723 | $1,795 | $1.04 | 44d | 1 | 0.69mi |
| 147 Wolfe Ln Huntsville, AL | 3.0 | 3.0 | 1442 | $2,100 | $1.46 | 14d | 1 | 0.78mi |
| 149 Wolfe Ln Huntsville, AL | 3.0 | 3.0 | 1442 | $2,000 | $1.39 | 14d | 1 | 0.78mi |
| 229 Paca Ln Huntsville, AL | 3.0 | 2.0 | 1850 | $1,950 | $1.05 | 44d | 1 | 0.78mi |
| 194 Topaz Rd Huntsville, AL | 3.0 | 2.0 | 1550 | $1,895 | $1.22 | 44d | 1 | 1.07mi |
| 6111 Homestead Rd Huntsville, AL | 4.0 | 2.0 | 1640 | $2,500 | $1.52 | 44d | 1 | 1.29mi |
| 127 Colby Dr NE Huntsville, AL | 3.0 | 2.0 | 1239 | $1,395 | $1.13 | 24d | 1 | 1.43mi |
Listing history 23 events
-
2026-06-18days on market $209,900 Active 55 DOM
-
2026-06-17days on market $209,900 Active 54 DOM
-
2026-06-16days on market $209,900 Active 53 DOM
-
2026-06-15days on market $209,900 Active 52 DOM
-
2026-06-14days on market $209,900 Active 50 DOM
-
2026-06-10pricedays on market $209,900 Active 47 DOM
-
2026-06-09days on market $219,900 Active 46 DOM
-
2026-06-08days on market $219,900 Active 45 DOM
-
2026-06-07days on market $219,900 Active 44 DOM
-
2026-06-02days on market $219,900 Active 39 DOM
-
2026-06-01days on market $219,900 Active 38 DOM
-
2026-05-31remarks 638-char remark
-
2026-05-31days on market $219,900 Active 37 DOM
-
2026-05-30days on market $219,900 Active 36 DOM
-
2026-04-24$219,900 Active 549-char remark
-
2022-05-17soldstatus $199,000 Sold 15-char remark
Show marketing remark (15 chars)
NEWLY REMODELED
-
2022-05-17soldstatus $199,000
Show marketing remark (15 chars)
NEWLY REMODELED
-
2022-04-17status Pending 15-char remark
Show marketing remark (15 chars)
NEWLY REMODELED
-
2022-04-14$189,900 Active 15-char remark
Show marketing remark (15 chars)
NEWLY REMODELED
-
2021-09-11$189,000 Active
-
2021-01-08soldstatus $81,500
-
2021-01-04soldstatus $81,500 Sold
-
2020-12-04$81,500
ⓘ Source: listings_history table (triggers on properties + properties_extension) + one-shot
backfill from property_details.listing_events for pre-trigger history.
Tax reassessment forecast AL · Resets to sale price
- Current annual tax
- $1,121 · $93/mo
- Projected year-2 tax
- $1,121 · $93/mo
- Expected delta
- $0/yr ($0/mo · 0.0%)
ⓘ Screening estimate from a state-policy table — verify with the county assessor before closing.
Climate risk First Street
- Flood 1/10 Low FEMA zone X (unshaded) · 0% chance over 30 yrs
- Wildfire 3/10 Moderate
- Heat 5/10 Major 7 d/yr ≥105°F today · 19 d/yr by 30 yrs out
- Wind 4/10 Moderate 17% chance of damaging wind over 30 yrs
- Air quality 2/10 Low 1 unhealthy d/yr today · 2 by 30 yrs out
Nearby sold comps map
Loading sold comps map…
Walkable amenities ~0.75 mi
Loading nearby amenities…
Taxation est. · year 1
- Rental income
- $22,577
- − Mortgage interest
- −$11,758
- − Property taxes
- −$1,121
- − Insurance
- −$1,050
- − Repairs & maintenance
- −$1,806
- − Management
- −$1,806
- − Depreciation
- −$6,106
- Taxable loss
- −$1,069
- Est. tax savings @ 24.0%
- +$257
- After-tax cash flow
- $2,714/yr
For passive investors: Depreciation is non-cash, so a rental often shows a tax loss while cash-flowing — sheltering income. Rental losses are passive: they offset passive income freely, and up to $25,000/yr can offset ordinary (W-2) income if you actively participate and your MAGI is under $100k (phasing out to $0 by $150k); unused losses carry forward. On sale, claimed depreciation is recaptured at up to 25%, and gains may owe capital-gains tax (a 1031 exchange can defer both). Figures are a year-1 estimate at your 24.0% rate — not tax advice; consult a CPA.
Schools (NCES district)
- District
- Madison County
- NCES district ID
- 0102220
- Math proficiency
- 27% ▼ -32.00%
- Reading proficiency
- 56% ▼ -1.00%
- Median HH income
- $66,058
- Composite
- 37.15/100
- National rank
- #4483
- State rank
- #19 of 129 in AL
Livability — Moores Mill
- Score
- 66/100
- State rank
- #109
- US rank
- #11986
Category grades
Schools grade is shown separately in the Schools card above.
Census & demographics
- Census place
- Moores Mill, AL
- County
- Madison County · 380,832 people
- Metro
- Huntsville, AL
- Population (ZIP)
- 31,008
- Household income
- $90,812
- Rent vs Own
- Severe rent burden
- 517.0
Population outlook (Madison County) Hauer SSP2
- Today (2025)
- 392,086 people
- By 2030
- 409,788 · +4.5%
- By 2040
- 440,557 · +12.4%
- By 2050
- 460,990 · +17.6%
- By 2075
- 502,872 · +28.3%
- By 2100
- 513,623 · +31.0%
Race, ethnicity, and origin ACS 2023
- Neighborhood character
- Majority White (64%)
- Race & ethnicity
- White 64% Black 27% Two or more races 5% Hispanic / Latino 3% Asian 2%
- Common ancestry
- Slovak 2% Italian 2% Serbian 2%
- Foreign-born
- 4% · Canada, Vietnam, China
- Languages at home
- 95% English-only · Spanish 3% Vietnamese 1%
Political lean MEDSL · Madison
- 2024 margin
- Lean R (+9.0) · D 44.7% · R 53.7% · Other 1.6%
- 2008→2024 swing
- +6.0pp toward D · 2008: -14.9pp · 2024: -9.0pp
- All cycles
- 2024: R+9.0 2020: R+8.0 2016: R+16.8 2012: R+18.7 2008: R+14.9
Not yet ingested
- Civics
- —
Market trends
- HPI YoY
- ▼ -7.13%
- Current HPI
- 332.9423
- Rent YoY
- ▲ 6.81%
- Metro
- Huntsville, AL
- State GDP YoY
- ▲ 2.94%
- F500 in state
- 4
Industry mix (Fortune 500 HQ in AL)
| Industry | F500 HQs | Revenue |
|---|---|---|
| Financial Services | 1 | $8B |
|
||
| Healthcare | 1 | $5B |
|
||
Price history
+157.5% since first listed10 events — show timeline
- 2026-06-09 Price Changed $209,900 VMLS
- 2026-04-24 Listed $219,900 VMLS
- 2022-05-17 Sold (Public Records) $199,000 Public Records
- 2022-05-17 Sold (MLS) $199,000 VMLS
- 2022-04-17 Pending — VMLS
- 2022-04-14 Listed $189,900 VMLS
- 2021-09-11 Listed $189,000 VMLS
- 2021-01-08 Sold (Public Records) $81,500 Public Records
- 2021-01-04 Sold (MLS) $81,500 VMLS
- 2020-12-04 Listed $81,500 VMLS
Property tax history
+21.0%/yrLatest (2024): $1,121 · +2.4% YoY. Source: county tax records.
Cash-flow waterfall
monthlySold comps — $/sqft
last 12 mo · ≤1 miLoading sold comps…