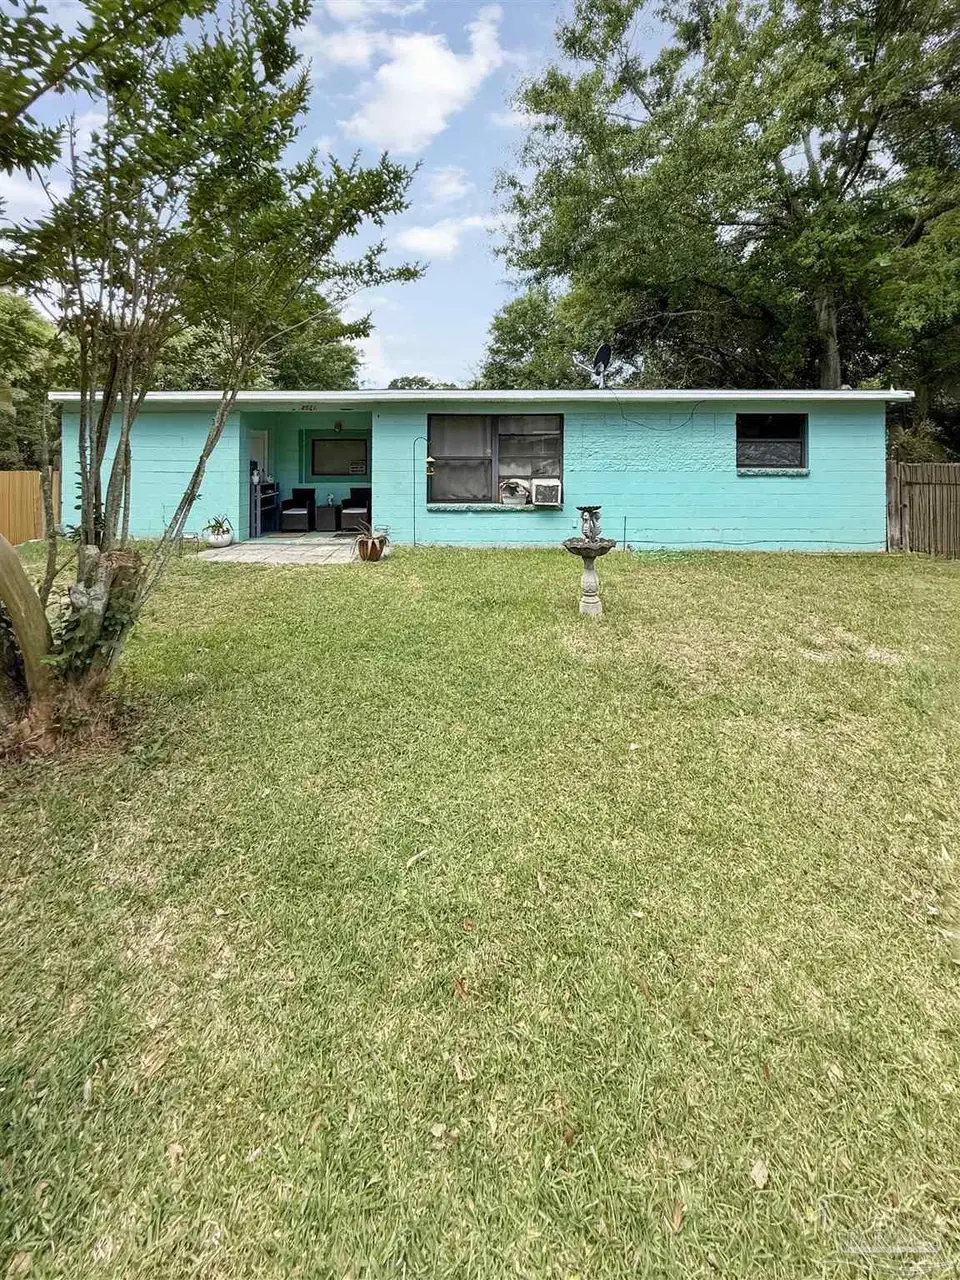
8511 Cherry Ave · Ensley, FL
Flood risk 1/10 · Minimal
- FEMA flood zone
- X (unshaded)
- Chance of flooding over 30 yrs
- 0.0%
- Est. flood insurance / yr
- $507 – $1,088
Fire risk 1/10 · Minimal
- Est. fire insurance / yr
- $947 – $1,759
Heat risk 10/10 · Severe
- Hot days now (above 105°F)
- 7 days/yr
- Hot days in 30 yrs
- 22 days/yr
Wind risk 9/10 · Severe
- Chance of severe wind over 30 yrs
- 99.0%
Air-quality risk 1/10 · Minimal
- Unhealthy air days now
- 0 days/yr
- Unhealthy air days in 30 yrs
- 0 days/yr
Risk factors via First Street. Map © Google.
Why this score? — see what drove the B+ grade
The composite is a weighted blend of 9 inputs, each scored 0–100. Each bar is that input's sub-score; the figure is the points it added to the 100-point composite (weight × sub-score).
- Cash flow +30.0/30.0
- ARV discount +15.0/15.0
- DSCR +10.0/10.0
- 1% rule +9.2/10.0
- Livability +4.0/5.0
- Schools +3.6/10.0
- Rent growth +3.4/5.0
- Condition / age +2.5/5.0
- Appreciation +0.0/10.0
$130,000
🖨 Deal sheet 📄 Offer letter ✓ Due diligence
Listing remarks
SELLER REQUESTS HIGHEST & BEST OFFER BY: 05/07/2026 AT 12PM. Investors and visionaries, take note of this exceptional opportunity in one of Pensacola’s most active growth corridors. Priced specifically for the savvy investor, this property serves as a perfect canvas for a high-yield project with major system updates already completed, including an UPDATED ROOF, HVAC system, and WINDOWS! The neighborhood’s transformation is evident, with extensive redevelopment and new construction occurring directly on Cherry Ave and the surrounding blocks, signaling a strong upward trend in local property values. The home sits on a generous lot, offering the versatility needed for a moder
Key facts
- Generous lot
- Quick access to i-10
- 7,108 sq ft lot
Tags
Property features AI
Finance
- HOA & community: No association
Exterior
- Parking: Driveway with open parking
- Utilities: Public sewer; Electric system with circuit breakers and copper wiring; Public water
- Home design: Single-story concrete home; Slab foundation; Resale property; Not attached to another property; Homestead exemption applied; Paved, county-maintained road access
- Construction: Concrete construction; Slab foundation; One level
- Exterior features: Flat roof; Central access lot feature; Public water
Interior
- Kitchen: Kitchen features not updated
- Bedrooms: Master bedroom on the first floor (approx. 11 x 15); Second bedroom on the first floor (approx. 11 x 11); Third bedroom on the first floor (approx. 11 x 10)
- Flooring: Carpet
- Bathrooms: 1 full bathroom
- Heating & cooling: Central heating; Central air; Wall/window air conditioning units
- Interior features: Carpet flooring; Formal dining room
- Laundry & utility: Washer and dryer included; Electric water heater
Neighborhood map
What this means for you Summary
Snapshot
- This is a 3-bed/1.0-bath single-family listed at $130k.
Deal economics
- At list price, monthly cash flow is $672 ($8k/yr) — positive.
- The deal already cash-flows at list — no discount required.
- Meets the 1% rule at list price ($2k rent vs $130k).
- Recommended offer: $126k (3.0% below list) — sets the bar for market timing.
- Cap rate 12.5% vs local median 4.7% in Ensley — top-decile yield for the area; either an underpriced asset or a hidden risk that comps aren't pricing in. Stress-test before assuming the spread holds.
Location & tenants
- Location reads 79/100 on livability (#133 in FL, #1,996 nationally) — a middle-class / working-renter tenant base. Strengths: cost of living A+, housing A+, health & safety A+; Watch: amenities D, employment D, schools F.
- Escambia (suburban): math 40% / reading 45% proficiency, ranked #56 of 73 in FL (top 77%) — families likely to look elsewhere, expect single-tenant / working-renter base with shorter leases.
- Market conditions: Rents rising (+3.6%/yr); 113 active listings in the ZIP; 10 comparable units currently listed for rent nearby; rentals leasing fast (median 14d on market — plan ~1-2 weeks tenant-placement turnaround); 1,479 units permitted in Escambia County in 2024 (0 in 5+ unit buildings).
- This rent runs 37% of the median local income ($59k/yr) — at the standard rent-burdened threshold; future hikes will face affordability resistance.
Forward outlook
- Local home prices are declining (-3.0%/yr); year-one equity from $899 of loan paydown is wiped out by about $4k of value loss. Plan a longer hold.
- Escambia County population projected at +13% by 2050 — modest demand growth; plan on rents tracking national, not racing it.
- At projected returns (-3.0% appreciation + 3.6% rent growth), your $36k cash investment doubles in ~6 years — after that, you're playing with house money.
Negotiation context
- It's been on market 37 days — a 3% lower offer ($126k) is reasonable based on typical stale-listing flexibility.
- Current owner paid $22k; list at $130k implies a 491% gain — meaningful room to come down on a strong offer.
Risks & watch-outs
- Watch-outs: built in 1958 — expect roof / HVAC / electrical / plumbing capex.
- Climate carrying-cost: severe wind risk, 99% chance of damaging wind over 30y; extreme-heat days projected 7→22/yr by 2055 (HVAC capex compounding) — expect insurance premiums to compound above CPI over the hold.
Questions for the listing agent
- It's been on market 37 days. Have you received any prior offers? Is the seller open to a 3% concession, seller financing, or rate buy-down credit?
- Built in 1958 — when were the roof, HVAC, electrical panel, plumbing, and water heater last replaced?
- Is there a deadline driving the sale (1031 exchange, divorce, estate, relocation)? That informs how much negotiation room exists.
- Schools are F-rated, which usually means shorter tenancies and higher turnover. Who's the typical renter profile here, and what's been the actual vacancy rate?
- What's the average days-on-market for RENTAL listings here right now (not sales)? A rising rental-DOM trend means longer vacancies and softer asking-rent achievability than the comps imply.
- What's the recent tenant-quality profile in this submarket — average credit score on applications, eviction rate, late-payment / NSF rate, and stable-employment percentage? A property-management company in the area should have these aggregated.
- How much new for-sale + rental construction is in the pipeline within 1–3 miles? Heavy new supply typically softens prices + rents 12–24 months out; constrained supply supports both.
Investment metrics
- 1% rule
- 1.42% ✓
- Cap rate
- 12.49%
- Cash-on-cash
- 22.14%
- DSCR
- 1.99
- GRM
- 5.9
CMA / ARV
- ARV (on-the-fly)
- $228,456
- Comps found
- 12
Show comp detail 12 sales within ~0.75 mi
| Address | Dist | Beds/Ba | Sqft | Sold | Price | $/sf | Match |
|---|---|---|---|---|---|---|---|
| 8601 Walnut Ave | 0.11mi | 3/2.0 | 1,307 (-4%) | 2mo | $218,700 | $167 | 82 |
| 8408 Pond Ave | 0.35mi | 3/2.0 | 1,378 (+1%) | 4mo | $80,000 | $58 | 75 |
| 701 W Ensley St | 0.26mi | 3/2.0 | 1,309 (-4%) | 5mo | $240,000 | $183 | 73 |
| 600 W Hannah St | 0.28mi | 3/2.0 | 1,270 (-7%) | 4mo | $115,000 | $91 | 67 |
| 514 W Ensley St | 0.14mi | 3/2.0 | 1,179 (-14%) | 1mo | $230,000 | $195 | 66 |
| 8450 Jarmen Ln | 0.59mi | 3/2.0 | 1,308 (-4%) | 1mo | $225,000 | $172 | 60 |
| 8331 Durand Ave | 0.74mi | 3/2.0 | 1,374 (+0%) | 1mo | $120,000 | $87 | 60 |
| 8603 Russell Ave | 0.41mi | 3/2.0 | 1,221 (-11%) | 1mo | $177,500 | $145 | 58 |
| 8288 Groveland Ave | 0.58mi | 3/2.0 | 1,483 (+8%) | 3mo | $260,000 | $175 | 52 |
| 7950 Hayworth Ave | 0.58mi | 3/2.0 | 1,205 (-12%) | 2mo | $177,500 | $147 | 47 |
| 633 Powell St | 0.48mi | 4/2.0 (+1) | 1,560 (+14%) | 4mo | $70,000 | $45 | 42 |
| 7900 Atilla Ave | 0.62mi | 3/2.0 | 1,173 (-14%) | 2mo | $230,000 | $196 | 41 |
Match score weights: distance 35% · size 25% · config 20% · recency 20%. Top-matched comps best support the ARV.
Projected returns pro-forma
-3.0% appreciation · 3.63% rent growth · sell at horizon
- IRR
- 15.5%
- Equity multiple
- 1.63×
- Total profit
- $22,846
- Equity at exit
- $19,383
- IRR
- 24.6%
- Equity multiple
- 3.19×
- Total profit
- $79,689
- Equity at exit
- $11,240
Cash invested: $36,400 (down + closing). Projections, not guarantees.
Landlord ↔ Tenant lean methodology
- Overall (STATE)
- 87 Strongly Landlord-Friendly
- State Florida
- 87 Strongly Landlord-Friendly · R+3
- County
- — inherits STATE
- City
- — inherits STATE
ZIP-level market 32534
- Home prices YoY
- -19.1%
- Rents YoY
- 3.6%
- Active inventory
- 113
- Price-to-rent
- 5.9×
Monthly cashflow live
- Estimated rent
- $1,842 high interval (Pro) →
- Mortgage (P&I)
- −$682
- Tax from tax record
- −$48 /mo · $570/yr
- Insurance
- −$54
- HOA
- −$0
- Vacancy / Maint / Mgmt
- −$387
- Net cashflow
- $672
Break-even live
UW: 25.0% down · 7.5% · 30yr · 1.5% tax · 5.0% vac · 8.0% maint · 8.0% mgmt
Financing live
Cash to close
- Down payment
- $32,500
- Closing costs
- $3,900
- Reserves months
- —
- Total cash needed
- —
Loan-product check · same deal, 3 products live
Conventional
25% down · 7.5% · 30yr
- Down + closing
- —
- Monthly P&I
- —
- Monthly cashflow
- —
- DSCR
- —
- Eligible?
- —
Personal DTI + credit; lowest rate.
DSCR
20% down · 8.5% · 30yr
- Down + closing
- —
- Monthly P&I
- —
- Monthly cashflow
- —
- DSCR
- —
- Eligible?
- —
No personal income docs; deal must DSCR.
Hard money
10% down · 12.0% · 12mo
- Down + closing
- —
- Monthly P&I
- —
- Monthly cashflow
- —
- DSCR
- —
- Eligible?
- —
Short-term bridge; refi at stabilization.
Rent comps 10 comps
| Address | Beds | Baths | Sqft | Rent | $/sqft | DOM | Units | Dist |
|---|---|---|---|---|---|---|---|---|
| 8660 Figland Ave Pensacola, FL | 3.0 | 2.0 | 1106 | $1,550 | $1.40 | 13d | 1 | 0.20mi |
| 951 Lovebird Ct Pensacola, FL | 4.0 | 2.0 | 1787 | $2,150 | $1.20 | 13d | 1 | 0.39mi |
| 975 Lovebird Ct Pensacola, FL | 4.0 | 2.0 | 1768 | $2,100 | $1.19 | 13d | 1 | 0.43mi |
| 8644 Cove Ave Pensacola, FL | 3.0 | 2.0 | 1588 | $1,850 | $1.16 | 23d | 1 | 0.81mi |
| 1540 Wilimar Pl Pensacola, FL | 3.0 | 2.0 | 1008 | $1,550 | $1.54 | 13d | 1 | 0.99mi |
| 130 E 9 Mile Rd #5 Pensacola, FL | 2.0 | 1.0 | 925 | $1,095 | $1.18 | 23d | 1 | 1.00mi |
| 8881 Bellawood Cir Pensacola, FL | 3.0 | 2.0 | 1685 | $2,100 | $1.25 | 23d | 1 | 1.21mi |
| 9095 Airway Dr Pensacola, FL | 1.0–3.0 | 1.0–2.0 | 1542 | $1,809 | $1.17 | 13d | 19 | 1.32mi |
| 8651 Airway Dr Pensacola, FL | 2.0 | 2.0 | 1170 | $1,682 | $1.44 | 21d | 15 | 1.46mi |
| 9091 Airway Dr Pensacola, FL | 2.0 | 2.0 | 1524 | $1,675 | $1.10 | 13d | 6 | 1.49mi |
Listing history 6 events
-
2026-05-31status $130,000 Pending 37 DOM
-
2026-05-15historical Contingent
-
2026-04-23$130,000 Active
-
1980-10-01soldstatus $22,000
-
1971-01-01soldstatus $11,600
-
1970-01-01soldstatus $11,000
ⓘ Source: listings_history table (triggers on properties + properties_extension) + one-shot
backfill from property_details.listing_events for pre-trigger history.
Tax reassessment forecast FL · Resets to sale price
- Current annual tax
- $570 · $48/mo
- Projected year-2 tax
- $1,079 · $90/mo
- Expected delta
- +$509/yr (+$42/mo · 89.3%)
ⓘ Screening estimate from a state-policy table — verify with the county assessor before closing.
Climate risk First Street
- Flood 1/10 Low FEMA zone X (unshaded) · 0% chance over 30 yrs
- Wildfire 1/10 Low
- Heat 10/10 Extreme 7 d/yr ≥105°F today · 22 d/yr by 30 yrs out
- Wind 9/10 Extreme 99% chance of damaging wind over 30 yrs
- Air quality 1/10 Low 0 unhealthy d/yr today · 0 by 30 yrs out
Nearby sold comps map
Loading sold comps map…
Walkable amenities ~0.75 mi
Loading nearby amenities…
Taxation est. · year 1
- Rental income
- $22,103
- − Mortgage interest
- −$7,282
- − Property taxes
- −$570
- − Insurance
- −$650
- − Repairs & maintenance
- −$1,768
- − Management
- −$1,768
- − Depreciation
- −$3,782
- Taxable income
- $6,282
- Est. tax owed @ 24.0%
- −$1,508
- After-tax cash flow
- $6,552/yr
For passive investors: Depreciation is non-cash, so a rental often shows a tax loss while cash-flowing — sheltering income. Rental losses are passive: they offset passive income freely, and up to $25,000/yr can offset ordinary (W-2) income if you actively participate and your MAGI is under $100k (phasing out to $0 by $150k); unused losses carry forward. On sale, claimed depreciation is recaptured at up to 25%, and gains may owe capital-gains tax (a 1031 exchange can defer both). Figures are a year-1 estimate at your 24.0% rate — not tax advice; consult a CPA.
Schools (NCES district)
- District
- Escambia
- NCES district ID
- 1200510
- Math proficiency
- 40% ▼ -9.00%
- Reading proficiency
- 45% ▼ -4.00%
- Median HH income
- $44,649
- Composite
- 36.04/100
- National rank
- #4773
- State rank
- #56 of 73 in FL
Livability — Ensley
- Score
- 79/100
- State rank
- #133
- US rank
- #1996
Category grades
Schools grade is shown separately in the Schools card above.
Census & demographics
- Census place
- Ensley, FL
- County
- Escambia County · 301,722 people
- City population
- 15,879
- Metro
- Pensacola-Ferry Pass-Brent, FL
- Population (ZIP)
- 17,104
- Household income
- $58,992
- Rent vs Own
- Severe rent burden
- 540.0
Population outlook (Escambia County) Hauer SSP2
- Today (2025)
- 334,637 people
- By 2030
- 345,779 · +3.3%
- By 2040
- 364,828 · +9.0%
- By 2050
- 378,514 · +13.1%
- By 2075
- 403,220 · +20.5%
- By 2100
- 386,125 · +15.4%
Race, ethnicity, and origin ACS 2023
- Neighborhood character
- Diverse neighborhood (Simpson 0.65)
- Race & ethnicity
- White 51% Black 30% Two or more races 9% Hispanic / Latino 8% Asian 5%
- Hispanic origin (detail)
- Mexican 2%
- Common ancestry
- Serbian 3% Italian 2% Portuguese 1%
- Foreign-born
- 8% · Canada, Vietnam, Jamaica
- Languages at home
- 89% English-only · Spanish 6% Vietnamese 2% Tagalog/Filipino 1%
Political lean MEDSL · Escambia
- 2024 margin
- R (+19.5) · D 39.7% · R 59.2% · Other 1.1%
- 2008→2024 swing
- -0.2pp no change · 2008: -19.3pp · 2024: -19.5pp
- All cycles
- 2024: R+19.5 2020: R+15.1 2016: R+20.6 2012: R+20.6 2008: R+19.3
Not yet ingested
- Civics
- —
Market trends
- HPI YoY
- ▼ -60.23%
- Current HPI
- 255.7617
- Rent YoY
- ▲ 3.63%
- Metro
- Pensacola-Ferry Pass-Brent, FL
- State GDP YoY
- ▲ 3.28%
- F500 in state
- 36
Industry mix (Fortune 500 HQ in FL)
| Industry | F500 HQs | Revenue |
|---|---|---|
| Industrial Technology | 2 | $29B |
|
||
| Insurance | 2 | $17B |
|
||
| Retail | 1 | $60B |
|
||
| Technology Distribution | 1 | $58B |
|
||
| Homebuilding | 1 | $35B |
|
||
| Technology Manufacturing | 1 | $35B |
|
||
Price history
+1081.8% since first listed5 events — show timeline
- 2026-05-15 Contingent — PARMLS
- 2026-04-23 Listed $130,000 PARMLS
- 1980-10-01 Sold (Public Records) $22,000 Public Records
- 1971-01-01 Sold (Public Records) $11,600 Public Records
- 1970-01-01 Sold (Public Records) $11,000 Public Records
Property tax history
+5.6%/yrLatest (2025): $570 · +26.9% YoY. Source: county tax records.
Cash-flow waterfall
monthlySold comps — $/sqft
last 12 mo · ≤1 miLoading sold comps…