1700 Embassy Dr #305 · West Palm Beach, FL
Flood risk 1/10 · Minimal
- FEMA flood zone
- X (unshaded)
- Chance of flooding over 30 yrs
- 0.0%
- Est. flood insurance / yr
- $507 – $1,088
Fire risk 1/10 · Minimal
- Est. fire insurance / yr
- $947 – $1,759
Heat risk 9/10 · Severe
- Hot days now (above 105°F)
- 7 days/yr
- Hot days in 30 yrs
- 23 days/yr
Wind risk 10/10 · Severe
- Chance of severe wind over 30 yrs
- 99.0%
Air-quality risk 2/10 · Minimal
- Unhealthy air days now
- 1 days/yr
- Unhealthy air days in 30 yrs
- 1 days/yr
Risk factors via First Street. Map © Google.
Why this score? — see what drove the C+ grade
The composite is a weighted blend of 9 inputs, each scored 0–100. Each bar is that input's sub-score; the figure is the points it added to the 100-point composite (weight × sub-score).
- Cash flow +22.8/30.0
- 1% rule +8.4/10.0
- ARV discount +7.5/15.0
- DSCR +7.3/10.0
- Schools +4.3/10.0
- Livability +4.1/5.0
- Rent growth +3.8/5.0
- Condition / age +2.5/5.0
- Appreciation +0.0/10.0
$299,000
🖨 Deal sheet (PDF) 📄 Offer letter ✓ Due diligence
Listing remarks
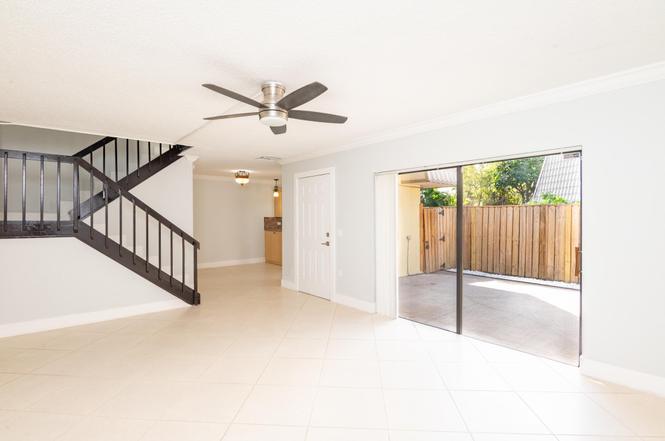
Beautiful & Spacious 3 bedroom 2-1/2 bath Townhouse in gated community. Great Location! Walking distance to the Tanger Outlets, restaurants & shops with a short drive to the airport, Downtown West Palm Beach & beaches. Private fenced in courtyard for plenty of outdoor entertaining. Beautiful Kitchen with stainless steel appliances & beautiful cabinets with ceramic floors throughout. Kitchen, dining area, half bath, living area & 1 bedroom on the lower level. 2 other Bedrooms each with its own full bath on the upper level. Main bedroom has large walk-in closet, shower & dual sinks with Balconies in both bedrooms. Newer AC, Hot water heater & roof. 2
Key facts
- Gated community
- Dual sinks
- Private balcony
Tags
Property features AI
Finance
- Financial info: Pets allowed (breed, number, and size restrictions apply)
- HOA & community: HOA with monthly fee; HOA amenities include a pool; HOA fee paid monthly (amount listed)
Exterior
- Parking: Assigned and open parking; Two open parking spaces
- Security: Gated community (no guard)
- Utilities: Three-phase electric; Cable available
- Home design: Townhouse; Two-story building; Facing north; Resale property
- Construction: CBS construction
- Exterior features: Open patio; Patio; Fenced
Interior
- Kitchen: Dishwasher; Electric range; Microwave; Refrigerator
- Bedrooms: One bedroom on the main level
- Flooring: Ceramic tile
- Bathrooms: Two full bathrooms and one half bathroom (three total; one on the main level)
- Heating & cooling: Central heating; Central air conditioning
- Interior features: Walk-in closets; Blinds
Neighborhood map
What this means for you Summary
Snapshot
- This is a 3-bed/2.5-bath condo listed at $299k.
Deal economics
- At list price, monthly cash flow is $518 ($6k/yr) — positive.
- The deal already cash-flows at list — no discount required.
- Meets the 1% rule at list price ($4k rent vs $299k).
- Recommended offer: $281k (6.0% below list) — sets the bar for market timing.
- Cap rate 8.4% vs local median 3.8% in West Palm Beach — top-decile yield for the area; either an underpriced asset or a hidden risk that comps aren't pricing in. Stress-test before assuming the spread holds.
Location & tenants
- Location reads 82/100 on livability (#75 in FL, #1,255 nationally) — a professional / high-income tenant draw. Strengths: commute A+, housing A+, health & safety A+; Watch: employment C-, crime F.
- Palm Beach (suburban): math 46% / reading 53% proficiency, ranked #34 of 73 in FL (top 47%) — families likely to look elsewhere, expect single-tenant / working-renter base with shorter leases.
- Zoned schools: Roosevelt Elementary School (math 22% / reading 22%, grade F, #2,080 of 2,144 statewide, top 97%, 324 students, 86% FRL); Palm Beach Lakes High School (math 17% / reading 26%, grade F, #546 of 667 statewide, top 82%, 2,688 students, 70% FRL) — zoned schools average 78% FRL vs 52% district-wide (26 pts higher); higher-poverty schools than district average — tighter screening recommended.
- Zoned-school proficiency averages 22% at this address vs 50% district-wide (-28 pts) — the specific schools serving this property underperform the Palm Beach average; the district grade overstates school quality for this exact location.
- Market conditions: Rents rising fast (+5.2%/yr); 507 active listings in the ZIP; 30 comparable units currently listed for rent nearby; rentals at typical pace (median 21d on market — plan ~3-4 weeks tenant-placement turnaround); 3,974 units permitted in Palm Beach County in 2024 (1,012 in 5+ unit buildings).
Forward outlook
- Local home prices are declining (-3.0%/yr); year-one equity from $2k of loan paydown is wiped out by about $9k of value loss. Plan a longer hold.
- Palm Beach County population projected at +30% by 2050 — long-run rental-demand tailwind backs the buy-and-hold thesis.
- At projected returns (-3.0% appreciation + 5.2% rent growth), your $84k cash investment doubles in ~10 years — after that, you're playing with house money.
Negotiation context
- It's been on market 80 days — a 6% lower offer ($281k) is reasonable based on typical stale-listing flexibility.
- 10 sale attempts since 27y ago; this cycle's ask is 11400% above the opening price — seller raised mid-cycle; expect resistance to lowballs.
- Current owner paid $158k; list at $299k implies a 89% gain — meaningful room to come down on a strong offer.
Risks & watch-outs
- Climate carrying-cost: severe wind risk, 99% chance of damaging wind over 30y; extreme-heat days projected 7→23/yr by 2055 (HVAC capex compounding) — expect insurance premiums to compound above CPI over the hold.
Questions for the listing agent
- It's been on market 80 days. Have you received any prior offers? Is the seller open to a 6% concession, seller financing, or rate buy-down credit?
- Built in 1979 — when were the roof, HVAC, electrical panel, plumbing, and water heater last replaced?
- What does the HOA fee cover, when was the last increase, and are there any pending special assessments or reserve-fund shortfalls?
- Any open or pending special assessments — roof, HVAC, plumbing, elevator, façade? What's the per-unit balance and payoff schedule, and is the seller paying it off at close or rolling it to the buyer?
- Why hasn't it sold? Are there any deal-killer items the seller is aware of (foundation, flood, title, zoning, code violations)?
- Is there a deadline driving the sale (1031 exchange, divorce, estate, relocation)? That informs how much negotiation room exists.
- Crime grade is F in this area — have there been break-ins, vandalism, or insurance claims at this property in the last 3 years? What carrier currently insures it and at what premium?
- What's the average days-on-market for RENTAL listings here right now (not sales)? A rising rental-DOM trend means longer vacancies and softer asking-rent achievability than the comps imply.
- What's the recent tenant-quality profile in this submarket — average credit score on applications, eviction rate, late-payment / NSF rate, and stable-employment percentage? A property-management company in the area should have these aggregated.
- How much new apartment / multifamily construction is in the pipeline within 1–3 miles? Heavy new supply (>2% of stock underway) typically softens rents 12–24 months out; light construction supports rent growth.
Investment metrics
- 1% rule
- 1.34% ✓
- Cap rate
- 8.37%
- Cash-on-cash
- 7.43%
- DSCR
- 1.33
- GRM
- 6.2
CMA / ARV
No comps found within radius.
Projected returns pro-forma
-3.0% appreciation · 5.15% rent growth · sell at horizon
- IRR
- -1.9%
- Equity multiple
- 0.93×
- Total profit
- $-6,179
- Equity at exit
- $44,582
- IRR
- 10.5%
- Equity multiple
- 1.92×
- Total profit
- $76,749
- Equity at exit
- $25,852
Cash invested: $83,720 (down + closing). Projections, not guarantees.
Landlord ↔ Tenant lean methodology
- Overall (STATE)
- 87 Strongly Landlord-Friendly
- State Florida
- 87 Strongly Landlord-Friendly · R+3
- County
- — inherits STATE
- City
- — inherits STATE
ZIP-level market 33401
- Rents YoY
- 5.2%
- Active inventory
- 507
- Price-to-rent
- 6.2×
Monthly cashflow live
- Estimated rent
- $4,004 high interval (Pro) →
- Mortgage (P&I)
- −$1,568
- Tax from tax record
- −$352 /mo · $4,226/yr
- Insurance
- −$125
- HOA
- −$600
- Vacancy / Maint / Mgmt
- −$841
- Net cashflow
- $518
Break-even live
Sensitivity live
| Price | -10% $688 | -5% $603 | +0% $518 | +5% $434 | +10% $349 |
|---|---|---|---|---|---|
| Rent | -10% $202 | -5% $360 | +0% $518 | +5% $676 | +10% $835 |
| Rate | -1.0pp $669 | -0.5pp $594 | base $518 | +0.5pp $441 | +1.0pp $362 |
UW: 25.0% down · 7.5% · 30yr · 1.5% tax · 5.0% vac · 8.0% maint · 8.0% mgmt
Financing live
Cash to close
- Down payment
- $74,750
- Closing costs
- $8,970
- Reserves months
- —
- Total cash needed
- —
Loan-product check · same deal, 3 products live
Conventional
25% down · 7.5% · 30yr
- Down + closing
- —
- Monthly P&I
- —
- Monthly cashflow
- —
- DSCR
- —
- Eligible?
- —
Personal DTI + credit; lowest rate.
DSCR
20% down · 8.5% · 30yr
- Down + closing
- —
- Monthly P&I
- —
- Monthly cashflow
- —
- DSCR
- —
- Eligible?
- —
No personal income docs; deal must DSCR.
Hard money
10% down · 12.0% · 12mo
- Down + closing
- —
- Monthly P&I
- —
- Monthly cashflow
- —
- DSCR
- —
- Eligible?
- —
Short-term bridge; refi at stabilization.
Rent comps 30 comps
| Address | Beds | Baths | Sqft | Rent | $/sqft | DOM | Units | Dist |
|---|---|---|---|---|---|---|---|---|
| 1714 Consulate Pl #101 West Palm Beach, FL | 3.0 | 3.0 | 1377 | $3,000 | $2.18 | 25d | 1 | 0.24mi |
| 1900 Consulate Pl #1005 West Palm Beach, FL | 2.0 | 2.0 | 1557 | $4,900 | $3.15 | 15d | 1 | 0.25mi |
| 1991 Presidential Way West Palm Beach, FL | 3.0 | 2.0 | 1485 | $4,905 | $3.30 | 17d | 1 | 0.43mi |
| 2425 Presidential Way West Palm Beach, FL | 2.0 | 2.0 | 1294 | $4,500 | $3.48 | 25d | 1 | 0.52mi |
| 2450 Presidential Way #7 West Palm Beach, FL | 2.0 | 2.0 | 1855 | $4,700 | $2.53 | 3d | 1 | 0.65mi |
| 2450 Presidential Way #7 West Palm Beach, FL | 2.0 | 2.0 | 1855 | $4,700 | $2.53 | 25d | 1 | 0.65mi |
| 2450 Presidential Way #208 West Palm Beach, FL | 3.0 | 3.0 | 2250 | $3,900 | $1.73 | 25d | 1 | 0.65mi |
| 2480 Presidential Way #902 West Palm Beach, FL | 2.0 | 2.0 | 1855 | $4,650 | $2.51 | 6d | 1 | 0.68mi |
| 2480 Presidential Way #1903 West Palm Beach, FL | 2.0 | 2.0 | 1855 | $4,650 | $2.51 | 25d | 1 | 0.68mi |
| 1319 13th St West Palm Beach, FL | 3.0 | 2.0 | 1215 | $3,200 | $2.63 | 25d | 1 | 0.77mi |
| 1979 Brandywine Rd Unit 1979-108 West Palm Beach, FL | 3.0 | 2.0 | 1395 | $3,205 | $2.30 | 25d | 1 | 0.77mi |
| 500 Pacific Grove Dr #3 West Palm Beach, FL | 4.0 | 3.5 | 2215 | $3,800 | $1.72 | 25d | 1 | 0.78mi |
| 290 Courtney Lakes Cir West Palm Beach, FL | 1.0–3.0 | 1.0–2.0 | 1069 | $3,250 | $3.04 | 20d | 19 | 0.84mi |
| 1101 Grant St West Palm Beach, FL | 4.0 | 2.0 | 1726 | $2,995 | $1.74 | 17d | 1 | 1.06mi |
| 2055 Regents Blvd West Palm Beach, FL | 3.0 | 3.0 | 2166 | $6,900 | $3.19 | 25d | 1 | 1.08mi |
| 1115 Windsor Ave West Palm Beach, FL | 4.0 | 3.0 | 1377 | $3,500 | $2.54 | 20d | 1 | 1.09mi |
| 926 14th St West Palm Beach, FL | 4.0 | 2.0 | 1050 | $3,000 | $2.86 | 16d | 1 | 1.15mi |
| 735 20th St West Palm Beach, FL | 4.0 | 3.0 | 1767 | $3,600 | $2.04 | 8d | 1 | 1.33mi |
| 735 20th St West Palm Beach, FL | 4.0 | 3.0 | 1767 | $3,800 | $2.15 | 25d | 1 | 1.33mi |
| 716 21st St West Palm Beach, FL | 4.0 | 2.0 | 1560 | $3,800 | $2.44 | 6d | 1 | 1.36mi |
| 716 21st St West Palm Beach, FL | 4.0 | 2.0 | 1560 | $3,800 | $2.44 | 18d | 1 | 1.36mi |
| 933 30th Ct West Palm Beach, FL | 3.0 | 1.5 | 1085 | $3,100 | $2.86 | 25d | 1 | 1.42mi |
| 565 Lilac Ct West Palm Beach, FL | 3.0 | 2.0 | 1250 | $3,000 | $2.40 | 18d | 1 | 1.44mi |
| 300 S Australian Ave #1605 West Palm Beach, FL | 3.0 | 2.0 | 1188 | $4,800 | $4.04 | 25d | 1 | 1.49mi |
| 300 S Australian Ave West Palm Beach, FL | 3.0 | 2.0 | 1377 | $6,000 | $4.36 | 25d | 1 | 1.49mi |
| 300 S Australian Ave #1418 West Palm Beach, FL | 2.0 | 2.0 | 1225 | $7,000 | $5.71 | 0d | 1 | 1.49mi |
| 300 S Australian Ave #1608 West Palm Beach, FL | 2.0 | 2.0 | 1085 | $6,000 | $5.53 | 25d | 1 | 1.49mi |
| 300 S Australian Ave #125 West Palm Beach, FL | 2.0 | 2.5 | 1871 | $7,000 | $3.74 | 11d | 1 | 1.49mi |
| 300 S Australian Ave West Palm Beach, FL | 2.0 | 2.0 | 1245 | $3,250 | $2.61 | 0d | 1 | 1.49mi |
| 300 S Australian Ave #419 West Palm Beach, FL | 2.0 | 2.0 | 1186 | $3,750 | $3.16 | 18d | 1 | 1.49mi |
HOA detail condo
- Monthly dues
- $600 · $7,200/yr
- Likely covers
- watersecurity
- Assessments
- None detected in remarks — confirm with the listing agent.
Listing history 26 events
-
2026-05-16status Pending
-
2026-05-05status Active
-
2026-05-01status Pending
-
2026-04-28status Active
-
2026-04-17status Pending
-
2026-04-09$2,600
-
2026-04-09historical $2,600
-
2026-02-13$2,600
-
2026-02-10$299,000 Active
-
2014-10-23historical
-
2008-05-27historical
-
2007-12-04$189,000
-
2007-08-13soldstatus $158,000
-
2007-07-10historical
-
2006-12-17$164,900
-
2006-01-27soldstatus $213,000
-
2006-01-27soldstatus $213,000
-
2004-06-12$175,000
-
2003-01-08soldstatus $111,000
-
2002-12-27soldstatus $111,000
-
2002-11-22historical
-
2002-10-01$115,000
-
1999-08-09soldstatus $59,000
-
1999-06-24historical
-
1999-06-09$64,900
-
1992-02-04soldstatus $70,000
ⓘ Source: listings_history table (triggers on properties + properties_extension) + one-shot
backfill from property_details.listing_events for pre-trigger history.
Tax reassessment forecast FL · Resets to sale price
- Current annual tax
- $4,226 · $352/mo
- Projected year-2 tax
- $4,226 · $352/mo
- Expected delta
- $0/yr ($0/mo · 0.0%)
ⓘ Screening estimate from a state-policy table — verify with the county assessor before closing.
Climate risk First Street
- Flood 1/10 Low FEMA zone X (unshaded) · 0% chance over 30 yrs
- Wildfire 1/10 Low
- Heat 9/10 Extreme 7 d/yr ≥105°F today · 23 d/yr by 30 yrs out
- Wind 10/10 Extreme 99% chance of damaging wind over 30 yrs
- Air quality 2/10 Low 1 unhealthy d/yr today · 1 by 30 yrs out
Nearby sold comps map
Loading sold comps map…
Walkable amenities ~0.75 mi
Loading nearby amenities…
Taxation est. · year 1
- Rental income
- $48,046
- − Mortgage interest
- −$16,749
- − Property taxes
- −$4,226
- − Insurance
- −$1,495
- − Repairs & maintenance
- −$3,844
- − Management
- −$3,844
- − HOA
- −$7,200
- − Depreciation
- −$8,698
- Taxable income
- $1,991
- Est. tax owed @ 24.0%
- −$478
- After-tax cash flow
- $5,741/yr
For passive investors: Depreciation is non-cash, so a rental often shows a tax loss while cash-flowing — sheltering income. Rental losses are passive: they offset passive income freely, and up to $25,000/yr can offset ordinary (W-2) income if you actively participate and your MAGI is under $100k (phasing out to $0 by $150k); unused losses carry forward. On sale, claimed depreciation is recaptured at up to 25%, and gains may owe capital-gains tax (a 1031 exchange can defer both). Figures are a year-1 estimate at your 24.0% rate — not tax advice; consult a CPA.
Schools (NCES district)
- District
- Palm Beach
- NCES district ID
- 1201500
- Math proficiency
- 46% ▼ -16.00%
- Reading proficiency
- 53% ▼ -4.00%
- Median HH income
- $53,943
- Composite
- 42.72/100
- National rank
- #3160
- State rank
- #34 of 73 in FL
Livability — West Palm Beach
- Score
- 82/100
- State rank
- #75
- US rank
- #1255
Category grades
Schools grade is shown separately in the Schools card above.
Census & demographics
- Census place
- West Palm Beach, FL
- County
- Palm Beach County · 1,438,312 people
- City population
- 222,012
- Metro
- Miami-Fort Lauderdale-Pompano Beach, FL
- Population (ZIP)
- 33,698
- Household income
- $67,967
- Rent vs Own
- Severe rent burden
- 2953.0
Population outlook (Palm Beach County) Hauer SSP2
- Today (2025)
- 1,637,487 people
- By 2030
- 1,743,255 · +6.5%
- By 2040
- 1,948,712 · +19.0%
- By 2050
- 2,132,979 · +30.3%
- By 2075
- 2,530,027 · +54.5%
- By 2100
- 2,706,979 · +65.3%
Race, ethnicity, and origin ACS 2023
- Neighborhood character
- Diverse neighborhood (Simpson 0.68)
- Race & ethnicity
- White 43% Black 32% Hispanic / Latino 17% Two or more races 11% Asian 3%
- Hispanic origin (detail)
- Mexican 2% Puerto Rican 3% Cuban 3%
- Common ancestry
- Hispanic 6% Slovak 2% Romanian 2%
- Foreign-born
- 26% · Canada, Jamaica, China
- Languages at home
- 73% English-only · Spanish 13% French/Haitian/Cajun 7% Other Asian/Pacific 2%
Political lean MEDSL · Palm Beach
- 2024 margin
- Toss-up / Even · D 50.0% · R 49.2%
- 2008→2024 swing
- -22.1pp toward R · 2008: 22.9pp · 2024: 0.8pp
- All cycles
- 2024: D+0.8 2020: D+12.8 2016: D+15.3 2012: D+17.0 2008: D+22.9
Not yet ingested
- Civics
- —
Market trends
- HPI YoY
- ▼ -324.96%
- Current HPI
- 367.0978
- Rent YoY
- ▲ 5.15%
- Metro
- Miami-Fort Lauderdale-Pompano Beach, FL
- State GDP YoY
- ▲ 3.28%
- F500 in state
- 36
Industry mix (Fortune 500 HQ in FL)
| Industry | F500 HQs | Revenue |
|---|---|---|
| Industrial Technology | 2 | $29B |
|
||
| Insurance | 2 | $17B |
|
||
| Retail | 1 | $60B |
|
||
| Technology Distribution | 1 | $58B |
|
||
| Homebuilding | 1 | $35B |
|
||
| Technology Manufacturing | 1 | $35B |
|
||
Price history
-96.3% since first listed26 events — show timeline
- 2026-05-16 Pending — Beaches MLS
- 2026-05-05 Relisted — Beaches MLS
- 2026-05-01 Pending — Beaches MLS
- 2026-04-28 Relisted — Beaches MLS
- 2026-04-17 Pending — Beaches MLS
- 2026-04-09 Listed for Rent $2,600 RMLSFL
- 2026-04-09 Rental Removed $2,600 GFLMLS
- 2026-02-13 Listed for Rent $2,600 GFLMLS
- 2026-02-10 Listed $299,000 Beaches MLS
- 2014-10-23 Listing Removed — Beaches MLS
- 2008-05-27 Listing Removed — Beaches MLS
- 2007-12-04 Listed $189,000 Beaches MLS
- 2007-08-13 Sold (MLS) $158,000 Beaches MLS
- 2007-07-10 Listing Removed — Beaches MLS
- 2006-12-17 Listed $164,900 Beaches MLS
- 2006-01-27 Sold (Public Records) $213,000 Public Records
- 2006-01-27 Sold (Public Records) $213,000 Public Records
- 2004-06-12 Listed $175,000 Beaches MLS
- 2003-01-08 Sold (Public Records) $111,000 Public Records
- 2002-12-27 Sold (MLS) $111,000 Beaches MLS
- 2002-11-22 Listing Removed — Beaches MLS
- 2002-10-01 Listed $115,000 Beaches MLS
- 1999-08-09 Sold (MLS) $59,000 Beaches MLS
- 1999-06-24 Listing Removed — Beaches MLS
- 1999-06-09 Listed $64,900 Beaches MLS
- 1992-02-04 Sold (Public Records) $70,000 Public Records
Property tax history
+7.8%/yrLatest (2025): $4,226 · +5.9% YoY. Source: county tax records.
Cash-flow waterfall
monthlySold comps — $/sqft
last 12 mo · ≤1 miLoading sold comps…