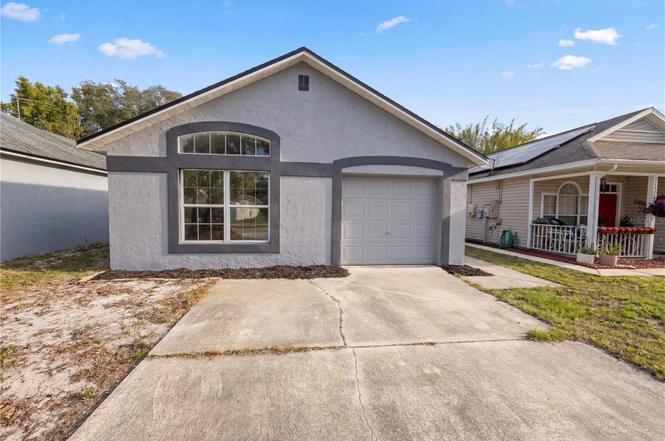
114 Pamala Ct · Sanford, FL
Flood risk 1/10 · Minimal
- FEMA flood zone
- X (unshaded)
- Chance of flooding over 30 yrs
- 0.0%
- Est. flood insurance / yr
- $507 – $1,088
Fire risk 1/10 · Minimal
- Est. fire insurance / yr
- $947 – $1,759
Heat risk 9/10 · Severe
- Hot days now (above 108°F)
- 7 days/yr
- Hot days in 30 yrs
- 21 days/yr
Wind risk 9/10 · Severe
- Chance of severe wind over 30 yrs
- 99.0%
Air-quality risk 2/10 · Minimal
- Unhealthy air days now
- 1 days/yr
- Unhealthy air days in 30 yrs
- 1 days/yr
Risk factors via First Street. Map © Google.
Why this score? — see what drove the D grade
The composite is a weighted blend of 9 inputs, each scored 0–100. Each bar is that input's sub-score; the figure is the points it added to the 100-point composite (weight × sub-score).
- Cash flow +12.5/30.0
- ARV discount +12.3/15.0
- Schools +5.1/10.0
- DSCR +3.7/10.0
- Livability +3.7/5.0
- 1% rule +2.6/10.0
- Rent growth +2.6/5.0
- Condition / age +2.5/5.0
- Appreciation +0.0/10.0
$300,000
🖨 Deal sheet 📄 Offer letter ✓ Due diligence
Listing remarks MLS
Located in a quiet little neighborhood just around the corner from I-4, Seminole Town Center Mall, and Colonial Park. Very well maintained home with new water heater, painted in and out within the last year.
Key facts
- Spacious patio
- 3,999 sq ft lot
- Garage
Tags
Property features AI
Finance
- Other: Zoning: PD
- Financial info: Lease restrictions apply
- HOA & community: Has HOA (Network Transaction Solutions); HOA dues $600 annually ($50/month equivalent); Association approval required; Association fee includes: Other; Pets allowed
Exterior
- Parking: Attached garage (1 car)
- Security: Owned security system
- Utilities: Public water; Public sewer; Electricity available; Water available
- Home design: Single Family Residence; One level; Faces south; Residential property
- Construction: Block and stucco construction; Shingle roof; Slab foundation; Built on 0.09 acres (approx. 0 to less than 1/4 acre)
- Exterior features: Exterior features: Other; Paved road access
Interior
- Kitchen: Dishwasher; Range hood
- Bedrooms: 3 bedrooms
- Flooring: Vinyl
- Bathrooms: 2 full bathrooms
- Heating & cooling: Central heating; Heat pump; Central air conditioning
- Interior features: Living room/dining room combo; Security system (owned)
- Laundry & utility: Laundry features: Other; Electric water heater
Neighborhood map
What this means for you Summary
Snapshot
- This is a 3-bed/2.0-bath single-family listed at $300k.
Deal economics
- At list price, monthly cash flow is $-47 ($-559/yr) — negative.
- To cash-flow at today's rent, offer at most $292k (2.7% below list).
- To meet the 1% rule (rent ≥ 1% of price), the offer needs to be $227k (24.2% below list).
- Recommended offer: $227k (24.2% below list) — sets the bar for 1% rule.
- Cap rate 6.1% vs local median 3.6% in Sanford — top-decile yield for the area; either an underpriced asset or a hidden risk that comps aren't pricing in. Stress-test before assuming the spread holds.
Location & tenants
- Location reads 73/100 on livability (#316 in FL) — a middle-class / working-renter tenant base. Strengths: cost of living A+, housing A+, health & safety A+; Watch: employment C-, crime F, amenities F.
- Seminole (suburban): math 57% / reading 61% proficiency, ranked #13 of 73 in FL (top 18%) — acceptable for families but not a draw, mixed tenant base, ~2y average lease.
- Market conditions: Rents flat; 561 active listings in the ZIP; 29 comparable units currently listed for rent nearby; rentals leasing fast (median 11d on market — plan ~1-2 weeks tenant-placement turnaround); solid renter incomes; 1,979 units permitted in Seminole County in 2024 (1,191 in 5+ unit buildings).
- This rent runs 35% of the median local income ($78k/yr) — at the standard rent-burdened threshold; future hikes will face affordability resistance.
Forward outlook
- Local home prices are declining (-3.0%/yr); year-one equity from $2k of loan paydown is wiped out by about $9k of value loss. Plan a longer hold.
- Seminole County population projected at +24% by 2050 — long-run rental-demand tailwind backs the buy-and-hold thesis.
Negotiation context
- Only 8 days on market — expect competitive offers; lowballing is unlikely to land.
- 2 sale attempts since 20y ago with the ask held roughly flat each time — persistent listings suggest the price (not the market) is what's stuck; bring a comps-based counter.
- Current owner paid $200k; list at $300k implies a 50% gain — meaningful room to come down on a strong offer.
Risks & watch-outs
- Climate carrying-cost: severe wind risk, 99% chance of damaging wind over 30y; extreme-heat days projected 7→21/yr by 2055 (HVAC capex compounding) — expect insurance premiums to compound above CPI over the hold.
Questions for the listing agent
- What do current leases actually rent for vs. the listed asking? Can we see a recent rent roll and the last 12 months of T-12 income?
- What does the HOA fee cover, when was the last increase, and are there any pending special assessments or reserve-fund shortfalls?
- Is there a deadline driving the sale (1031 exchange, divorce, estate, relocation)? That informs how much negotiation room exists.
- Schools are B-rated — typically a magnet for longer-tenancy family renters. What's the average tenant stay here, and is there a school-zone premium baked into asking?
- Crime grade is F in this area — have there been break-ins, vandalism, or insurance claims at this property in the last 3 years? What carrier currently insures it and at what premium?
- The area grade is low — what's the realistic commute time and amenity access for the typical tenant pool here? Any planned neighborhood developments (good or bad) we should know about?
- What's the average days-on-market for RENTAL listings here right now (not sales)? A rising rental-DOM trend means longer vacancies and softer asking-rent achievability than the comps imply.
- What's the recent tenant-quality profile in this submarket — average credit score on applications, eviction rate, late-payment / NSF rate, and stable-employment percentage? A property-management company in the area should have these aggregated.
- How much new for-sale + rental construction is in the pipeline within 1–3 miles? Heavy new supply typically softens prices + rents 12–24 months out; constrained supply supports both.
Investment metrics
- 1% rule
- 0.76% ✗
- Cap rate
- 6.11%
- Cash-on-cash
- -0.67%
- DSCR
- 0.97
- GRM
- 11.0
CMA / ARV
- ARV (on-the-fly)
- $335,872
- Comps found
- 12
Show comp detail 12 sales within ~0.75 mi
| Address | Dist | Beds/Ba | Sqft | Sold | Price | $/sf | Match |
|---|---|---|---|---|---|---|---|
| 107 Pamala Ct | 0.04mi | 3/2.0 | 1,312 (0%) | 9mo | $325,000 | $248 | 91 |
| 124 Pamala Ct | 0.04mi | 3/2.0 | 1,332 (+2%) | 20mo | $335,000 | $252 | 79 |
| 124 Brushcreek | 0.51mi | 3/2.0 | 1,306 (-0%) | 5mo | $355,000 | $272 | 71 |
| 1041 Vihlen Rd | 0.14mi | 3/2.0 | 1,388 (+6%) | 15mo | $355,000 | $256 | 71 |
| 107 Sandpebble Pl | 0.34mi | 3/2.0 | 1,462 (+11%) | 2mo | $415,000 | $284 | 63 |
| 185 Brushcreek Dr | 0.42mi | 3/2.5 | 1,462 (+11%) | 2mo | $370,000 | $253 | 58 |
| 123 Brushcreek Dr | 0.53mi | 3/2.0 | 1,263 (-4%) | 14mo | $339,900 | $269 | 57 |
| 318 Satsuma Dr | 0.71mi | 3/2.0 | 1,328 (+1%) | 16mo | $380,000 | $286 | 52 |
| 116 Carmel Bay Dr | 0.54mi | 3/2.0 | 1,424 (+8%) | 13mo | $340,000 | $239 | 50 |
| 142 Brushcreek Dr | 0.57mi | 3/2.0 | 1,462 (+11%) | 16mo | $393,000 | $269 | 41 |
| 109 Brushcreek Dr | 0.49mi | 3/2.0 | 1,462 (+11%) | 21mo | $375,000 | $256 | 40 |
| 214 Citrus Dr | 0.72mi | 4/2.0 (+1) | 1,505 (+15%) | 12mo | $325,000 | $216 | 27 |
Match score weights: distance 35% · size 25% · config 20% · recency 20%. Top-matched comps best support the ARV.
Projected returns pro-forma
-3.0% appreciation · 0.38% rent growth · sell at horizon
- IRR
- -20.1%
- Equity multiple
- 0.32×
- Total profit
- $-57,529
- Equity at exit
- $44,731
- IRR
- -19.2%
- Equity multiple
- 0.08×
- Total profit
- $-77,095
- Equity at exit
- $25,939
Cash invested: $84,000 (down + closing). Projections, not guarantees.
Landlord ↔ Tenant lean methodology
- Overall (STATE)
- 87 Strongly Landlord-Friendly
- State Florida
- 87 Strongly Landlord-Friendly · R+3
- County
- — inherits STATE
- City
- — inherits STATE
ZIP-level market 32771
- Rents YoY
- 0.4%
- Active inventory
- 561
- Price-to-rent
- 11.0×
Monthly cashflow live
- Estimated rent
- $2,273 high interval (Pro) →
- Mortgage (P&I)
- −$1,573
- Tax from tax record
- −$94 /mo · $1,132/yr
- Insurance
- −$125
- HOA
- −$50
- Vacancy / Maint / Mgmt
- −$477
- Net cashflow
- $-47
Break-even live
UW: 25.0% down · 7.5% · 30yr · 1.5% tax · 5.0% vac · 8.0% maint · 8.0% mgmt
Financing live
Cash to close
- Down payment
- $75,000
- Closing costs
- $9,000
- Reserves months
- —
- Total cash needed
- —
Loan-product check · same deal, 3 products live
Conventional
25% down · 7.5% · 30yr
- Down + closing
- —
- Monthly P&I
- —
- Monthly cashflow
- —
- DSCR
- —
- Eligible?
- —
Personal DTI + credit; lowest rate.
DSCR
20% down · 8.5% · 30yr
- Down + closing
- —
- Monthly P&I
- —
- Monthly cashflow
- —
- DSCR
- —
- Eligible?
- —
No personal income docs; deal must DSCR.
Hard money
10% down · 12.0% · 12mo
- Down + closing
- —
- Monthly P&I
- —
- Monthly cashflow
- —
- DSCR
- —
- Eligible?
- —
Short-term bridge; refi at stabilization.
Rent comps 29 comps
| Address | Beds | Baths | Sqft | Rent | $/sqft | DOM | Units | Dist |
|---|---|---|---|---|---|---|---|---|
| 250 Rustic Loop Sanford, FL | 3.0 | 3.5 | 1724 | $2,350 | $1.36 | 18d | 1 | 0.58mi |
| 1451 Travertine Ter Sanford, FL | 3.0 | 2.0 | 1386 | $2,095 | $1.51 | 12d | 1 | 0.68mi |
| 260 Evertree Loop Sanford, FL | 4.0 | 3.0 | 1745 | $2,600 | $1.49 | 11d | 1 | 0.72mi |
| 4101 Acorn Oak Cir Sanford, FL | 1.0–2.0 | 1.0–2.0 | 920 | $2,125 | $2.31 | 2d | 15 | 0.75mi |
| 110 Yorktown Pl Sanford, FL | 3.0 | 2.0 | 1281 | $2,319 | $1.81 | 5d | 1 | 0.81mi |
| 1000 Cardinal Cove Cir Sanford, FL | 1.0–3.0 | 1.0–2.0 | 997 | $2,445 | $2.45 | 2d | 26 | 0.84mi |
| 1151 Travertine Ter Sanford, FL | 3.0 | 2.5 | 1680 | $2,200 | $1.31 | 24d | 1 | 0.85mi |
| 1151 Travertine Ter Sanford, FL | 3.0 | 2.5 | 1680 | $2,200 | $1.31 | 20d | 1 | 0.85mi |
| 105 Cobblestone Way Sanford, FL | 3.0 | 2.0 | 1314 | $1,975 | $1.50 | 24d | 1 | 0.91mi |
| 305 Sunset Dr Sanford, FL | 4.0 | 2.0 | 1783 | $2,495 | $1.40 | 5d | 1 | 0.94mi |
| 2520 Retreat View Cir Sanford, FL | 3.0 | 2.5 | 1203 | $1,700 | $1.41 | 24d | 1 | 1.00mi |
| 4200 Symphony Cir Sanford, FL | 1.0–3.0 | 1.0–2.0 | 1090 | $2,917 | $2.68 | 12d | 24 | 1.01mi |
| 2015 Jones Ave Sanford, FL | 3.0 | 1.5 | 1291 | $1,895 | $1.47 | 12d | 1 | 1.03mi |
| 2006 Williams Ave Sanford, FL | 3.0 | 2.0 | 1546 | $3,200 | $2.07 | 5d | 1 | 1.04mi |
| 1161 Long Oak Way Sanford, FL | 3.0 | 2.5 | 1409 | $2,190 | $1.55 | 24d | 1 | 1.07mi |
| 2160 Retreat View Cir Sanford, FL | 3.0 | 2.5 | 1409 | $2,050 | $1.45 | 24d | 1 | 1.09mi |
| 1751 Rinehart Rd Sanford, FL | 1.0–3.0 | 1.0–2.0 | 1002 | $2,410 | $2.41 | 2d | 12 | 1.11mi |
| 12500 Solstice Loop Sanford, FL | 1.0–2.0 | 1.0–2.0 | 949 | $2,350 | $2.47 | 2d | 23 | 1.18mi |
| 4100 Geranium Ln Sanford, FL | 1.0–2.0 | 1.0–2.0 | 967 | $1,645 | $1.70 | 3d | 1 | 1.19mi |
| 2995 Railside Loop Sanford, FL | 1.0–3.0 | 1.0–2.0 | 961 | $2,458 | $2.56 | 5d | 21 | 1.20mi |
| 107 Quail Ridge Ct Sanford, FL | 3.0 | 2.0 | 1494 | $2,165 | $1.45 | 2d | 1 | 1.22mi |
| 3187 Emerald Acres Ln Sanford, FL | 3.0 | 2.5 | 1699 | $2,375 | $1.40 | 11d | 1 | 1.28mi |
| 2630 Cahill Way Lake Mary, FL | 3.0 | 2.0 | 1496 | $2,330 | $1.56 | 18d | 1 | 1.29mi |
| 3129 Emerald Acres Ln Sanford, FL | 3.0 | 2.5 | 1782 | $2,599 | $1.46 | 24d | 1 | 1.31mi |
| 11500 Myrtlewood Dr Sanford, FL | 1.0–3.0 | 1.0–2.0 | 907 | $2,233 | $2.46 | 2d | 33 | 1.31mi |
| 497 Brightview Dr Lake Mary, FL | 3.0 | 2.0 | 1535 | $2,300 | $1.50 | 11d | 1 | 1.34mi |
| 1514 Arbor Lakes Cir #1514 Sanford, FL | 3.0 | 2.0 | 1333 | $1,995 | $1.50 | 24d | 1 | 1.45mi |
| 2616 River Landing Dr Sanford, FL | 3.0 | 2.5 | 1642 | $2,190 | $1.33 | 24d | 1 | 1.46mi |
| 1000 Plantation Lakes Cir Sanford, FL | 1.0–3.0 | 1.0–2.0 | 1105 | $2,410 | $2.18 | 3d | 13 | 1.48mi |
HOA detail
- Monthly dues
- $50 · $600/yr
- Likely covers
- water
Listing history 6 events
-
2026-06-18days on market $300,000 Active 8 DOM
-
2026-06-17days on market $300,000 Active 7 DOM
-
2026-06-16days on market $300,000 Active 6 DOM
-
2026-06-15days on market $300,000 Active 5 DOM
-
2026-06-13remarks 445-char remark
-
2026-06-13$300,000 Active 3 DOM
ⓘ Source: listings_history table (triggers on properties + properties_extension) + one-shot
backfill from property_details.listing_events for pre-trigger history.
Tax reassessment forecast FL · Resets to sale price
- Current annual tax
- $1,132 · $94/mo
- Projected year-2 tax
- $2,490 · $208/mo
- Expected delta
- +$1,358/yr (+$113/mo · 120.0%)
ⓘ Screening estimate from a state-policy table — verify with the county assessor before closing.
Climate risk First Street
- Flood 1/10 Low FEMA zone X (unshaded) · 0% chance over 30 yrs
- Wildfire 1/10 Low
- Heat 9/10 Extreme 7 d/yr ≥108°F today · 21 d/yr by 30 yrs out
- Wind 9/10 Extreme 99% chance of damaging wind over 30 yrs
- Air quality 2/10 Low 1 unhealthy d/yr today · 1 by 30 yrs out
Nearby sold comps map
Loading sold comps map…
Walkable amenities ~0.75 mi
Loading nearby amenities…
Taxation est. · year 1
- Rental income
- $27,280
- − Mortgage interest
- −$16,805
- − Property taxes
- −$1,132
- − Insurance
- −$1,500
- − Repairs & maintenance
- −$2,182
- − Management
- −$2,182
- − HOA
- −$600
- − Depreciation
- −$8,727
- Taxable loss
- −$5,849
- Est. tax savings @ 24.0%
- +$1,404
- After-tax cash flow
- $844/yr
For passive investors: Depreciation is non-cash, so a rental often shows a tax loss while cash-flowing — sheltering income. Rental losses are passive: they offset passive income freely, and up to $25,000/yr can offset ordinary (W-2) income if you actively participate and your MAGI is under $100k (phasing out to $0 by $150k); unused losses carry forward. On sale, claimed depreciation is recaptured at up to 25%, and gains may owe capital-gains tax (a 1031 exchange can defer both). Figures are a year-1 estimate at your 24.0% rate — not tax advice; consult a CPA.
Schools (NCES district)
- District
- Seminole
- NCES district ID
- 1201710
- Math proficiency
- 57% ▼ -7.00%
- Reading proficiency
- 61% ▼ -1.00%
- Median HH income
- $58,478
- Composite
- 51.05/100
- National rank
- #1769
- State rank
- #13 of 73 in FL
Livability — Sanford
- Score
- 73/100
- State rank
- #316
- US rank
- #5359
Category grades
Schools grade is shown separately in the Schools card above.
Census & demographics
- Census place
- Sanford, FL
- County
- Seminole County · 436,154 people
- City population
- 96,638
- Metro
- Orlando-Kissimmee-Sanford, FL
- Population (ZIP)
- 62,606
- Household income
- $77,868
- Rent vs Own
- Severe rent burden
- 2645.0
Population outlook (Seminole County) Hauer SSP2
- Today (2025)
- 515,494 people
- By 2030
- 545,713 · +5.9%
- By 2040
- 598,068 · +16.0%
- By 2050
- 640,663 · +24.3%
- By 2075
- 724,461 · +40.5%
- By 2100
- 755,530 · +46.6%
Race, ethnicity, and origin ACS 2023
- Neighborhood character
- Diverse neighborhood (Simpson 0.70)
- Race & ethnicity
- White 43% Black 24% Hispanic / Latino 23% Two or more races 13% Asian 7%
- Hispanic origin (detail)
- Mexican 2% Puerto Rican 7% Cuban 2% Dominican 2%
- Common ancestry
- Romanian 2% Slovak 1% Italian 1%
- Foreign-born
- 18% · Canada, Jamaica, China
- Languages at home
- 76% English-only · Spanish 15% Other Indo-European 3% Other Asian/Pacific 1%
Political lean MEDSL · Seminole
- 2024 margin
- Toss-up / Even · D 47.6% · R 51.1% · Other 1.3%
- 2008→2024 swing
- -0.8pp no change · 2008: -2.8pp · 2024: -3.5pp
- All cycles
- 2024: R+3.5 2020: D+2.8 2016: R+1.6 2012: R+6.5 2008: R+2.8
Not yet ingested
- Civics
- —
Market trends
- HPI YoY
- ▼ -281.27%
- Current HPI
- 299.2738
- Rent YoY
- ▲ 0.38%
- Metro
- Orlando-Kissimmee-Sanford, FL
- State GDP YoY
- ▲ 3.28%
- F500 in state
- 36
Industry mix (Fortune 500 HQ in FL)
| Industry | F500 HQs | Revenue |
|---|---|---|
| Industrial Technology | 2 | $29B |
|
||
| Insurance | 2 | $17B |
|
||
| Retail | 1 | $60B |
|
||
| Technology Distribution | 1 | $58B |
|
||
| Homebuilding | 1 | $35B |
|
||
| Technology Manufacturing | 1 | $35B |
|
||
Price history
+733.3% since first listed7 events — show timeline
- 2026-06-10 Listed $300,000 Stellar MLS as Distributed by MLS Grid
- 2007-04-17 Sold (Public Records) $199,900 Public Records
- 2007-02-16 Sold (MLS) $199,900 Stellar MLS as Distributed by MLS Grid
- 2006-07-31 Listed $199,900 Stellar MLS as Distributed by MLS Grid
- 2000-04-07 Sold (Public Records) $86,600 Public Records
- 1997-11-03 Sold (Public Records) $82,900 Public Records
- 1996-05-03 Sold (Public Records) $36,000 Public Records
Property tax history
+2.6%/yrLatest (2025): $1,132 · +6.5% YoY. Source: county tax records.
Cash-flow waterfall
monthlySold comps — $/sqft
last 12 mo · ≤1 miLoading sold comps…