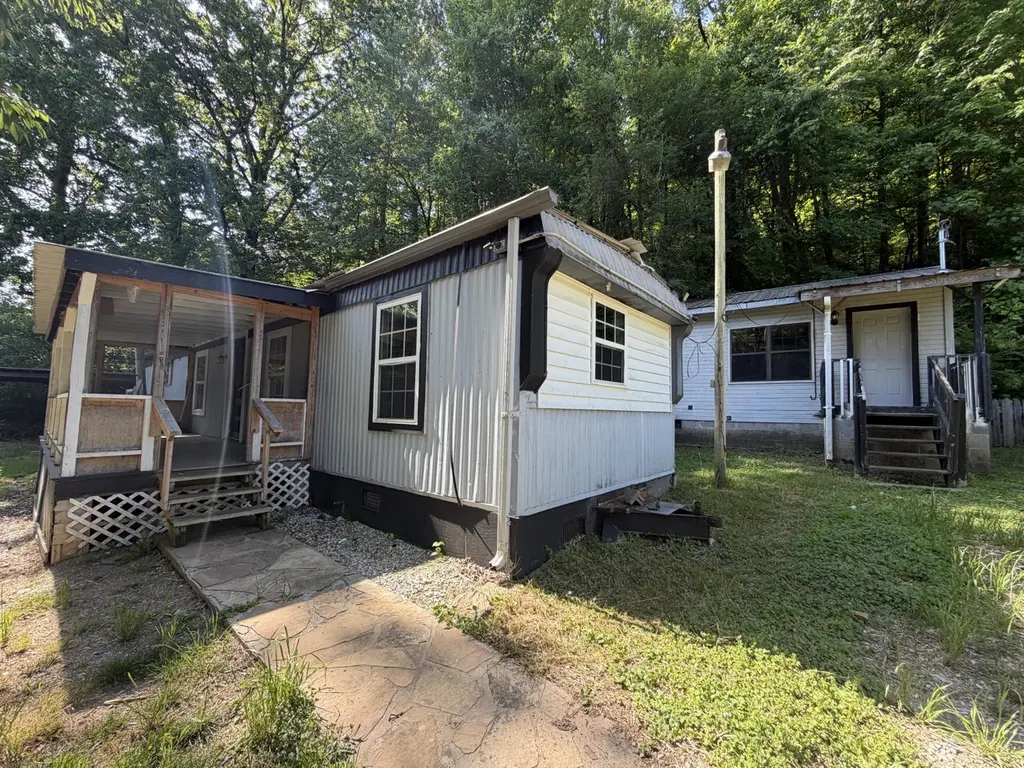
5417 Mccahill Rd · Chattanooga, TN
Flood risk 10/10 · Severe
- FEMA flood zone
- X (unshaded)
- Chance of flooding over 30 yrs
- 0.99%
- Est. flood insurance / yr
- $507 – $1,088
Fire risk 4/10 · Minor
- Est. fire insurance / yr
- $949 – $1,763
Heat risk 5/10 · Moderate
- Hot days now (above 104°F)
- 8 days/yr
- Hot days in 30 yrs
- 23 days/yr
Wind risk 4/10 · Minor
- Chance of severe wind over 30 yrs
- 10.0%
Air-quality risk 3/10 · Minor
- Unhealthy air days now
- 2 days/yr
- Unhealthy air days in 30 yrs
- 3 days/yr
Risk factors via First Street. Map © Google.
Why this score? — see what drove the B- grade
The composite is a weighted blend of 9 inputs, each scored 0–100. Each bar is that input's sub-score; the figure is the points it added to the 100-point composite (weight × sub-score).
- Cash flow +30.0/30.0
- DSCR +10.0/10.0
- 1% rule +8.7/10.0
- ARV discount +7.5/15.0
- Livability +3.9/5.0
- Schools +2.7/10.0
- Condition / age +2.5/5.0
- Rent growth +1.8/5.0
- Appreciation +0.0/10.0
$79,000
🖨 Deal sheet 📄 Offer letter ✓ Due diligence
Listing remarks MLS
PROPERTY SOLD AS-IS...Cash or private bank finance may be the only way to purchase. Buyer to verify school zone.
Key facts
- Storage room
- Outbuilding
- Double carport
Tags
Property features AI
Exterior
- Parking: Carport with 2 spaces; Driveway
- Utilities: Electricity connected; Water connected; Septic tank
- Home design: Single-family residence; One story; Fixer condition
- Construction: Metal siding and wood siding; Block foundation; Metal roof; Built on crawl space
- Exterior features: Covered front porch; Outbuilding; Additional storage
Interior
- Kitchen: Electric range
- Bedrooms: 9 total rooms (bedroom count not specified)
- Flooring: Tile
- Bathrooms: 2 full bathrooms; 1 half bathroom
- Heating & cooling: Central heating; Central air; Electric cooling
- Interior features: Eat-in kitchen; Storage
- Laundry & utility: Water connected
Neighborhood map
What this means for you Summary
Snapshot
- This is a 2-bed/2.5-bath single-family listed at $79k.
Deal economics
- At list price, monthly cash flow is $317 ($4k/yr) — positive.
- The deal already cash-flows at list — no discount required.
- Meets the 1% rule at list price ($1k rent vs $79k).
- Recommended offer: $78k (1.5% below list) — sets the bar for market timing.
- Cap rate 12.1% vs local median 3.4% in Chattanooga — top-decile yield for the area; either an underpriced asset or a hidden risk that comps aren't pricing in. Stress-test before assuming the spread holds.
Location & tenants
- Location reads 78/100 on livability (#3 in TN, #2,582 nationally) — a middle-class / working-renter tenant base. Strengths: amenities A+, commute A+, cost of living A+; Watch: employment D+, crime F.
- Hamilton County (urban): math 31% / reading 31% proficiency, ranked #42 of 139 in TN (top 30%) — families likely to look elsewhere, expect single-tenant / working-renter base with shorter leases.
- Zoned schools: Alpine Crest Elementary (math 52% / reading 37%, grade F, #164 of 952 statewide, top 19%, 319 students, 0% FRL); Red Bank Middle School (math 14% / reading 13%, grade F, #236 of 333 statewide, top 71%, 535 students, 0% FRL); Red Bank High School (math 8% / reading 37%, grade F, #156 of 332 statewide, top 49%, 824 students, 0% FRL) — zoned schools average 0% FRL vs 52% district-wide (52 pts lower); this property's tenant base skews higher-income than the district average.
- Market conditions: Rents soft (-2.9%/yr); 183 active listings in the ZIP; 2,133 units permitted in Hamilton County in 2024 (405 in 5+ unit buildings).
Forward outlook
- Local home prices are declining (-3.0%/yr); year-one equity from $546 of loan paydown is wiped out by about $2k of value loss. Plan a longer hold.
- Hamilton County population projected at +23% by 2050 — long-run rental-demand tailwind backs the buy-and-hold thesis.
- At projected returns (-3.0% appreciation + 0.0% rent growth), your $22k cash investment doubles in ~10 years — after that, you're playing with house money.
Negotiation context
- It's been on market 15 days — a 2% lower offer ($78k) is reasonable based on typical stale-listing flexibility.
- 2 sale attempts since 17y ago; this cycle's ask has dropped $26k (25%) from the opening price — seller is motivated, your offer sets the floor, not the list.
- Current owner paid $45k; list at $79k implies a 76% gain — meaningful room to come down on a strong offer.
Risks & watch-outs
- Watch-outs: flood insurance adds $66/mo.
- Climate carrying-cost: severe flood risk; extreme-heat days projected 8→23/yr by 2055 (HVAC capex compounding) — expect insurance premiums to compound above CPI over the hold.
Questions for the listing agent
- What's the actual annual flood-insurance premium (NFIP or private), and is the property in a SFHA with mandatory coverage?
- Is there a deadline driving the sale (1031 exchange, divorce, estate, relocation)? That informs how much negotiation room exists.
- Schools are F-rated, which usually means shorter tenancies and higher turnover. Who's the typical renter profile here, and what's been the actual vacancy rate?
- Crime grade is F in this area — have there been break-ins, vandalism, or insurance claims at this property in the last 3 years? What carrier currently insures it and at what premium?
- What's the average days-on-market for RENTAL listings here right now (not sales)? A rising rental-DOM trend means longer vacancies and softer asking-rent achievability than the comps imply.
- What's the recent tenant-quality profile in this submarket — average credit score on applications, eviction rate, late-payment / NSF rate, and stable-employment percentage? A property-management company in the area should have these aggregated.
- How much new for-sale + rental construction is in the pipeline within 1–3 miles? Heavy new supply typically softens prices + rents 12–24 months out; constrained supply supports both.
Investment metrics
- 1% rule
- 1.37% ✓
- Cap rate
- 12.12%
- Cash-on-cash
- 20.79%
- DSCR
- 1.93
- GRM
- 6.1
CMA / ARV
No comps found within radius.
Projected returns pro-forma
-3.0% appreciation · 0.0% rent growth · sell at horizon
- IRR
- 5.1%
- Equity multiple
- 1.19×
- Total profit
- $4,211
- Equity at exit
- $11,779
- IRR
- 11.6%
- Equity multiple
- 1.79×
- Total profit
- $17,414
- Equity at exit
- $6,830
Cash invested: $22,120 (down + closing). Projections, not guarantees.
Landlord ↔ Tenant lean methodology
- Overall (STATE)
- 87 Strongly Landlord-Friendly
- State Tennessee
- 87 Strongly Landlord-Friendly · R+13
- County
- — inherits STATE
- City
- — inherits STATE
ZIP-level market 37415
- Rents YoY
- -2.9%
- Active inventory
- 183
- Price-to-rent
- 6.1×
Monthly cashflow live
- Estimated rent
- $1,085 medium interval (Pro) →
- Mortgage (P&I)
- −$414
- Tax from tax record
- −$27 /mo · $321/yr
- Insurance
- −$33
- Flood insurance flood zone
- −$66 /mo · $798/yr
- HOA
- −$0
- Vacancy / Maint / Mgmt
- −$228
- Net cashflow
- $317
Break-even live
UW: 25.0% down · 7.5% · 30yr · 1.5% tax · 5.0% vac · 8.0% maint · 8.0% mgmt
Financing live
Cash to close
- Down payment
- $19,750
- Closing costs
- $2,370
- Reserves months
- —
- Total cash needed
- —
Loan-product check · same deal, 3 products live
Conventional
25% down · 7.5% · 30yr
- Down + closing
- —
- Monthly P&I
- —
- Monthly cashflow
- —
- DSCR
- —
- Eligible?
- —
Personal DTI + credit; lowest rate.
DSCR
20% down · 8.5% · 30yr
- Down + closing
- —
- Monthly P&I
- —
- Monthly cashflow
- —
- DSCR
- —
- Eligible?
- —
No personal income docs; deal must DSCR.
Hard money
10% down · 12.0% · 12mo
- Down + closing
- —
- Monthly P&I
- —
- Monthly cashflow
- —
- DSCR
- —
- Eligible?
- —
Short-term bridge; refi at stabilization.
Listing history 19 events
-
2026-06-18days on market $79,000 Active 15 DOM
-
2026-06-17days on market $79,000 Active 14 DOM
-
2026-06-16days on market $79,000 Active 13 DOM
-
2026-06-15days on market $79,000 Active 12 DOM
-
2026-06-14days on market $79,000 Active 10 DOM
-
2026-06-10days on market $79,000 Active 7 DOM
-
2026-06-09days on market $79,000 Active 6 DOM
-
2026-06-08days on market $79,000 Active 5 DOM
-
2026-06-07days on market $79,000 Active 4 DOM
-
2026-06-03days on market $79,000 Active 1 DOM
-
2026-06-02pricedays on market $79,000 Active 29 DOM
-
2026-06-01days on market $89,900 Active 28 DOM
-
2026-05-31days on market $89,900 Active 27 DOM
-
2026-05-30days on market $89,900 Active 26 DOM
-
2026-05-14price $89,900
-
2026-05-04$105,000 Active
-
2026-03-05soldstatus $45,000
-
2012-09-28soldstatus $18,500 112-char remark
Show marketing remark (112 chars)
PROPERTY SOLD AS-IS...Cash or private bank finance may be the only way to purchase. Buyer to verify school zone.
-
2009-05-14$32,000
ⓘ Source: listings_history table (triggers on properties + properties_extension) + one-shot
backfill from property_details.listing_events for pre-trigger history.
Tax reassessment forecast TN · Resets to sale price
- Current annual tax
- $321 · $27/mo
- Projected year-2 tax
- $561 · $47/mo
- Expected delta
- +$240/yr (+$20/mo · 74.6%)
ⓘ Screening estimate from a state-policy table — verify with the county assessor before closing.
Climate risk First Street
- Flood 10/10 Extreme FEMA zone X (unshaded) · 99% chance over 30 yrs
- Wildfire 4/10 Moderate
- Heat 5/10 Major 8 d/yr ≥104°F today · 23 d/yr by 30 yrs out
- Wind 4/10 Moderate 10% chance of damaging wind over 30 yrs
- Air quality 3/10 Moderate 2 unhealthy d/yr today · 3 by 30 yrs out
Nearby sold comps map
Loading sold comps map…
Walkable amenities ~0.75 mi
Loading nearby amenities…
Taxation est. · year 1
- Rental income
- $13,022
- − Mortgage interest
- −$4,425
- − Property taxes
- −$321
- − Insurance
- −$1,192
- − Repairs & maintenance
- −$1,042
- − Management
- −$1,042
- − Depreciation
- −$2,298
- Taxable income
- $2,701
- Est. tax owed @ 24.0%
- −$648
- After-tax cash flow
- $3,154/yr
For passive investors: Depreciation is non-cash, so a rental often shows a tax loss while cash-flowing — sheltering income. Rental losses are passive: they offset passive income freely, and up to $25,000/yr can offset ordinary (W-2) income if you actively participate and your MAGI is under $100k (phasing out to $0 by $150k); unused losses carry forward. On sale, claimed depreciation is recaptured at up to 25%, and gains may owe capital-gains tax (a 1031 exchange can defer both). Figures are a year-1 estimate at your 24.0% rate — not tax advice; consult a CPA.
Schools (NCES district)
- District
- Hamilton County
- NCES district ID
- 4701590
- Math proficiency
- 31% ▼ -10.00%
- Reading proficiency
- 31% ▼ -3.00%
- Median HH income
- $47,456
- Composite
- 26.8/100
- National rank
- #7122
- State rank
- #42 of 139 in TN
Livability — Chattanooga
- Score
- 78/100
- State rank
- #3
- US rank
- #2582
Category grades
Schools grade is shown separately in the Schools card above.
Census & demographics
- Census place
- Chattanooga, TN
- County
- Hamilton County · 312,777 people
- City population
- 131,999
- Metro
- Chattanooga, TN-GA
- Population (ZIP)
- 24,181
- Household income
- $70,972
- Rent vs Own
- Severe rent burden
- 882.0
Population outlook (Hamilton County) Hauer SSP2
- Today (2025)
- 393,784 people
- By 2030
- 412,983 · +4.9%
- By 2040
- 449,502 · +14.1%
- By 2050
- 484,341 · +23.0%
- By 2075
- 565,746 · +43.7%
- By 2100
- 618,394 · +57.0%
Race, ethnicity, and origin ACS 2023
- Neighborhood character
- Predominantly White (83%)
- Race & ethnicity
- White 83% Black 9% Two or more races 5% Hispanic / Latino 4%
- Common ancestry
- Italian 4% Slovak 3% Lithuanian 2%
- Foreign-born
- 3% · Canada
- Languages at home
- 95% English-only · Spanish 2% Tagalog/Filipino 1% French/Haitian/Cajun 1%
Political lean MEDSL · Hamilton
- 2024 margin
- R (+13.1) · D 42.7% · R 55.7% · Other 1.6%
- 2008→2024 swing
- -1.2pp toward R · 2008: -11.8pp · 2024: -13.1pp
- All cycles
- 2024: R+13.1 2020: R+9.7 2016: R+16.6 2012: R+14.8 2008: R+11.8
Not yet ingested
- Civics
- —
Market trends
- HPI YoY
- ▼ -229.83%
- Current HPI
- 272.075
- Rent YoY
- ▼ -2.85%
- Metro
- Chattanooga, TN-GA
- State GDP YoY
- ▲ 2.78%
- F500 in state
- 22
Industry mix (Fortune 500 HQ in TN)
| Industry | F500 HQs | Revenue |
|---|---|---|
| Healthcare | 3 | $91B |
|
||
| Retail | 3 | $72B |
|
||
| Transportation / Logistics | 1 | $88B |
|
||
| Paper / Packaging | 1 | $19B |
|
||
| Insurance | 1 | $13B |
|
||
| Energy | 1 | $12B |
|
||
Price history
+180.9% since first listed5 events — show timeline
- 2026-05-14 Price Changed $89,900 GCAR
- 2026-05-04 Listed $105,000 GCAR
- 2026-03-05 Sold (Public Records) $45,000 Public Records
- 2012-09-28 Sold (MLS) $18,500 GCAR
- 2009-05-14 Listed $32,000 RCAOR
Property tax history
+0.1%/yrLatest (2025): $321 · -0.6% YoY. Source: county tax records.
Cash-flow waterfall
monthlySold comps — $/sqft
last 12 mo · ≤1 miLoading sold comps…