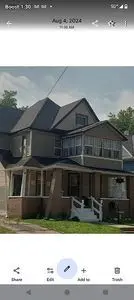
827 Geneva Ave SE · Grand Rapids, MI
Flood risk 1/10 · Minimal
- FEMA flood zone
- X (unshaded)
- Chance of flooding over 30 yrs
- 0.0%
- Est. flood insurance / yr
- $473 – $860
Fire risk 1/10 · Minimal
- Est. fire insurance / yr
- $784 – $1,456
Heat risk 2/10 · Minimal
- Hot days now (above 96°F)
- 7 days/yr
- Hot days in 30 yrs
- 16 days/yr
Wind risk 2/10 · Minimal
- Chance of severe wind over 30 yrs
- —
Air-quality risk 2/10 · Minimal
- Unhealthy air days now
- 2 days/yr
- Unhealthy air days in 30 yrs
- 2 days/yr
Risk factors via First Street. Map © Google.
Why this score? — see what drove the D+ grade
The composite is a weighted blend of 9 inputs, each scored 0–100. Each bar is that input's sub-score; the figure is the points it added to the 100-point composite (weight × sub-score).
- Cash flow +16.7/30.0
- ARV discount +7.5/15.0
- DSCR +5.2/10.0
- Livability +4.2/5.0
- Rent growth +3.7/5.0
- 1% rule +3.6/10.0
- Condition / age +2.5/5.0
- Schools +1.9/10.0
- Appreciation +0.0/10.0
$315,000
🖨 Deal sheet 📄 Offer letter ✓ Due diligence
Listing remarks
Classic 1900 multi-family home in the heart of 49507 area. Perfect for an investment or a spacious residence. This Boasting 2,057 sq ft of living space 4-6 bedrooms, 2 bathrooms. Unit One - 2/1 with living room, dining room and basement area washer/dryer hookup and 2 additional storage areas. Unit Two- 2-4/1 with Living room, dining room, 2 enclosed porches and an attic w/ 2 possible unfinished rooms. Private Driveway and large backyard for entertaining. Property is perfect for investors or those seeking a sprawling single family residence. Features include a large 6,600 square foot lot and a highly accessible locations walking distance to MLK community center w/ large community pool, a few
Key facts
- Enclosed porches
- Living space
- Private driveway
Tags
Property features AI
Finance
- Other: Living area approximately 2,066
- Financial info: Financial details not provided
- HOA & community: HOA or community fee information not provided
Exterior
- Parking: Parking details not provided
- Security: Security features not provided
- Utilities: Utility details not provided
- Home design: Built in 1900
- Construction: Construction details not provided
- Exterior features: Located in the South East End subdivision
Interior
- Kitchen: Kitchen details not provided
- Bedrooms: Bedroom count not provided
- Flooring: Flooring details not provided
- Bathrooms: Bathroom count not provided
- Heating & cooling: Heating and cooling details not provided
- Interior features: No interior feature details available
- Laundry & utility: Laundry and utility details not provided
Neighborhood map
What this means for you Summary
Snapshot
- This is a 6-bed/2.0-bath single-family listed at $315k.
Deal economics
- At list price, monthly cash flow is $196 ($2k/yr) — positive.
- The deal already cash-flows at list — no discount required.
- To meet the 1% rule (rent ≥ 1% of price), the offer needs to be $272k (13.7% below list).
- Recommended offer: $272k (13.7% below list) — sets the bar for 1% rule.
- Cap rate 7.0% vs local median 4.5% in Grand Rapids — top-decile yield for the area; either an underpriced asset or a hidden risk that comps aren't pricing in. Stress-test before assuming the spread holds.
Location & tenants
- Location reads 83/100 on livability (#44 in MI, #939 nationally) — a professional / high-income tenant draw. Strengths: amenities A+, commute A+, cost of living A+; Watch: employment C-, crime F.
- Grand Rapids Public Schools (urban): math 15% / reading 29% proficiency, ranked #451 of 540 in MI (top 84%) — low school quality limits family demand, transient renter base, plan for 1-2y turnover; 80% free/reduced lunch — lower-income household profile, screen leases tightly.
- Market conditions: Rents rising fast (+4.7%/yr); 178 active listings in the ZIP; 2 comparable units currently listed for rent nearby; 2,253 units permitted in Kent County in 2024 (969 in 5+ unit buildings).
- At $2,718/mo this rent would consume 53% of the median local household income ($61k/yr) (locally 1625% of renters already pay >50% of income on rent) — very limited rent-growth headroom before tenants either downsize or default.
Forward outlook
- Local home prices are declining (-3.0%/yr); year-one equity from $2k of loan paydown is wiped out by about $9k of value loss. Plan a longer hold.
- Kent County population projected at +22% by 2050 — long-run rental-demand tailwind backs the buy-and-hold thesis.
Negotiation context
- Only 14 days on market — expect competitive offers; lowballing is unlikely to land.
- 3 sale attempts since 17y ago with the ask held roughly flat each time — persistent listings suggest the price (not the market) is what's stuck; bring a comps-based counter.
Risks & watch-outs
- Watch-outs: built in 1900 — expect roof / HVAC / electrical / plumbing capex.
Questions for the listing agent
- Built in 1900 — when were the roof, HVAC, electrical panel, plumbing, and water heater last replaced?
- Is there a deadline driving the sale (1031 exchange, divorce, estate, relocation)? That informs how much negotiation room exists.
- Crime grade is F in this area — have there been break-ins, vandalism, or insurance claims at this property in the last 3 years? What carrier currently insures it and at what premium?
- The area grade is low — what's the realistic commute time and amenity access for the typical tenant pool here? Any planned neighborhood developments (good or bad) we should know about?
- What's the average days-on-market for RENTAL listings here right now (not sales)? A rising rental-DOM trend means longer vacancies and softer asking-rent achievability than the comps imply.
- What's the recent tenant-quality profile in this submarket — average credit score on applications, eviction rate, late-payment / NSF rate, and stable-employment percentage? A property-management company in the area should have these aggregated.
- How much new for-sale + rental construction is in the pipeline within 1–3 miles? Heavy new supply typically softens prices + rents 12–24 months out; constrained supply supports both.
Investment metrics
- 1% rule
- 0.86% ✗
- Cap rate
- 7.04%
- Cash-on-cash
- 2.66%
- DSCR
- 1.12
- GRM
- 9.7
CMA / ARV
No comps found within radius.
Projected returns pro-forma
-3.0% appreciation · 4.74% rent growth · sell at horizon
- IRR
- -10.4%
- Equity multiple
- 0.62×
- Total profit
- $-33,831
- Equity at exit
- $46,968
- IRR
- 1.0%
- Equity multiple
- 1.08×
- Total profit
- $6,786
- Equity at exit
- $27,235
Cash invested: $88,200 (down + closing). Projections, not guarantees.
Landlord ↔ Tenant lean methodology
- Overall (STATE)
- 62 Landlord-Friendly
- State Michigan
- 62 Landlord-Friendly · EVEN
- County
- — inherits STATE
- City
- — inherits STATE
ZIP-level market 49507
- Rents YoY
- 4.7%
- Active inventory
- 178
- Price-to-rent
- 9.7×
Monthly cashflow live
- Estimated rent
- $2,718 medium interval (Pro) →
- Mortgage (P&I)
- −$1,652
- Tax from tax record
- −$169 /mo · $2,024/yr
- Insurance
- −$131
- HOA
- −$0
- Vacancy / Maint / Mgmt
- −$571
- Net cashflow
- $196
Break-even live
UW: 25.0% down · 7.5% · 30yr · 1.5% tax · 5.0% vac · 8.0% maint · 8.0% mgmt
Financing live
Cash to close
- Down payment
- $78,750
- Closing costs
- $9,450
- Reserves months
- —
- Total cash needed
- —
Loan-product check · same deal, 3 products live
Conventional
25% down · 7.5% · 30yr
- Down + closing
- —
- Monthly P&I
- —
- Monthly cashflow
- —
- DSCR
- —
- Eligible?
- —
Personal DTI + credit; lowest rate.
DSCR
20% down · 8.5% · 30yr
- Down + closing
- —
- Monthly P&I
- —
- Monthly cashflow
- —
- DSCR
- —
- Eligible?
- —
No personal income docs; deal must DSCR.
Hard money
10% down · 12.0% · 12mo
- Down + closing
- —
- Monthly P&I
- —
- Monthly cashflow
- —
- DSCR
- —
- Eligible?
- —
Short-term bridge; refi at stabilization.
Rent comps 2 comps
| Address | Beds | Baths | Sqft | Rent | $/sqft | DOM | Units | Dist |
|---|---|---|---|---|---|---|---|---|
| 1154 Prospect Ave SE Grand Rapids, MI | 5.0 | 2.0 | 1800 | $2,300 | $1.28 | 44d | 1 | 0.73mi |
| 117 Fuller Ave NE Grand Rapids, MI | 6.0 | 2.5 | 2160 | $3,150 | $1.46 | 44d | 1 | 1.28mi |
Listing history 21 events
-
2026-06-18days on market $315,000 Active 14 DOM
-
2026-06-17days on market $315,000 Active 13 DOM
-
2026-06-16days on market $315,000 Active 12 DOM
-
2026-06-15$315,000 Active 11 DOM
-
2026-06-15days on market $315,000 Active 11 DOM
-
2026-06-14days on market $315,000 Active 9 DOM
-
2026-06-13days on market $315,000 Active 8 DOM
-
2026-06-10days on market $315,000 Active 6 DOM
-
2026-06-09days on market $315,000 Active 5 DOM
-
2026-06-08days on market $315,000 Active 4 DOM
-
2026-06-07days on market $315,000 Active 3 DOM
-
2026-06-05pricedays on market $315,000 Active 1 DOM
-
2026-06-03days on market $325,000 Active 12 DOM
-
2026-06-03days on market $325,000 Active 11 DOM
-
2026-06-01days on market $325,000 Active 10 DOM
-
2026-05-31days on market $325,000 Active 9 DOM
-
2026-05-23$325,000 Active
-
2015-03-18historical
-
2009-11-05historical
-
2009-10-05$12,900
-
2009-10-05$12,900
ⓘ Source: listings_history table (triggers on properties + properties_extension) + one-shot
backfill from property_details.listing_events for pre-trigger history.
Tax reassessment forecast MI · Partial reset (capped growth)
- Current annual tax
- $2,024 · $169/mo
- Projected year-2 tax
- $3,437 · $286/mo
- Expected delta
- +$1,414/yr (+$118/mo · 69.9%)
ⓘ Screening estimate from a state-policy table — verify with the county assessor before closing.
Climate risk First Street
- Flood 1/10 Low FEMA zone X (unshaded) · 0% chance over 30 yrs
- Wildfire 1/10 Low
- Heat 2/10 Low 7 d/yr ≥96°F today · 16 d/yr by 30 yrs out
- Wind 2/10 Low
- Air quality 2/10 Low 2 unhealthy d/yr today · 2 by 30 yrs out
Nearby sold comps map
Loading sold comps map…
Walkable amenities ~0.75 mi
Loading nearby amenities…
Taxation est. · year 1
- Rental income
- $32,621
- − Mortgage interest
- −$17,645
- − Property taxes
- −$2,024
- − Insurance
- −$1,575
- − Repairs & maintenance
- −$2,610
- − Management
- −$2,610
- − Depreciation
- −$9,164
- Taxable loss
- −$3,006
- Est. tax savings @ 24.0%
- +$721
- After-tax cash flow
- $3,070/yr
For passive investors: Depreciation is non-cash, so a rental often shows a tax loss while cash-flowing — sheltering income. Rental losses are passive: they offset passive income freely, and up to $25,000/yr can offset ordinary (W-2) income if you actively participate and your MAGI is under $100k (phasing out to $0 by $150k); unused losses carry forward. On sale, claimed depreciation is recaptured at up to 25%, and gains may owe capital-gains tax (a 1031 exchange can defer both). Figures are a year-1 estimate at your 24.0% rate — not tax advice; consult a CPA.
Schools (NCES district)
- District
- Grand Rapids Public Schools
- NCES district ID
- 2616440
- Math proficiency
- 15% ▼ -5.00%
- Reading proficiency
- 29% ▼ -1.00%
- Median HH income
- $40,612
- Composite
- 18.62/100
- National rank
- #8899
- State rank
- #451 of 540 in MI
Livability — Grand Rapids
- Score
- 83/100
- State rank
- #44
- US rank
- #939
Category grades
Schools grade is shown separately in the Schools card above.
Census & demographics
- Census place
- Grand Rapids, MI
- County
- Kent County · 533,805 people
- City population
- 181,325
- Metro
- Grand Rapids-Kentwood, MI
- Population (ZIP)
- 38,487
- Household income
- $61,461
- Rent vs Own
- Severe rent burden
- 1625.0
Population outlook (Kent County) Hauer SSP2
- Today (2025)
- 712,484 people
- By 2030
- 748,618 · +5.1%
- By 2040
- 814,777 · +14.4%
- By 2050
- 868,556 · +21.9%
- By 2075
- 966,487 · +35.7%
- By 2100
- 967,975 · +35.9%
Race, ethnicity, and origin ACS 2023
- Neighborhood character
- Highly diverse neighborhood (Simpson 0.71)
- Race & ethnicity
- Hispanic / Latino 31% Black 31% White 30% Two or more races 21%
- Hispanic origin (detail)
- Mexican 18% Puerto Rican 3% Dominican 1%
- Common ancestry
- Iranian 8% Romanian 2% Lithuanian 1%
- Foreign-born
- 18% · Canada
- Languages at home
- 71% English-only · Spanish 23% Arabic 1% Other Indo-European 1%
Political lean MEDSL · Kent
- 2024 margin
- Lean D (+5.4) · D 51.8% · R 46.5% · Other 1.7%
- 2008→2024 swing
- +4.8pp toward D · 2008: 0.5pp · 2024: 5.4pp
- All cycles
- 2024: D+5.4 2020: D+6.1 2016: R+3.1 2012: R+7.9 2008: D+0.5
Not yet ingested
- Civics
- —
Market trends
- HPI YoY
- ▼ -301.99%
- Current HPI
- 325.3878
- Rent YoY
- ▲ 4.74%
- Metro
- Grand Rapids-Kentwood, MI
- State GDP YoY
- ▲ 1.37%
- F500 in state
- 28
Industry mix (Fortune 500 HQ in MI)
| Industry | F500 HQs | Revenue |
|---|---|---|
| Automotive Parts | 3 | $48B |
|
||
| Automotive | 2 | $372B |
|
||
| Chemicals | 1 | $45B |
|
||
| Automotive Retail | 1 | $29B |
|
||
| Healthcare / Medical Devices | 1 | $23B |
|
||
| Automotive Technology | 1 | $20B |
|
||
Price history
+2419.4% since first listed5 events — show timeline
- 2026-05-23 Listed $325,000 FSBO.com
- 2015-03-18 Listing Removed — SW Michigan MLS
- 2009-11-05 Listing Removed — REALCOMP
- 2009-10-05 Listed $12,900 REALCOMP
- 2009-10-05 Listed $12,900 SW Michigan MLS
Property tax history
-0.3%/yrLatest (2025): $2,024 · -16.9% YoY. Source: county tax records.
Cash-flow waterfall
monthlySold comps — $/sqft
last 12 mo · ≤1 miLoading sold comps…