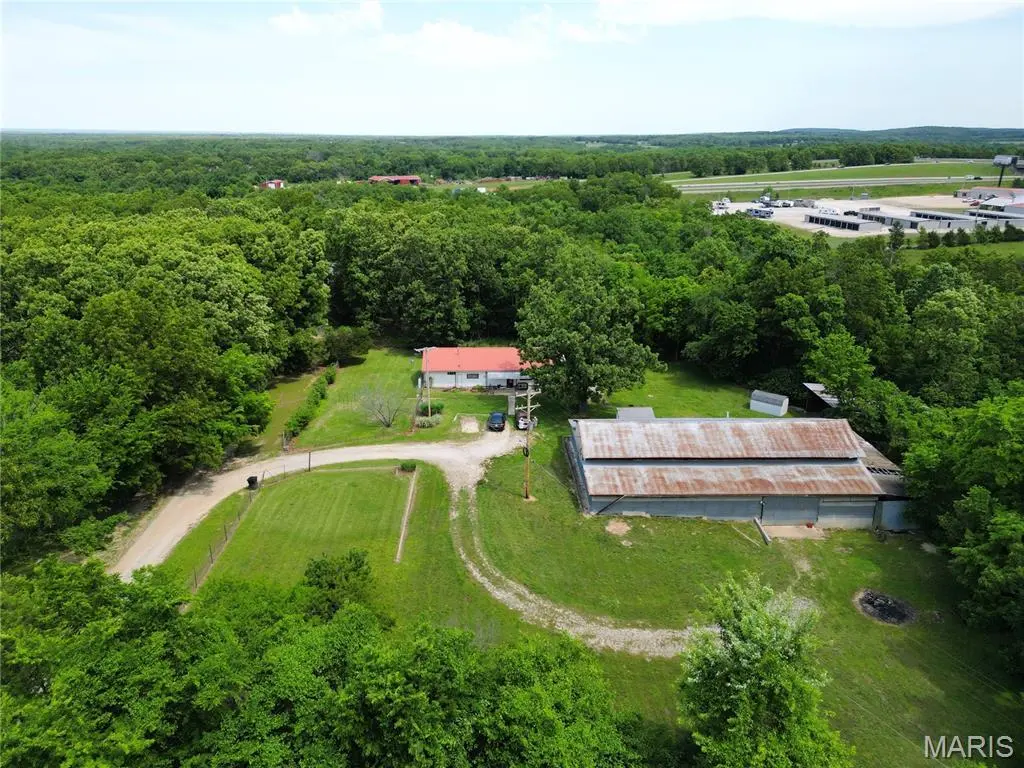
425 Eisenhower St · Doolittle, MO
Flood risk 1/10 · Minimal
- FEMA flood zone
- X (unshaded)
- Chance of flooding over 30 yrs
- 0.0%
- Est. flood insurance / yr
- $507 – $1,088
Fire risk 5/10 · Moderate
- Est. fire insurance / yr
- $1,054 – $1,958
Heat risk 4/10 · Minor
- Hot days now (above 106°F)
- 7 days/yr
- Hot days in 30 yrs
- 19 days/yr
Wind risk 2/10 · Minimal
- Chance of severe wind over 30 yrs
- —
Air-quality risk 2/10 · Minimal
- Unhealthy air days now
- 0 days/yr
- Unhealthy air days in 30 yrs
- 1 days/yr
Risk factors via First Street. Map © Google.
Why this score? — see what drove the D grade
The composite is a weighted blend of 9 inputs, each scored 0–100. Each bar is that input's sub-score; the figure is the points it added to the 100-point composite (weight × sub-score).
- Cash flow +15.7/30.0
- ARV discount +7.5/15.0
- Rent growth +5.0/5.0
- DSCR +4.9/10.0
- 1% rule +3.0/10.0
- Livability +2.8/5.0
- Condition / age +2.5/5.0
- Schools +1.8/10.0
- Appreciation +0.0/10.0
$179,000
🖨 Deal sheet (PDF) 📄 Offer letter ✓ Due diligence
Key facts
- 3.98 acre lot
- 6 garage spots
- Built 1967
Property features AI
Finance
- Other: Property type: Residential (Single Family Residence); Above-grade finished area reported as 1,568 (assessor); Lot size about 3.98 acres
- Financial info: Lease not considered; No second mortgage indicated
Exterior
- Parking: Garage with 6 spaces
- Utilities: Private well water; Public sewer; 220-volt electric service; Cable connected; Electricity connected; Sewer connected; Water connected
- Home design: Single-family residence; One story; Private ownership
- Construction: Metal roof; Construction materials: Unknown
- Exterior features: Adjoins wooded area; Located on a cul-de-sac; Pole barn; Additional garage structures
Interior
- Kitchen: Microwave; Oven; Range; Refrigerator
- Bedrooms: Four bedrooms (all on the main level)
- Bathrooms: Two full bathrooms (on the main level)
- Interior features: Central air conditioning; Other heating
- Laundry & utility: Main-level laundry
Neighborhood map
What this means for you Summary
Snapshot
- This is a 4-bed/2.0-bath manufactured listed at $179k.
Deal economics
- At list price, monthly cash flow is $80 ($963/yr) — positive.
- The deal already cash-flows at list — no discount required.
- To meet the 1% rule (rent ≥ 1% of price), the offer needs to be $144k (19.8% below list).
- Recommended offer: $144k (19.8% below list) — sets the bar for 1% rule.
Location & tenants
- Location reads 56/100 on livability (#687 in MO) — a working-class tenant base; expect higher turnover. Strengths: cost of living A+, housing A+; Watch: crime F, amenities F, commute F.
- Newburg R-II (rural): math 15% / reading 28% proficiency, ranked #299 of 324 in MO (top 92%) — low school quality limits family demand, transient renter base, plan for 1-2y turnover.
- Zoned schools: Newburg Elem. (math 17% / reading 22%, grade F, #941 of 1,115 statewide, top 86%, 194 students, 66% FRL); Newburg High (math 12% / reading 32%, grade F, #462 of 521 statewide, top 90%, 208 students, 55% FRL).
- Market conditions: Rents rising fast (+10.2%/yr); 271 active listings in the ZIP; 162 units permitted in Phelps County in 2024 (83 in 5+ unit buildings).
- This rent runs 31% of the median local income ($56k/yr) — at the standard rent-burdened threshold; future hikes will face affordability resistance.
Forward outlook
- Local home prices are declining (-3.0%/yr); year-one equity from $1k of loan paydown is wiped out by about $5k of value loss. Plan a longer hold.
- Phelps County population projected at -12% by 2050 — secular population decline; favor cash flow + early exit over multi-decade hold.
Negotiation context
- Only 14 days on market — expect competitive offers; lowballing is unlikely to land.
Risks & watch-outs
- Climate carrying-cost: moderate wildfire risk — expect insurance premiums to compound above CPI over the hold.
Questions for the listing agent
- Built in 1967 — when were the roof, HVAC, electrical panel, plumbing, and water heater last replaced?
- Is there a deadline driving the sale (1031 exchange, divorce, estate, relocation)? That informs how much negotiation room exists.
- Schools are F-rated, which usually means shorter tenancies and higher turnover. Who's the typical renter profile here, and what's been the actual vacancy rate?
- Crime grade is F in this area — have there been break-ins, vandalism, or insurance claims at this property in the last 3 years? What carrier currently insures it and at what premium?
- The area grade is low — what's the realistic commute time and amenity access for the typical tenant pool here? Any planned neighborhood developments (good or bad) we should know about?
- What's the average days-on-market for RENTAL listings here right now (not sales)? A rising rental-DOM trend means longer vacancies and softer asking-rent achievability than the comps imply.
- What's the recent tenant-quality profile in this submarket — average credit score on applications, eviction rate, late-payment / NSF rate, and stable-employment percentage? A property-management company in the area should have these aggregated.
- How much new for-sale + rental construction is in the pipeline within 1–3 miles? Heavy new supply typically softens prices + rents 12–24 months out; constrained supply supports both.
Investment metrics
- 1% rule
- 0.80% ✗
- Cap rate
- 6.83%
- Cash-on-cash
- 1.92%
- DSCR
- 1.09
- GRM
- 10.4
CMA / ARV
No comps found within radius.
Projected returns pro-forma
-3.0% appreciation · 8.0% rent growth · sell at horizon
- IRR
- -8.5%
- Equity multiple
- 0.67×
- Total profit
- $-16,396
- Equity at exit
- $26,689
- IRR
- 5.9%
- Equity multiple
- 1.53×
- Total profit
- $26,481
- Equity at exit
- $15,477
Cash invested: $50,120 (down + closing). Projections, not guarantees.
Landlord ↔ Tenant lean methodology
- Overall (STATE)
- 81 Strongly Landlord-Friendly
- State Missouri
- 81 Strongly Landlord-Friendly · R+10
- County
- — inherits STATE
- City
- — inherits STATE
ZIP-level market 65401
- Home prices YoY
- -26.4%
- Rents YoY
- 10.2%
- Active inventory
- 271
- Price-to-rent
- 10.4×
Monthly cashflow live
- Estimated rent
- $1,436 medium interval (Pro) →
- Mortgage (P&I)
- −$939
- Tax from tax record
- −$41 /mo · $493/yr
- Insurance
- −$75
- HOA
- −$0
- Vacancy / Maint / Mgmt
- −$302
- Net cashflow
- $80
Break-even live
Sensitivity live
| Price | -10% $182 | -5% $131 | +0% $80 | +5% $30 | +10% $-21 |
|---|---|---|---|---|---|
| Rent | -10% $-33 | -5% $24 | +0% $80 | +5% $137 | +10% $194 |
| Rate | -1.0pp $170 | -0.5pp $126 | base $80 | +0.5pp $34 | +1.0pp $-13 |
UW: 25.0% down · 7.5% · 30yr · 1.5% tax · 5.0% vac · 8.0% maint · 8.0% mgmt
Financing live
Cash to close
- Down payment
- $44,750
- Closing costs
- $5,370
- Reserves months
- —
- Total cash needed
- —
Loan-product check · same deal, 3 products live
Conventional
25% down · 7.5% · 30yr
- Down + closing
- —
- Monthly P&I
- —
- Monthly cashflow
- —
- DSCR
- —
- Eligible?
- —
Personal DTI + credit; lowest rate.
DSCR
20% down · 8.5% · 30yr
- Down + closing
- —
- Monthly P&I
- —
- Monthly cashflow
- —
- DSCR
- —
- Eligible?
- —
No personal income docs; deal must DSCR.
Hard money
10% down · 12.0% · 12mo
- Down + closing
- —
- Monthly P&I
- —
- Monthly cashflow
- —
- DSCR
- —
- Eligible?
- —
Short-term bridge; refi at stabilization.
Listing history 8 events
-
2026-06-03status $179,000 Pending 14 DOM
-
2026-06-02days on market $179,000 Active 14 DOM
-
2026-06-01days on market $179,000 Active 13 DOM
-
2026-05-31days on market $179,000 Active 12 DOM
-
2026-05-30days on market $179,000 Active 11 DOM
-
2026-05-19$179,000 Active
-
2026-05-19historical $179,000
-
2000-10-06soldstatus
ⓘ Source: listings_history table (triggers on properties + properties_extension) + one-shot
backfill from property_details.listing_events for pre-trigger history.
Tax reassessment forecast MO · Resets to sale price
- Current annual tax
- $493 · $41/mo
- Projected year-2 tax
- $1,736 · $145/mo
- Expected delta
- +$1,243/yr (+$104/mo · 252.0%)
ⓘ Screening estimate from a state-policy table — verify with the county assessor before closing.
Climate risk First Street
- Flood 1/10 Low FEMA zone X (unshaded) · 0% chance over 30 yrs
- Wildfire 5/10 Major
- Heat 4/10 Moderate 7 d/yr ≥106°F today · 19 d/yr by 30 yrs out
- Wind 2/10 Low
- Air quality 2/10 Low 0 unhealthy d/yr today · 1 by 30 yrs out
Nearby sold comps map
Loading sold comps map…
Walkable amenities ~0.75 mi
Loading nearby amenities…
Taxation est. · year 1
- Rental income
- $17,235
- − Mortgage interest
- −$10,027
- − Property taxes
- −$493
- − Insurance
- −$895
- − Repairs & maintenance
- −$1,379
- − Management
- −$1,379
- − Depreciation
- −$5,207
- Taxable loss
- −$2,145
- Est. tax savings @ 24.0%
- +$515
- After-tax cash flow
- $1,478/yr
For passive investors: Depreciation is non-cash, so a rental often shows a tax loss while cash-flowing — sheltering income. Rental losses are passive: they offset passive income freely, and up to $25,000/yr can offset ordinary (W-2) income if you actively participate and your MAGI is under $100k (phasing out to $0 by $150k); unused losses carry forward. On sale, claimed depreciation is recaptured at up to 25%, and gains may owe capital-gains tax (a 1031 exchange can defer both). Figures are a year-1 estimate at your 24.0% rate — not tax advice; consult a CPA.
Schools (NCES district)
- District
- Newburg R-II
- NCES district ID
- 2922140
- Math proficiency
- 15% ▼ -5.00%
- Reading proficiency
- 28% ▼ -6.00%
- Median HH income
- $39,225
- Composite
- 18.08/100
- National rank
- #8976
- State rank
- #299 of 324 in MO
Livability — Doolittle
- Score
- 56/100
- State rank
- #687
- US rank
- #22560
Category grades
Schools grade is shown separately in the Schools card above.
Census & demographics
- Census place
- Doolittle, MO
- County
- Phelps County · 42,017 people
- Metro
- Rolla, MO
- Population (ZIP)
- 32,714
- Household income
- $56,081
- Rent vs Own
- Severe rent burden
- 1122.0
Population outlook (Phelps County) Hauer SSP2
- Today (2025)
- 44,188 people
- By 2030
- 43,524 · -1.5%
- By 2040
- 41,211 · -6.7%
- By 2050
- 38,977 · -11.8%
- By 2075
- 33,846 · -23.4%
- By 2100
- 27,828 · -37.0%
Race, ethnicity, and origin ACS 2023
- Neighborhood character
- Predominantly White (84%)
- Race & ethnicity
- White 84% Two or more races 6% Asian 4% Hispanic / Latino 3% Black 3%
- Common ancestry
- Lithuanian 4% Italian 2% Slovak 2%
- Foreign-born
- 6% · China, Canada
- Languages at home
- 93% English-only · Chinese 2% Spanish 1% Other Indo-European 1%
Political lean MEDSL · Phelps
- 2024 margin
- Solid R (+42.9) · D 27.9% · R 70.8% · Other 1.3%
- 2008→2024 swing
- -20.7pp toward R · 2008: -22.2pp · 2024: -42.9pp
- All cycles
- 2024: R+42.9 2020: R+40.1 2016: R+42.9 2012: R+33.5 2008: R+22.2
Not yet ingested
- Civics
- —
Market trends
- HPI YoY
- ▼ -61.69%
- Current HPI
- 172.421
- Rent YoY
- ▲ 10.25%
- Metro
- Rolla, MO
- State GDP YoY
- ▲ 1.84%
- F500 in state
- 20
Industry mix (Fortune 500 HQ in MO)
| Industry | F500 HQs | Revenue |
|---|---|---|
| Healthcare | 1 | $163B |
|
||
| Insurance | 1 | $21B |
|
||
| Industrial Technology | 1 | $17B |
|
||
| Retail | 1 | $16B |
|
||
| Industrial Distribution | 1 | $10B |
|
||
| Utilities | 1 | $9B |
|
||
Price history
+0.0% since first listed3 events — show timeline
- 2026-05-19 Listed $179,000 MARIS as Distributed by MLS Grid
- 2026-05-19 Coming Soon $179,000 MARIS as Distributed by MLS Grid
- 2000-10-06 Sold (Public Records) — Public Records
Property tax history
+4.6%/yrLatest (2025): $493 · +18.8% YoY. Source: county tax records.
Cash-flow waterfall
monthlySold comps — $/sqft
last 12 mo · ≤1 miLoading sold comps…