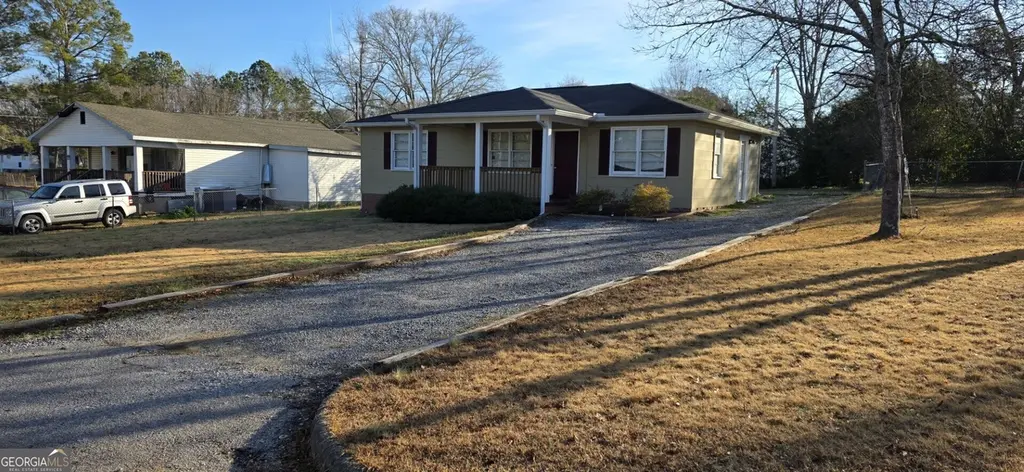
112 N 13th Ave · Lanett, AL
Flood risk 1/10 · Minimal
- FEMA flood zone
- X (unshaded)
- Chance of flooding over 30 yrs
- 0.0%
- Est. flood insurance / yr
- $507 – $1,088
Fire risk 4/10 · Minor
- Est. fire insurance / yr
- $916 – $1,700
Heat risk 6/10 · Moderate
- Hot days now (above 106°F)
- 7 days/yr
- Hot days in 30 yrs
- 20 days/yr
Wind risk 6/10 · Moderate
- Chance of severe wind over 30 yrs
- 64.0%
Air-quality risk 3/10 · Minor
- Unhealthy air days now
- 3 days/yr
- Unhealthy air days in 30 yrs
- 4 days/yr
Risk factors via First Street. Map © Google.
Why this score? — see what drove the D+ grade
The composite is a weighted blend of 9 inputs, each scored 0–100. Each bar is that input's sub-score; the figure is the points it added to the 100-point composite (weight × sub-score).
- Cash flow +20.6/30.0
- ARV discount +6.7/15.0
- DSCR +6.5/10.0
- 1% rule +4.4/10.0
- Livability +3.0/5.0
- Rent growth +2.5/5.0
- Condition / age +2.5/5.0
- Schools +0.9/10.0
- Appreciation +0.0/10.0
$128,200
🖨 Deal sheet 📄 Offer letter ✓ Due diligence
Listing remarks MLS
Beautifully remodeled and move-in ready, this 3-bedroom, 1-bath home in Lanett offers the perfect blend of comfort, convenience, and value. Thoughtfully updated and well maintained, the home features a functional layout ideal for everyday living. Located just minutes from West Point, you'll enjoy easy access to shopping, dining, and major employers including Kia Motors Manufacturing Georgia, with a short drive to Auburn and Opelika. As an added bonus, this property offers strong investment potential, with over two years of rental history at $1,200 per month, recently increased to $1,275 in October 2025. Turnkey and income-producing from day one. Do not disturb tenant. Interior photos were taken prior to current tenancy. Rental history and lease available upon request.
Key facts
- Recently remodeled
- Close to everything
- Well maintained
Tags
Neighborhood map
What this means for you Summary
Snapshot
- This is a 3-bed/1.0-bath single-family listed at $128k.
Deal economics
- At list price, monthly cash flow is $171 ($2k/yr) — positive.
- The deal already cash-flows at list — no discount required.
- To meet the 1% rule (rent ≥ 1% of price), the offer needs to be $120k (6.4% below list).
- Recommended offer: $117k (9.0% below list) — sets the bar for market timing.
- Cap rate 7.9% vs local median 5.8% in Lanett — top-decile yield for the area; either an underpriced asset or a hidden risk that comps aren't pricing in. Stress-test before assuming the spread holds.
Location & tenants
- Location reads 60/100 on livability (#301 in AL) — a middle-class / working-renter tenant base. Strengths: cost of living A+, housing A+; Watch: schools F, crime F, amenities F.
- Lanett City (town): math 5% / reading 19% proficiency, ranked #117 of 129 in AL (top 91%) — low school quality limits family demand, transient renter base, plan for 1-2y turnover; 87% free/reduced lunch — lower-income household profile, screen leases tightly.
- Market conditions: 95 active listings in the ZIP; 1 comparable units currently listed for rent nearby; 43 units permitted in Chambers County in 2024 (0 in 5+ unit buildings).
Forward outlook
- Local home prices are declining (-3.0%/yr); year-one equity from $886 of loan paydown is wiped out by about $4k of value loss. Plan a longer hold.
- Chambers County population projected to shrink 7% by 2050 — rents likely to lag national; underwrite the cash flow, not the appreciation.
Negotiation context
- It's been on market 111 days — a 9% lower offer ($117k) is reasonable based on typical stale-listing flexibility.
- 5 sale attempts since 16y ago with the ask held roughly flat each time — persistent listings suggest the price (not the market) is what's stuck; bring a comps-based counter.
- Current owner paid $69k; list at $128k implies a 86% gain — meaningful room to come down on a strong offer.
Risks & watch-outs
- Climate carrying-cost: major wind risk, 64% chance of damaging wind over 30y; extreme-heat days projected 7→20/yr by 2055 (HVAC capex compounding) — expect insurance premiums to compound above CPI over the hold.
Questions for the listing agent
- It's been on market 111 days. Have you received any prior offers? Is the seller open to a 9% concession, seller financing, or rate buy-down credit?
- Built in 1962 — when were the roof, HVAC, electrical panel, plumbing, and water heater last replaced?
- Why hasn't it sold? Are there any deal-killer items the seller is aware of (foundation, flood, title, zoning, code violations)?
- Is there a deadline driving the sale (1031 exchange, divorce, estate, relocation)? That informs how much negotiation room exists.
- Schools are F-rated, which usually means shorter tenancies and higher turnover. Who's the typical renter profile here, and what's been the actual vacancy rate?
- Crime grade is F in this area — have there been break-ins, vandalism, or insurance claims at this property in the last 3 years? What carrier currently insures it and at what premium?
- The area grade is low — what's the realistic commute time and amenity access for the typical tenant pool here? Any planned neighborhood developments (good or bad) we should know about?
- What's the average days-on-market for RENTAL listings here right now (not sales)? A rising rental-DOM trend means longer vacancies and softer asking-rent achievability than the comps imply.
- What's the recent tenant-quality profile in this submarket — average credit score on applications, eviction rate, late-payment / NSF rate, and stable-employment percentage? A property-management company in the area should have these aggregated.
- How much new for-sale + rental construction is in the pipeline within 1–3 miles? Heavy new supply typically softens prices + rents 12–24 months out; constrained supply supports both.
Investment metrics
- 1% rule
- 0.94% ✗
- Cap rate
- 7.90%
- Cash-on-cash
- 5.73%
- DSCR
- 1.25
- GRM
- 8.9
CMA / ARV
- ARV (median comp)
- $125,959
- List price
- $128,200
- Delta
- 1.78%
- Verdict
- FAIR
- Comps
- 20 within 1.0 mi
Show comp detail 8 sales within ~0.75 mi
| Address | Dist | Beds/Ba | Sqft | Sold | Price | $/sf | Match |
|---|---|---|---|---|---|---|---|
| 1006 South 5th St | 0.32mi | 3/2.0 | 1,000 (+4%) | 4mo | $185,000 | $185 | 72 |
| 1110 N 3rd St | 0.09mi | 2/2.0 (-1) | 1,064 (+10%) | 5mo | $45,000 | $42 | 65 |
| 204 S 2nd Ave | 0.61mi | 3/1.5 | 957 (-1%) | 15mo | $52,500 | $55 | 55 |
| 909 N 13th St | 0.53mi | 3/1.0 | 1,075 (+11%) | 4mo | $167,000 | $155 | 53 |
| 806 S 11th St | 0.67mi | 3/1.0 | 888 (-8%) | 7mo | $81,500 | $92 | 49 |
| 1206 7th St S | 0.41mi | 2/1.0 (-1) | 840 (-13%) | 10mo | $23,000 | $27 | 46 |
| 1414 S 8th St | 0.53mi | 2/1.0 (-1) | 840 (-13%) | 7mo | $50,000 | $60 | 43 |
| 510 N 8th | 0.43mi | 3/1.5 | 1,064 (+10%) | 24mo | $72,500 | $68 | 41 |
Match score weights: distance 35% · size 25% · config 20% · recency 20%. Top-matched comps best support the ARV.
Projected returns pro-forma
-3.0% appreciation · 3.0% rent growth · sell at horizon
- IRR
- -7.5%
- Equity multiple
- 0.72×
- Total profit
- $-9,909
- Equity at exit
- $19,115
- IRR
- 2.0%
- Equity multiple
- 1.15×
- Total profit
- $5,226
- Equity at exit
- $11,084
Cash invested: $35,896 (down + closing). Projections, not guarantees.
Landlord ↔ Tenant lean methodology
- Overall (STATE)
- 90 Strongly Landlord-Friendly
- State Alabama
- 90 Strongly Landlord-Friendly · R+15
- County
- — inherits STATE
- City
- — inherits STATE
ZIP-level market 36863
- Home prices YoY
- -29.1%
- Active inventory
- 95
- Price-to-rent
- 8.9×
Monthly cashflow live
- Estimated rent
- $1,200 medium interval (Pro) →
- Mortgage (P&I)
- −$672
- Tax from tax record
- −$51 /mo · $611/yr
- Insurance
- −$53
- HOA
- −$0
- Vacancy / Maint / Mgmt
- −$252
- Net cashflow
- $171
Break-even live
UW: 25.0% down · 7.5% · 30yr · 1.5% tax · 5.0% vac · 8.0% maint · 8.0% mgmt
Financing live
Cash to close
- Down payment
- $32,050
- Closing costs
- $3,846
- Reserves months
- —
- Total cash needed
- —
Loan-product check · same deal, 3 products live
Conventional
25% down · 7.5% · 30yr
- Down + closing
- —
- Monthly P&I
- —
- Monthly cashflow
- —
- DSCR
- —
- Eligible?
- —
Personal DTI + credit; lowest rate.
DSCR
20% down · 8.5% · 30yr
- Down + closing
- —
- Monthly P&I
- —
- Monthly cashflow
- —
- DSCR
- —
- Eligible?
- —
No personal income docs; deal must DSCR.
Hard money
10% down · 12.0% · 12mo
- Down + closing
- —
- Monthly P&I
- —
- Monthly cashflow
- —
- DSCR
- —
- Eligible?
- —
Short-term bridge; refi at stabilization.
Rent comps 1 comps
| Address | Beds | Baths | Sqft | Rent | $/sqft | DOM | Units | Dist |
|---|---|---|---|---|---|---|---|---|
| 813 3rd Ave Unit K West Point, GA | 2.0 | 2.5 | 1100 | $1,200 | $1.09 | 21d | 1 | 1.11mi |
Listing history 22 events
-
2026-06-15days on market $128,200 Active 111 DOM
-
2026-06-14days on market $128,200 Active 109 DOM
-
2026-06-12days on market $128,200 Active 108 DOM
-
2026-06-09days on market $128,200 Active 105 DOM
-
2026-06-08days on market $128,200 Active 104 DOM
-
2026-06-07days on market $128,200 Active 103 DOM
-
2026-06-07days on market $128,200 Active 102 DOM
-
2026-06-04days on market $128,200 Active 99 DOM
-
2026-06-02days on market $128,200 Active 98 DOM
-
2026-06-01days on market $128,200 Active 97 DOM
-
2026-05-31days on market $128,200 Active 96 DOM
-
2026-05-31days on market $128,200 Active 95 DOM
-
2026-04-14$128,200 Active 778-char remark
Show marketing remark (778 chars)
Beautifully remodeled and move-in ready, this 3-bedroom, 1-bath home in Lanett offers the perfect blend of comfort, convenience, and value. Thoughtfully updated and well maintained, the home features a functional layout ideal for everyday living. Located just minutes from West Point, you'll enjoy easy access to shopping, dining, and major employers including Kia Motors Manufacturing Georgia, with a short drive to Auburn and Opelika. As an added bonus, this property offers strong investment potential, with over two years of rental history at $1,200 per month, recently increased to $1,275 in October 2025. Turnkey and income-producing from day one. Do not disturb tenant. Interior photos were taken prior to current tenancy. Rental history and lease available upon request.
-
2026-02-21$128,200 New 785-char remark
Show marketing remark (785 chars)
Beautifully remodeled and move-in ready, this 3-bedroom, 1-bath home in Lanett offers the perfect blend of comfort, convenience, and value. Thoughtfully updated and well maintained, the home features a functional layout ideal for everyday living. Located just minutes from West Point, you'll enjoy easy access to shopping, dining, and major employers including Kia Motors Manufacturing Georgia, with a short drive to Auburn and Opelika. As an added bonus, this property offers strong investment potential, with over two years of rental history at $1,200 per month, recently increased to $1,275 in October 2025. Turnkey and income-producing from day one. Do not disturb tenant. Interior photos were taken prior to current tenancy. Rental history and lease available upon request.
-
2022-06-07soldstatus $68,800
-
2022-06-03soldstatus $68,800
-
2022-06-03soldstatus $68,800
-
2021-11-12$90,000
-
2021-11-12$90,000
-
2010-06-02soldstatus $15,300
-
2010-06-01soldstatus $15,300
-
2010-03-17$15,300
ⓘ Source: listings_history table (triggers on properties + properties_extension) + one-shot
backfill from property_details.listing_events for pre-trigger history.
Tax reassessment forecast AL · Resets to sale price
- Current annual tax
- $611 · $51/mo
- Projected year-2 tax
- $611 · $51/mo
- Expected delta
- $0/yr ($0/mo · 0.0%)
ⓘ Screening estimate from a state-policy table — verify with the county assessor before closing.
Climate risk First Street
- Flood 1/10 Low FEMA zone X (unshaded) · 0% chance over 30 yrs
- Wildfire 4/10 Moderate
- Heat 6/10 Major 7 d/yr ≥106°F today · 20 d/yr by 30 yrs out
- Wind 6/10 Major 64% chance of damaging wind over 30 yrs
- Air quality 3/10 Moderate 3 unhealthy d/yr today · 4 by 30 yrs out
Nearby sold comps map
Loading sold comps map…
Walkable amenities ~0.75 mi
Loading nearby amenities…
Taxation est. · year 1
- Rental income
- $14,400
- − Mortgage interest
- −$7,181
- − Property taxes
- −$611
- − Insurance
- −$641
- − Repairs & maintenance
- −$1,152
- − Management
- −$1,152
- − Depreciation
- −$3,729
- Taxable loss
- −$67
- Est. tax savings @ 24.0%
- +$16
- After-tax cash flow
- $2,072/yr
For passive investors: Depreciation is non-cash, so a rental often shows a tax loss while cash-flowing — sheltering income. Rental losses are passive: they offset passive income freely, and up to $25,000/yr can offset ordinary (W-2) income if you actively participate and your MAGI is under $100k (phasing out to $0 by $150k); unused losses carry forward. On sale, claimed depreciation is recaptured at up to 25%, and gains may owe capital-gains tax (a 1031 exchange can defer both). Figures are a year-1 estimate at your 24.0% rate — not tax advice; consult a CPA.
Schools (NCES district)
- District
- Lanett City
- NCES district ID
- 0101980
- Math proficiency
- 5% ▼ -19.00%
- Reading proficiency
- 19% ▼ -4.00%
- Median HH income
- $27,834
- Composite
- 9.11/100
- National rank
- #9866
- State rank
- #117 of 129 in AL
Livability — Lanett
- Score
- 60/100
- State rank
- #301
- US rank
- #19159
Category grades
Schools grade is shown separately in the Schools card above.
Census & demographics
- Census place
- Lanett, AL
- Population (ZIP)
- 12,335
Population outlook (Chambers County) Hauer SSP2
- Today (2025)
- 33,868 people
- By 2030
- 33,504 · -1.1%
- By 2040
- 32,594 · -3.8%
- By 2050
- 31,422 · -7.2%
- By 2075
- 29,054 · -14.2%
- By 2100
- 25,431 · -24.9%
Race, ethnicity, and origin ACS 2023
- Neighborhood character
- Diverse neighborhood (Simpson 0.58)
- Race & ethnicity
- White 46% Black 45% Hispanic / Latino 6% Two or more races 3%
- Hispanic origin (detail)
- Mexican 3%
- Common ancestry
- Serbian 1%
- Foreign-born
- 5% · Canada, South Korea
- Languages at home
- 95% English-only · Spanish 4% Other Indo-European 1%
Political lean MEDSL · Chambers
- 2024 margin
- Strong R (+23.2) · D 38.0% · R 61.2%
- 2008→2024 swing
- -14.8pp toward R · 2008: -8.5pp · 2024: -23.2pp
- All cycles
- 2024: R+23.2 2020: R+15.6 2016: R+14.8 2012: R+5.1 2008: R+8.5
Not yet ingested
- Civics
- —
Market trends
- HPI YoY
- ▼ -63.32%
- Current HPI
- 154.4174
- Rent YoY
- —
- Metro
- —
- State GDP YoY
- ▲ 2.94%
- F500 in state
- 4
Industry mix (Fortune 500 HQ in AL)
| Industry | F500 HQs | Revenue |
|---|---|---|
| Financial Services | 1 | $8B |
|
||
| Healthcare | 1 | $5B |
|
||
Price history
+737.9% since first listed10 events — show timeline
- 2026-04-14 Listed $128,200 LCMLS
- 2026-02-21 Listed $128,200 GAMLS
- 2022-06-07 Sold (Public Records) $68,800 Public Records
- 2022-06-03 Sold (MLS) $68,800 EABOR
- 2022-06-03 Sold (MLS) $68,800 EABOR
- 2021-11-12 Listed $90,000 EABOR
- 2021-11-12 Listed $90,000 EABOR
- 2010-06-02 Sold (MLS) $15,300 MAAR
- 2010-06-01 Sold (Public Records) $15,300 Public Records
- 2010-03-17 Listed $15,300 MAAR
Property tax history
+5.0%/yrLatest (2025): $611 · -0.2% YoY. Source: county tax records.
Cash-flow waterfall
monthlySold comps — $/sqft
last 12 mo · ≤1 miLoading sold comps…