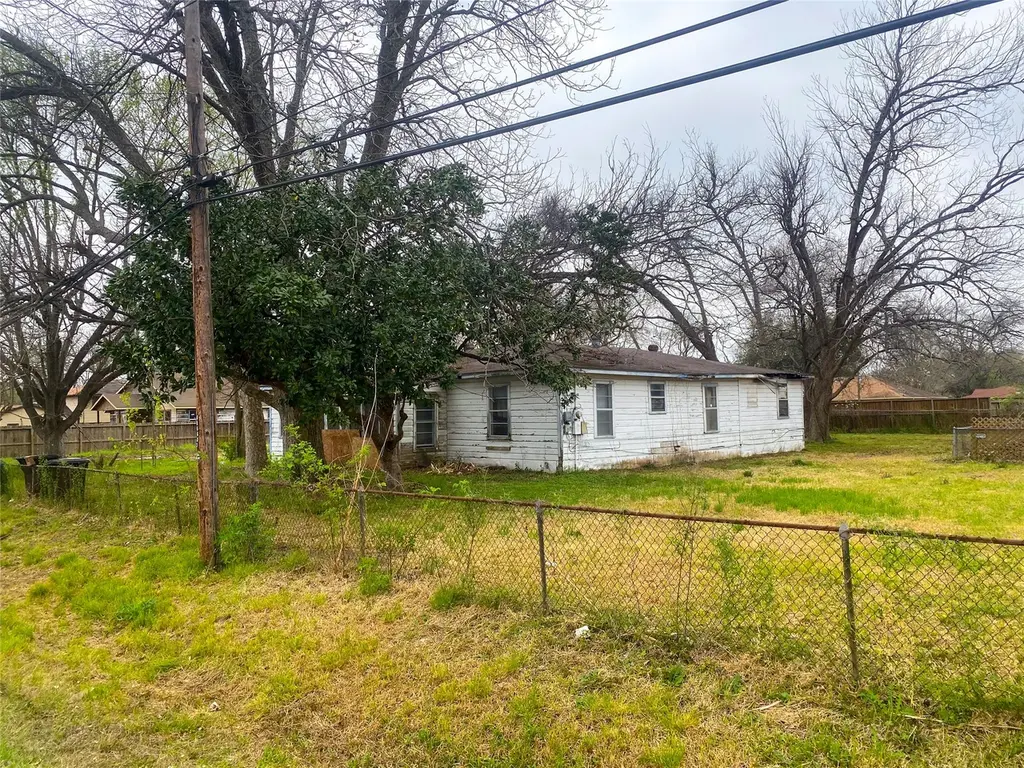
7525 Charlie St · Houston, TX
Flood risk 1/10 · Minimal
- FEMA flood zone
- X (unshaded)
- Chance of flooding over 30 yrs
- 0.0%
- Est. flood insurance / yr
- $507 – $1,088
Fire risk 1/10 · Minimal
- Est. fire insurance / yr
- $1,222 – $2,270
Heat risk 9/10 · Severe
- Hot days now (above 109°F)
- 7 days/yr
- Hot days in 30 yrs
- 24 days/yr
Wind risk 9/10 · Severe
- Chance of severe wind over 30 yrs
- 99.0%
Air-quality risk 3/10 · Minor
- Unhealthy air days now
- 3 days/yr
- Unhealthy air days in 30 yrs
- 4 days/yr
Risk factors via First Street. Map © Google.
Why this score? — see what drove the B- grade
The composite is a weighted blend of 9 inputs, each scored 0–100. Each bar is that input's sub-score; the figure is the points it added to the 100-point composite (weight × sub-score).
- Cash flow +30.0/30.0
- 1% rule +10.0/10.0
- DSCR +10.0/10.0
- ARV discount +7.5/15.0
- Livability +3.7/5.0
- Condition / age +2.5/5.0
- Rent growth +2.2/5.0
- Schools +1.5/10.0
- Appreciation +0.0/10.0
$102,000
🖨 Deal sheet 📄 Offer letter ✓ Due diligence
Listing remarks MLS
Three-bedroom, one and a half bath single-family home on approximately 10,367 square foot lot. Built 1953. Approximately 1,768 square feet per appraisal district. Property sold as-is, where-is, with no warranties or representations of any kind. Buyer to independently verify all property information including condition, dimensions, flood zone status, and suitability for buyer's intended purpose.
Key facts
- 0.24 acre lot
- Built 1953
- Listed 84 days
Neighborhood map
What this means for you Summary
Snapshot
- This is a 3-bed/1.5-bath single-family listed at $102k.
Deal economics
- At list price, monthly cash flow is $888 ($11k/yr) — positive.
- The deal already cash-flows at list — no discount required.
- Meets the 1% rule at list price ($2k rent vs $102k).
- Recommended offer: $96k (6.0% below list) — sets the bar for market timing.
- Cap rate 16.7% vs local median 3.2% in Houston — top-decile yield for the area; either an underpriced asset or a hidden risk that comps aren't pricing in. Stress-test before assuming the spread holds.
Location & tenants
- Location reads 74/100 on livability (#184 in TX, #4,771 nationally) — a middle-class / working-renter tenant base. Strengths: amenities A+, cost of living A+, housing A+; Watch: schools D, crime F.
- Aldine ISD (suburban): math 16% / reading 21% proficiency, ranked #790 of 826 in TX (top 96%) — low school quality limits family demand, transient renter base, plan for 1-2y turnover; 79% free/reduced lunch — lower-income household profile, screen leases tightly.
- Market conditions: Rents soft (-1.0%/yr); 468 active listings in the ZIP; 31 comparable units currently listed for rent nearby; rentals lingering (median 44d on market — plan ~5-8 weeks vacancy on turnover, expect pricing pressure); 52% of comp listings sitting > 30 days — soft ceiling on asking rent; 29,883 units permitted in Harris County in 2024 (8,621 in 5+ unit buildings).
- At $2,161/mo this rent would consume 48% of the median local household income ($54k/yr) (locally 2294% of renters already pay >50% of income on rent) — very limited rent-growth headroom before tenants either downsize or default.
Forward outlook
- Local home prices are declining (-3.0%/yr); year-one equity from $705 of loan paydown is wiped out by about $3k of value loss. Plan a longer hold.
- Harris County population projected at +47% by 2050 — long-run rental-demand tailwind backs the buy-and-hold thesis.
- At projected returns (-3.0% appreciation + 0.0% rent growth), your $29k cash investment doubles in ~4 years — after that, you're playing with house money.
Negotiation context
- It's been on market 84 days — a 6% lower offer ($96k) is reasonable based on typical stale-listing flexibility.
- 6 sale attempts since 3y ago with the ask held roughly flat each time — persistent listings suggest the price (not the market) is what's stuck; bring a comps-based counter.
Risks & watch-outs
- Watch-outs: property tax is 2.8% of price; built in 1953 — expect roof / HVAC / electrical / plumbing capex.
- Climate carrying-cost: severe wind risk, 99% chance of damaging wind over 30y; extreme-heat days projected 7→24/yr by 2055 (HVAC capex compounding) — expect insurance premiums to compound above CPI over the hold.
Questions for the listing agent
- It's been on market 84 days. Have you received any prior offers? Is the seller open to a 6% concession, seller financing, or rate buy-down credit?
- Built in 1953 — when were the roof, HVAC, electrical panel, plumbing, and water heater last replaced?
- Property tax is high relative to price — has the assessment been appealed recently, and will the sale trigger a re-assessment?
- Why hasn't it sold? Are there any deal-killer items the seller is aware of (foundation, flood, title, zoning, code violations)?
- Is there a deadline driving the sale (1031 exchange, divorce, estate, relocation)? That informs how much negotiation room exists.
- Schools are D-rated, which usually means shorter tenancies and higher turnover. Who's the typical renter profile here, and what's been the actual vacancy rate?
- Crime grade is F in this area — have there been break-ins, vandalism, or insurance claims at this property in the last 3 years? What carrier currently insures it and at what premium?
- What's the average days-on-market for RENTAL listings here right now (not sales)? A rising rental-DOM trend means longer vacancies and softer asking-rent achievability than the comps imply.
- What's the recent tenant-quality profile in this submarket — average credit score on applications, eviction rate, late-payment / NSF rate, and stable-employment percentage? A property-management company in the area should have these aggregated.
- How much new for-sale + rental construction is in the pipeline within 1–3 miles? Heavy new supply typically softens prices + rents 12–24 months out; constrained supply supports both.
Investment metrics
- 1% rule
- 2.12% ✓
- Cap rate
- 16.73%
- Cash-on-cash
- 37.29%
- DSCR
- 2.66
- GRM
- 3.9
CMA / ARV
- ARV (median comp)
- $244,246
- List price
- $102,000
- Delta
- -58.24%
- Verdict
- UNDERPRICED
- Comps
- 20 within 1.0 mi
Show comp detail 12 sales within ~0.75 mi
| Address | Dist | Beds/Ba | Sqft | Sold | Price | $/sf | Match |
|---|---|---|---|---|---|---|---|
| 7415 Dyer St | 0.16mi | 3/2.0 | 1,579 (-11%) | 4mo | $225,000 | $142 | 70 |
| 8130 Sunnyhill St | 0.57mi | 3/2.5 | 1,782 (+1%) | 2mo | $314,900 | $177 | 67 |
| 7514 Emma Lou St | 0.10mi | 4/2.5 (+1) | 1,558 (-12%) | 7mo | $249,990 | $160 | 61 |
| 8006 Cora St | 0.28mi | 3/2.5 | 1,980 (+12%) | 4mo | $315,000 | $159 | 60 |
| 7903 James Franklin St | 0.59mi | 3/2.5 | 1,726 (-2%) | 6mo | $265,000 | $154 | 59 |
| 8004 Cora St | 0.27mi | 3/2.5 | 1,980 (+12%) | 7mo | $315,000 | $159 | 58 |
| 8008 Cora St | 0.29mi | 3/2.5 | 1,980 (+12%) | 7mo | $315,000 | $159 | 57 |
| 8017 Phillips St | 0.39mi | 3/2.5 | 1,937 (+10%) | 7mo | $304,900 | $157 | 56 |
| 8141 Sunnyhill St | 0.60mi | 3/2.5 | 1,650 (-7%) | 5mo | $270,000 | $164 | 53 |
| 8303 Venus St | 0.61mi | 3/3.0 | 1,624 (-8%) | 3mo | $299,990 | $185 | 49 |
| 6605 Greenhurst St | 0.71mi | 4/2.5 (+1) | 1,869 (+6%) | 1mo | $225,000 | $120 | 47 |
| 8210 Venus St | 0.56mi | 3/2.5 | 1,503 (-15%) | 4mo | $259,000 | $172 | 41 |
Match score weights: distance 35% · size 25% · config 20% · recency 20%. Top-matched comps best support the ARV.
Projected returns pro-forma
-3.0% appreciation · 0.0% rent growth · sell at horizon
- IRR
- 29.6%
- Equity multiple
- 2.18×
- Total profit
- $33,771
- Equity at exit
- $15,209
- IRR
- 35.0%
- Equity multiple
- 3.74×
- Total profit
- $78,142
- Equity at exit
- $8,819
Cash invested: $28,560 (down + closing). Projections, not guarantees.
Landlord ↔ Tenant lean methodology
- Overall (STATE)
- 87 Strongly Landlord-Friendly
- State Texas
- 87 Strongly Landlord-Friendly · R+5
- County
- — inherits STATE
- City
- — inherits STATE
ZIP-level market 77088
- Home prices YoY
- -23.2%
- Rents YoY
- -1.0%
- Active inventory
- 468
- Price-to-rent
- 3.9×
Monthly cashflow live
- Estimated rent
- $2,161 high interval (Pro) →
- Mortgage (P&I)
- −$535
- Tax from tax record
- −$242 /mo · $2,906/yr
- Insurance
- −$42
- HOA
- −$0
- Vacancy / Maint / Mgmt
- −$454
- Net cashflow
- $888
Break-even live
UW: 25.0% down · 7.5% · 30yr · 1.5% tax · 5.0% vac · 8.0% maint · 8.0% mgmt
Financing live
Cash to close
- Down payment
- $25,500
- Closing costs
- $3,060
- Reserves months
- —
- Total cash needed
- —
Loan-product check · same deal, 3 products live
Conventional
25% down · 7.5% · 30yr
- Down + closing
- —
- Monthly P&I
- —
- Monthly cashflow
- —
- DSCR
- —
- Eligible?
- —
Personal DTI + credit; lowest rate.
DSCR
20% down · 8.5% · 30yr
- Down + closing
- —
- Monthly P&I
- —
- Monthly cashflow
- —
- DSCR
- —
- Eligible?
- —
No personal income docs; deal must DSCR.
Hard money
10% down · 12.0% · 12mo
- Down + closing
- —
- Monthly P&I
- —
- Monthly cashflow
- —
- DSCR
- —
- Eligible?
- —
Short-term bridge; refi at stabilization.
Rent comps 31 comps
| Address | Beds | Baths | Sqft | Rent | $/sqft | DOM | Units | Dist |
|---|---|---|---|---|---|---|---|---|
| 7504 Carver Rd Houston, TX | 3.0 | 2.5 | 1694 | $2,500 | $1.48 | 5d | 1 | 0.18mi |
| 7008 Emma Lou St Houston, TX | 3.0 | 2.5 | 1610 | $3,000 | $1.86 | 18d | 1 | 0.43mi |
| 7514 Sandle St Houston, TX | 3.0 | 2.5 | 1523 | $1,999 | $1.31 | 43d | 1 | 0.45mi |
| 8101 Venus St Unit A Houston, TX | 3.0 | 2.0 | 1375 | $1,699 | $1.24 | 24d | 1 | 0.54mi |
| 8101 Venus St Unit B Houston, TX | 3.0 | 2.0 | 1375 | $1,595 | $1.16 | 24d | 1 | 0.54mi |
| 6555 Sealey St Houston, TX | 3.0 | 2.5 | 1800 | $2,700 | $1.50 | 24d | 1 | 0.78mi |
| 6615 Goldspier St Houston, TX | 3.0 | 2.0 | 1848 | $2,150 | $1.16 | 22d | 1 | 0.81mi |
| 1032 Glen Ln Houston, TX | 3.0 | 3.0 | 1667 | $2,400 | $1.44 | 43d | 1 | 0.92mi |
| 1450 Dewalt St Houston, TX | 3.0 | 2.5 | 1371 | $2,500 | $1.82 | 43d | 1 | 0.94mi |
| 7628 Inwood Hills Ln Houston, TX | 3.0 | 3.0 | 1768 | $2,500 | $1.41 | 43d | 1 | 1.07mi |
| 2850 W Gulf Bank Rd Houston, TX | 1.0–4.0 | 1.0–2.0 | 1055 | $1,413 | $1.34 | 1d | 107 | 1.21mi |
| 2722 Stallings Dr Houston, TX | 3.0 | 2.0 | 1298 | $1,635 | $1.26 | 5d | 1 | 1.22mi |
| 8822 Woodcamp Dr Houston, TX | 3.0 | 2.5 | 1687 | $1,740 | $1.03 | 5d | 1 | 1.27mi |
| 8402 Storm Creek Ct Houston, TX | 4.0 | 2.5 | 2612 | $2,083 | $0.80 | 12d | 1 | 1.28mi |
| 3018 Stallings Dr Houston, TX | 4.0 | 2.0 | 1512 | $1,550 | $1.03 | 43d | 1 | 1.33mi |
| 8108 De Priest St Unit B Houston, TX | 3.0 | 2.5 | 1500 | $1,900 | $1.27 | 43d | 1 | 1.41mi |
| 8110 De Priest St Unit A Houston, TX | 3.0 | 2.5 | 1500 | $1,900 | $1.27 | 43d | 1 | 1.41mi |
| 8112 De Priest St Unit B Houston, TX | 3.0 | 2.5 | 1500 | $1,900 | $1.27 | 43d | 1 | 1.41mi |
| 8120 De Priest St Unit A Houston, TX | 3.0 | 2.5 | 1500 | $1,750 | $1.17 | 43d | 1 | 1.42mi |
| 8120 De Priest St Unit B Houston, TX | 3.0 | 2.5 | 1500 | $1,900 | $1.27 | 43d | 1 | 1.42mi |
| 8122 De Priest St Unit A Houston, TX | 3.0 | 3.5 | 1500 | $1,900 | $1.27 | 43d | 1 | 1.42mi |
| 8118 De Priest St Unit B Houston, TX | 3.0 | 2.5 | 1500 | $1,900 | $1.27 | 43d | 1 | 1.42mi |
| 8304 De Priest St Unit B Houston, TX | 3.0 | 2.5 | 1600 | $1,900 | $1.19 | 22d | 1 | 1.43mi |
| 8306 De Priest St Unit A Houston, TX | 3.0 | 2.5 | 1500 | $1,900 | $1.27 | 20d | 1 | 1.43mi |
| 8310 De Priest St Unit B Houston, TX | 3.0 | 2.5 | 1500 | $1,900 | $1.27 | 20d | 1 | 1.44mi |
| 8312 De Priest St Unit A Houston, TX | 3.0 | 2.5 | 1500 | $1,900 | $1.27 | 20d | 1 | 1.44mi |
| 8312 De Priest St Unit B Houston, TX | 3.0 | 3.5 | 1500 | $1,900 | $1.27 | 20d | 1 | 1.44mi |
| 6513 Knox St Houston, TX | 4.0 | 3.0 | 1773 | $2,100 | $1.18 | 43d | 1 | 1.44mi |
| 8404 De Priest St Unit A Houston, TX | 3.0 | 2.5 | 1600 | $1,900 | $1.19 | 43d | 1 | 1.45mi |
| 8406 De Priest St Unit A Houston, TX | 3.0 | 2.5 | 1600 | $1,695 | $1.06 | 43d | 1 | 1.45mi |
| 5218 Long Creek Ln Houston, TX | 4.0 | 2.0 | 1941 | $2,000 | $1.03 | 43d | 1 | 1.48mi |
Listing history 41 events
-
2026-06-18days on market $102,000 Active 84 DOM
-
2026-06-17days on market $102,000 Active 83 DOM
-
2026-06-16days on market $102,000 Active 82 DOM
-
2026-06-15days on market $102,000 Active 81 DOM
-
2026-06-13days on market $102,000 Active 79 DOM
-
2026-06-13days on market $102,000 Active 78 DOM
-
2026-06-09days on market $102,000 Active 75 DOM
-
2026-06-08days on market $102,000 Active 74 DOM
-
2026-06-07days on market $102,000 Active 73 DOM
-
2026-06-04days on market $102,000 Active 70 DOM
-
2026-06-03days on market $102,000 Active 69 DOM
-
2026-06-02days on market $102,000 Active 68 DOM
-
2026-06-01days on market $102,000 Active 67 DOM
-
2026-05-31days on market $102,000 Active 66 DOM
-
2026-03-26$102,000 Active 397-char remark
Show marketing remark (397 chars)
Three-bedroom, one and a half bath single-family home on approximately 10,367 square foot lot. Built 1953. Approximately 1,768 square feet per appraisal district. Property sold as-is, where-is, with no warranties or representations of any kind. Buyer to independently verify all property information including condition, dimensions, flood zone status, and suitability for buyer's intended purpose.
-
2025-11-20historical
-
2025-10-27price $101,000
-
2025-10-14status Active
-
2025-09-16status Pending
-
2025-05-29price $104,900
-
2025-04-22status Active
-
2025-04-17status Pending
-
2025-04-07status Option Pending
-
2025-04-02price $117,900
-
2025-01-27price $124,990
-
2025-01-27status Active
-
2024-07-16historical
-
2024-06-28price $133,000
-
2024-06-20price $134,000
-
2024-05-20price $135,000
-
2024-05-16price $136,000
-
2024-05-14price $137,000
-
2024-05-13price $138,000
-
2024-05-03price $139,000
-
2024-05-01price $139,500
-
2024-04-29price $149,500
-
2024-04-10$151,500 Active
-
2023-04-14soldstatus Sold
-
2023-03-23status Pending
-
2023-03-15$130,000 Active
-
1988-01-01soldstatus
ⓘ Source: listings_history table (triggers on properties + properties_extension) + one-shot
backfill from property_details.listing_events for pre-trigger history.
Tax reassessment forecast TX · Resets to sale price
- Current annual tax
- $2,906 · $242/mo
- Projected year-2 tax
- $2,906 · $242/mo
- Expected delta
- $0/yr ($0/mo · 0.0%)
ⓘ Screening estimate from a state-policy table — verify with the county assessor before closing.
Climate risk First Street
- Flood 1/10 Low FEMA zone X (unshaded) · 0% chance over 30 yrs
- Wildfire 1/10 Low
- Heat 9/10 Extreme 7 d/yr ≥109°F today · 24 d/yr by 30 yrs out
- Wind 9/10 Extreme 99% chance of damaging wind over 30 yrs
- Air quality 3/10 Moderate 3 unhealthy d/yr today · 4 by 30 yrs out
Nearby sold comps map
Loading sold comps map…
Walkable amenities ~0.75 mi
Loading nearby amenities…
Taxation est. · year 1
- Rental income
- $25,932
- − Mortgage interest
- −$5,714
- − Property taxes
- −$2,906
- − Insurance
- −$510
- − Repairs & maintenance
- −$2,075
- − Management
- −$2,075
- − Depreciation
- −$2,967
- Taxable income
- $9,685
- Est. tax owed @ 24.0%
- −$2,324
- After-tax cash flow
- $8,326/yr
For passive investors: Depreciation is non-cash, so a rental often shows a tax loss while cash-flowing — sheltering income. Rental losses are passive: they offset passive income freely, and up to $25,000/yr can offset ordinary (W-2) income if you actively participate and your MAGI is under $100k (phasing out to $0 by $150k); unused losses carry forward. On sale, claimed depreciation is recaptured at up to 25%, and gains may owe capital-gains tax (a 1031 exchange can defer both). Figures are a year-1 estimate at your 24.0% rate — not tax advice; consult a CPA.
Schools (NCES district)
- District
- Aldine ISD
- NCES district ID
- 4807710
- Math proficiency
- 16% ▼ -23.00%
- Reading proficiency
- 21% ▼ -11.00%
- Median HH income
- $37,081
- Composite
- 15.42/100
- National rank
- #9317
- State rank
- #790 of 826 in TX
Livability — Houston
- Score
- 74/100
- State rank
- #184
- US rank
- #4771
Category grades
Schools grade is shown separately in the Schools card above.
Census & demographics
- Census place
- Houston, TX
- County
- Harris County · 4,702,590 people
- City population
- 3,226,434
- Metro
- Houston-The Woodlands-Sugar Land, TX
- Population (ZIP)
- 57,047
- Household income
- $54,411
- Rent vs Own
- Severe rent burden
- 2294.0
Population outlook (Harris County) Hauer SSP2
- Today (2025)
- 5,571,493 people
- By 2030
- 6,089,821 · +9.3%
- By 2040
- 7,142,806 · +28.2%
- By 2050
- 8,185,864 · +46.9%
- By 2075
- 10,574,329 · +89.8%
- By 2100
- 12,109,958 · +117.4%
Race, ethnicity, and origin ACS 2023
- Neighborhood character
- Diverse neighborhood (Simpson 0.59)
- Race & ethnicity
- Hispanic / Latino 52% Black 37% Two or more races 18% White 6% Asian 4%
- Hispanic origin (detail)
- Mexican 36%
- Common ancestry
- Lithuanian 1%
- Foreign-born
- 25% · Canada, Vietnam, China
- Languages at home
- 49% English-only · Spanish 47% Vietnamese 3%
Political lean MEDSL · Harris
- 2024 margin
- Lean D (+5.5) · D 52.0% · R 46.4% · Other 1.6%
- 2008→2024 swing
- +3.9pp toward D · 2008: 1.6pp · 2024: 5.5pp
- All cycles
- 2024: D+5.5 2020: D+13.3 2016: D+12.4 2012: D+0.1 2008: D+1.6
Not yet ingested
- Civics
- —
Market trends
- HPI YoY
- ▼ -98.37%
- Current HPI
- 325.0499
- Rent YoY
- ▼ -1.01%
- Metro
- Houston-The Woodlands-Sugar Land, TX
- State GDP YoY
- ▲ 3.95%
- F500 in state
- 110
Industry mix (Fortune 500 HQ in TX)
| Industry | F500 HQs | Revenue |
|---|---|---|
| Energy | 16 | $1,198B |
|
||
| Technology | 5 | $198B |
|
||
| Engineering / Construction | 4 | $72B |
|
||
| Energy Services | 3 | $60B |
|
||
| Utilities | 3 | $41B |
|
||
| Healthcare | 2 | $330B |
|
||
Price history
-21.5% since first listed27 events — show timeline
- 2026-03-26 Listed $102,000 HARMLS
- 2025-11-20 Listing Removed — HARMLS
- 2025-10-27 Price Changed $101,000 HARMLS
- 2025-10-14 Relisted — HARMLS
- 2025-09-16 Pending — HARMLS
- 2025-05-29 Price Changed $104,900 HARMLS
- 2025-04-22 Relisted — HARMLS
- 2025-04-17 Pending — HARMLS
- 2025-04-07 Pending — HARMLS
- 2025-04-02 Price Changed $117,900 HARMLS
- 2025-01-27 Price Changed $124,990 HARMLS
- 2025-01-27 Relisted — HARMLS
- 2024-07-16 Listing Removed — HARMLS
- 2024-06-28 Price Changed $133,000 HARMLS
- 2024-06-20 Price Changed $134,000 HARMLS
- 2024-05-20 Price Changed $135,000 HARMLS
- 2024-05-16 Price Changed $136,000 HARMLS
- 2024-05-14 Price Changed $137,000 HARMLS
- 2024-05-13 Price Changed $138,000 HARMLS
- 2024-05-03 Price Changed $139,000 HARMLS
- 2024-05-01 Price Changed $139,500 HARMLS
- 2024-04-29 Price Changed $149,500 HARMLS
- 2024-04-10 Listed $151,500 HARMLS
- 2023-04-14 Sold (MLS) — HARMLS
- 2023-03-23 Pending — HARMLS
- 2023-03-15 Listed $130,000 HARMLS
- 1988-01-01 Sold (Public Records) — Public Records
Property tax history
+11.0%/yrLatest (2025): $2,906 · +2.9% YoY. Source: county tax records.
Cash-flow waterfall
monthlySold comps — $/sqft
last 12 mo · ≤1 miLoading sold comps…