 Triplex
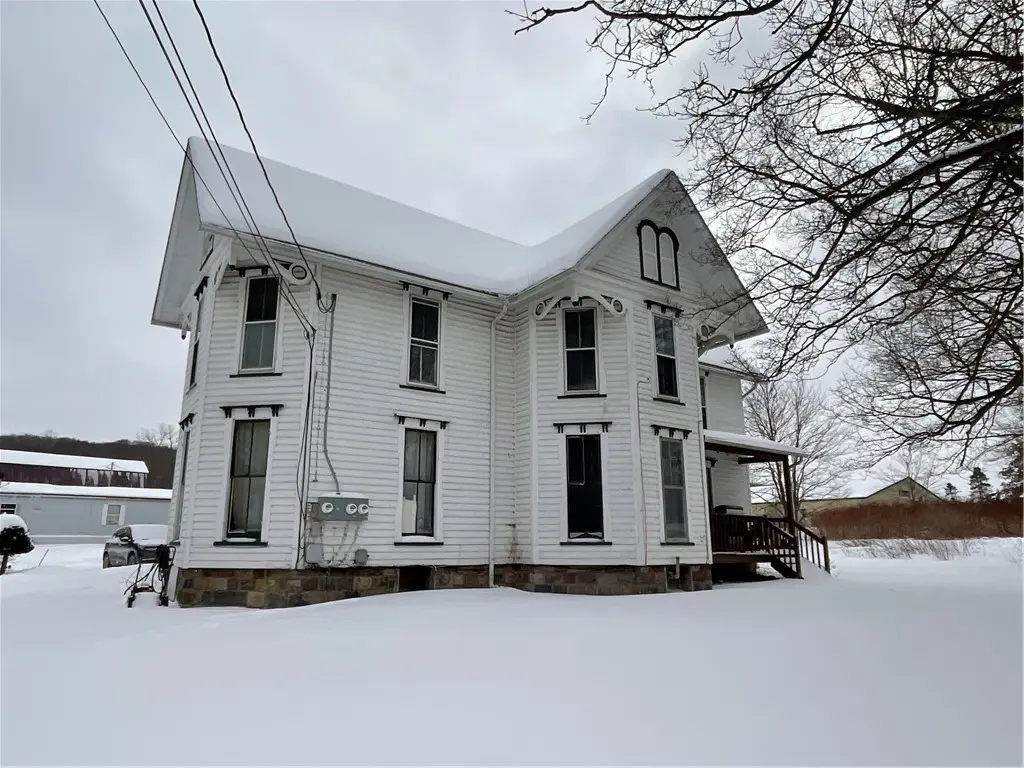
7434 Marvin Hill Rd · Springwater, NY
Flood risk 1/10 · Minimal
- FEMA flood zone
- X
- Chance of flooding over 30 yrs
- 0.0%
- Est. flood insurance / yr
- $473 – $860
Fire risk 3/10 · Minor
- Est. fire insurance / yr
- $691 – $1,283
Heat risk 2/10 · Minimal
- Hot days now (above 89°F)
- 8 days/yr
- Hot days in 30 yrs
- 19 days/yr
Wind risk 1/10 · Minimal
- Chance of severe wind over 30 yrs
- —
Air-quality risk 1/10 · Minimal
- Unhealthy air days now
- 0 days/yr
- Unhealthy air days in 30 yrs
- 0 days/yr
Risk factors via First Street. Map © Google.
Why this score? — see what drove the B- grade
The composite is a weighted blend of 9 inputs, each scored 0–100. Each bar is that input's sub-score; the figure is the points it added to the 100-point composite (weight × sub-score).
- Cash flow +30.0/30.0
- 1% rule +10.0/10.0
- DSCR +10.0/10.0
- ARV discount +7.5/15.0
- Schools +4.0/10.0
- Rent growth +2.5/5.0
- Livability +2.5/5.0
- Condition / age +2.5/5.0
- Appreciation +0.0/10.0
$149,900
🖨 Deal sheet 📄 Offer letter ✓ Due diligence
Multi-family units
County records classify this as Multi-Family (2-4 Unit). Listing-text estimate: 3 units. confirmed
Listing remarks MLS
INCOME OPPORTUNITY - Three unit located in the heart of Springwater - walking distance to Dollar General, convenience store, gas station and more! Home is in need of some rehabilitation - being sold "as is". Apartment B (upstairs unit is currently vacant). Purchase the property and do some work to the second level three bedroom apartment and pick your own tenant. Or better yet have the two lower apartments help offset your mortgage and live in the second floor unit as an owner occupant. Many possibilities here for the right investor. Separate utilities, off street parking and large corner lot (1.20 acres). We must provide at a minimum a 24 hour notice for all showing requests. No delayed negotiations on this one!
Key facts
- Separate utilities
- Three unit
- Off street parking
Tags
Neighborhood map
What this means for you Summary
Snapshot
- This is a 3 × 5-bed/3.0-bath units multifamily listed at $150k.
Deal economics
- At list price, monthly cash flow is $2k ($26k/yr) — positive. Per door: $734/mo.
- The deal already cash-flows at list — no discount required.
- Meets the 1% rule at list price ($4k rent vs $150k).
- Recommended offer: $141k (6.0% below list) — sets the bar for market timing.
Location & tenants
- Location reads: area grade B — affects rentability + tenant quality, not the cash-flow math above.
- Wayland-Cohocton Central School District (rural): math 40% / reading 53% proficiency, ranked #446 of 590 in NY (top 76%) — families likely to look elsewhere, expect single-tenant / working-renter base with shorter leases.
- Market conditions: 15 active listings in the ZIP; 86 units permitted in Livingston County in 2024 (0 in 5+ unit buildings).
Forward outlook
- Local home prices are declining (-3.0%/yr); year-one equity from $1k of loan paydown is wiped out by about $4k of value loss. Plan a longer hold.
- Livingston County population projected at -13% by 2050 — secular population decline; favor cash flow + early exit over multi-decade hold.
- At projected returns (-3.0% appreciation + 3.0% rent growth), your $42k cash investment doubles in ~2 years — after that, you're playing with house money.
Negotiation context
- It's been on market 77 days — a 6% lower offer ($141k) is reasonable based on typical stale-listing flexibility.
- Current owner paid $111k; 35% above their basis — modest negotiation headroom, anchor on the comps not their cost.
Risks & watch-outs
- Watch-outs: property tax is 2.9% of price; built in 1900 — expect roof / HVAC / electrical / plumbing capex.
Questions for the listing agent
- It's been on market 77 days. Have you received any prior offers? Is the seller open to a 6% concession, seller financing, or rate buy-down credit?
- Can we see the unit-by-unit rent roll, current vacancy, and any below-market leases? What's the average tenancy length?
- What capital expenditures (roof, boiler, parking lot, exteriors) have been made in the last 5 years, and what's planned in the next 2?
- Built in 1900 — when were the roof, HVAC, electrical panel, plumbing, and water heater last replaced?
- Property tax is high relative to price — has the assessment been appealed recently, and will the sale trigger a re-assessment?
- Why hasn't it sold? Are there any deal-killer items the seller is aware of (foundation, flood, title, zoning, code violations)?
- Is there a deadline driving the sale (1031 exchange, divorce, estate, relocation)? That informs how much negotiation room exists.
- What's the average days-on-market for RENTAL listings here right now (not sales)? A rising rental-DOM trend means longer vacancies and softer asking-rent achievability than the comps imply.
- What's the recent tenant-quality profile in this submarket — average credit score on applications, eviction rate, late-payment / NSF rate, and stable-employment percentage? A property-management company in the area should have these aggregated.
- How much new apartment / multifamily construction is in the pipeline within 1–3 miles? Heavy new supply (>2% of stock underway) typically softens rents 12–24 months out; light construction supports rent growth.
Investment metrics
- 1% rule
- 2.88% ✓
- Cap rate
- 23.91%
- Cash-on-cash
- 62.92%
- DSCR
- 3.80
- GRM
- 2.9
CMA / ARV
No comps found within radius.
Projected returns pro-forma
-3.0% appreciation · 3.0% rent growth · sell at horizon
- IRR
- 61.9%
- Equity multiple
- 3.76×
- Total profit
- $116,041
- Equity at exit
- $22,351
- IRR
- 66.5%
- Equity multiple
- 7.72×
- Total profit
- $282,226
- Equity at exit
- $12,961
Cash invested: $41,972 (down + closing). Projections, not guarantees.
Landlord ↔ Tenant lean methodology
- Overall (STATE)
- 15 Strongly Tenant-Friendly
- State New York
- 15 Strongly Tenant-Friendly · D+10
- County
- — inherits STATE
- City
- — inherits STATE
ZIP-level market 14560
- Home prices YoY
- -14.5%
- Active inventory
- 15
- Price-to-rent
- 8.7×
Monthly cashflow live
- Estimated rent
- $4,320 medium interval (Pro) →
- Mortgage (P&I)
- −$786
- Tax from tax record
- −$364 /mo · $4,364/yr
- Insurance
- −$62
- HOA
- −$0
- Vacancy / Maint / Mgmt
- −$907
- Net cashflow
- $2,201
Break-even live
3-unit breakdown (identical units grouped — click to expand)
| Units | Beds | Baths | Est. rent |
|---|---|---|---|
| 3× units | 5 | 3 | $4,320 |
| #1 | 5 | 3 | $1,440 |
| #2 | 5 | 3 | $1,440 |
| #3 | 5 | 3 | $1,440 |
| Total (3 units) | $4,320 | ||
UW: 25.0% down · 7.5% · 30yr · 1.5% tax · 5.0% vac · 8.0% maint · 8.0% mgmt
Financing live
Cash to close
- Down payment
- $37,475
- Closing costs
- $4,497
- Reserves months
- —
- Total cash needed
- —
Loan-product check · same deal, 3 products live
Conventional
25% down · 7.5% · 30yr
- Down + closing
- —
- Monthly P&I
- —
- Monthly cashflow
- —
- DSCR
- —
- Eligible?
- —
Personal DTI + credit; lowest rate.
DSCR
20% down · 8.5% · 30yr
- Down + closing
- —
- Monthly P&I
- —
- Monthly cashflow
- —
- DSCR
- —
- Eligible?
- —
No personal income docs; deal must DSCR.
Hard money
10% down · 12.0% · 12mo
- Down + closing
- —
- Monthly P&I
- —
- Monthly cashflow
- —
- DSCR
- —
- Eligible?
- —
Short-term bridge; refi at stabilization.
Listing history 3 events
-
2026-03-11$149,900 Active 734-char remark
Show marketing remark (734 chars)
INCOME OPPORTUNITY - Three unit located in the heart of Springwater - walking distance to Dollar General, convenience store, gas station and more! Home is in need of some rehabilitation - being sold "as is". Apartment B (upstairs unit is currently vacant). Purchase the property and do some work to the second level three bedroom apartment and pick your own tenant. Or better yet have the two lower apartments help offset your mortgage and live in the second floor unit as an owner occupant. Many possibilities here for the right investor. Separate utilities, off street parking and large corner lot (1.20 acres). We must provide at a minimum a 24 hour notice for all showing requests. No delayed negotiations on this one!
-
2011-10-21soldstatus $111,000
-
2002-01-24soldstatus $74,500
ⓘ Source: listings_history table (triggers on properties + properties_extension) + one-shot
backfill from property_details.listing_events for pre-trigger history.
Tax reassessment forecast NY · Partial reset (capped growth)
- Current annual tax
- $4,364 · $364/mo
- Projected year-2 tax
- $4,364 · $364/mo
- Expected delta
- $0/yr ($0/mo · 0.0%)
ⓘ Screening estimate from a state-policy table — verify with the county assessor before closing.
Climate risk First Street
- Flood 1/10 Low FEMA zone X · 0% chance over 30 yrs
- Wildfire 3/10 Moderate
- Heat 2/10 Low 8 d/yr ≥89°F today · 19 d/yr by 30 yrs out
- Wind 1/10 Low
- Air quality 1/10 Low 0 unhealthy d/yr today · 0 by 30 yrs out
Nearby sold comps map
Loading sold comps map…
Walkable amenities ~0.75 mi
Loading nearby amenities…
Taxation est. · year 1
- Rental income
- $51,840
- − Mortgage interest
- −$8,397
- − Property taxes
- −$4,364
- − Insurance
- −$750
- − Repairs & maintenance
- −$4,147
- − Management
- −$4,147
- − Depreciation
- −$4,361
- Taxable income
- $25,675
- Est. tax owed @ 24.0%
- −$6,162
- After-tax cash flow
- $20,245/yr
For passive investors: Depreciation is non-cash, so a rental often shows a tax loss while cash-flowing — sheltering income. Rental losses are passive: they offset passive income freely, and up to $25,000/yr can offset ordinary (W-2) income if you actively participate and your MAGI is under $100k (phasing out to $0 by $150k); unused losses carry forward. On sale, claimed depreciation is recaptured at up to 25%, and gains may owe capital-gains tax (a 1031 exchange can defer both). Figures are a year-1 estimate at your 24.0% rate — not tax advice; consult a CPA.
Schools (NCES district)
- District
- Wayland-Cohocton Central School District
- NCES district ID
- 3600011
- Math proficiency
- 40% ▼ -18.00%
- Reading proficiency
- 53% ▲ 8.00%
- Median HH income
- $46,957
- Composite
- 39.54/100
- National rank
- #3940
- State rank
- #446 of 590 in NY
Livability — Springwater
No livability data for this city. (Only ~50 U.S. cities are tracked.)
Census & demographics
- Census place
- Springwater, NY
- Population (ZIP)
- 2,392
Population outlook (Livingston County) Hauer SSP2
- Today (2025)
- 63,466 people
- By 2030
- 61,966 · -2.4%
- By 2040
- 58,398 · -8.0%
- By 2050
- 54,955 · -13.4%
- By 2075
- 49,958 · -21.3%
- By 2100
- 43,944 · -30.8%
Race, ethnicity, and origin ACS 2023
- Neighborhood character
- Predominantly White (89%)
- Race & ethnicity
- White 89% Two or more races 7% Hispanic / Latino 3%
- Common ancestry
- Iranian 5% Lithuanian 4% Romanian 3%
- Foreign-born
- 1% · Canada
Political lean MEDSL · Livingston
- 2024 margin
- Strong R (+21.4) · D 39.3% · R 60.7%
- 2008→2024 swing
- -13.6pp toward R · 2008: -7.9pp · 2024: -21.4pp
- All cycles
- 2024: R+21.4 2020: R+18.2 2016: R+27.8 2012: R+9.4 2008: R+7.9
Not yet ingested
- Civics
- —
Market trends
- HPI YoY
- ▼ -45.65%
- Current HPI
- 268.2617
- Rent YoY
- —
- Metro
- —
- State GDP YoY
- ▲ 2.60%
- F500 in state
- 92
Industry mix (Fortune 500 HQ in NY)
| Industry | F500 HQs | Revenue |
|---|---|---|
| Financial Services | 10 | $950B |
|
||
| Consumer Goods | 9 | $162B |
|
||
| Insurance | 4 | $225B |
|
||
| Telecommunications | 2 | $144B |
|
||
| Pharmaceuticals | 2 | $112B |
|
||
| Media / Entertainment | 2 | $69B |
|
||
Price history
+101.2% since first listed3 events — show timeline
- 2026-03-11 Listed $149,900 UNYREIS
- 2011-10-21 Sold (Public Records) $111,000 Public Records
- 2002-01-24 Sold (Public Records) $74,500 Public Records
Property tax history
-4.0%/yrLatest (2025): $4,364 · +0.0% YoY. Source: county tax records.
Cash-flow waterfall
monthlySold comps — $/sqft
last 12 mo · ≤1 miLoading sold comps…