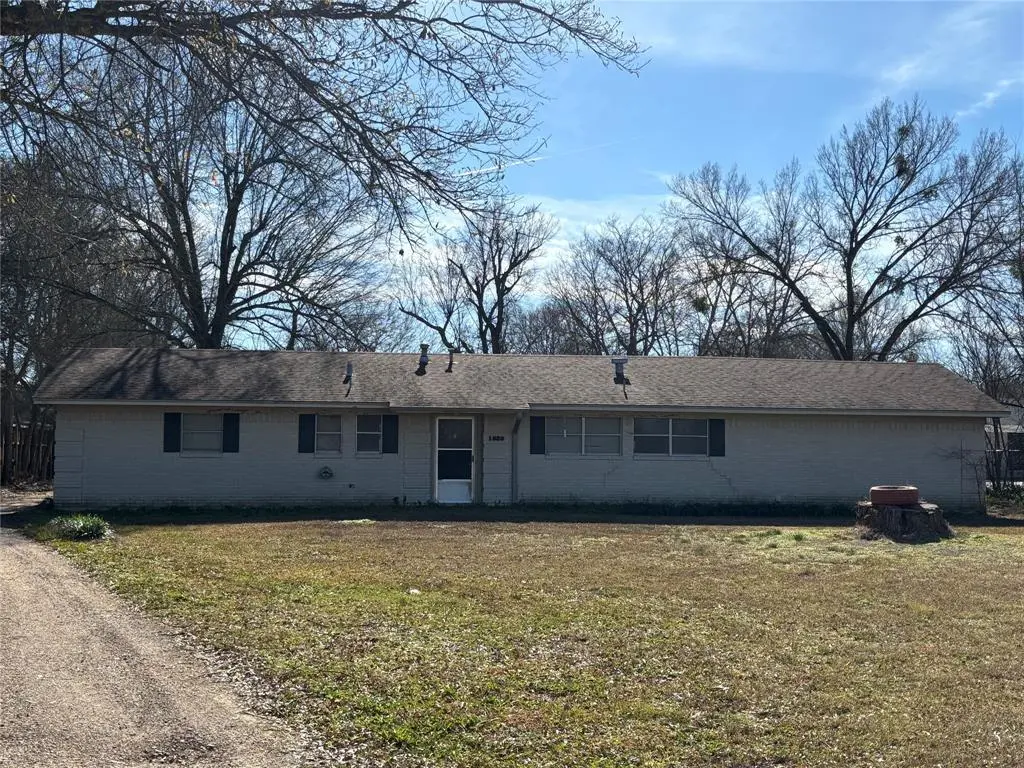
1930 FM 195 · Paris, TX
Flood risk 1/10 · Minimal
- FEMA flood zone
- X (unshaded)
- Chance of flooding over 30 yrs
- 0.0%
- Est. flood insurance / yr
- $507 – $1,088
Fire risk 6/10 · Moderate
- Est. fire insurance / yr
- $1,222 – $2,270
Heat risk 7/10 · Major
- Hot days now (above 110°F)
- 7 days/yr
- Hot days in 30 yrs
- 22 days/yr
Wind risk 4/10 · Minor
- Chance of severe wind over 30 yrs
- 18.0%
Air-quality risk 2/10 · Minimal
- Unhealthy air days now
- 0 days/yr
- Unhealthy air days in 30 yrs
- 1 days/yr
Risk factors via First Street. Map © Google.
Why this score? — see what drove the D grade
The composite is a weighted blend of 9 inputs, each scored 0–100. Each bar is that input's sub-score; the figure is the points it added to the 100-point composite (weight × sub-score).
- ARV discount +13.8/15.0
- Cash flow +10.2/30.0
- Schools +3.8/10.0
- Livability +3.1/5.0
- DSCR +2.9/10.0
- Rent growth +2.5/5.0
- Condition / age +2.5/5.0
- 1% rule +2.0/10.0
- Appreciation +0.0/10.0
$210,000
🖨 Deal sheet 📄 Offer letter ✓ Due diligence
Listing remarks MLS
5-bedroom, 2 bath brick home located on FM 195 in Paris. This home has a spacious backyard with a 3-bay shop & circle driveway in the back. Great investment opportunity. Subject to receivership terms: All offers are subject to 10 business day accept or reject period offer to be sold AS IS and close within 30 days of acceptance. Buyer must provide proof of funds of prequalification letter with offer.
Key facts
- Spacious backyard
- 3-bay shop
- Circle driveway
Tags
Neighborhood map
What this means for you Summary
Snapshot
- This is a 5-bed/2.0-bath single-family listed at $210k.
Deal economics
- At list price, monthly cash flow is $-119 ($-1k/yr) — negative.
- To cash-flow at today's rent, offer at most $189k (10.0% below list).
- To meet the 1% rule (rent ≥ 1% of price), the offer needs to be $148k (29.6% below list).
- Recommended offer: $148k (29.6% below list) — sets the bar for 1% rule.
- Cap rate 5.6% vs local median 3.6% in Paris — top-decile yield for the area; either an underpriced asset or a hidden risk that comps aren't pricing in. Stress-test before assuming the spread holds.
Location & tenants
- Location reads 61/100 on livability (#984 in TX) — a middle-class / working-renter tenant base. Strengths: cost of living A+, housing A+; Watch: schools D+, crime F, amenities F.
- North Lamar ISD (rural): math 43% / reading 45% proficiency, ranked #275 of 826 in TX (top 33%) — families likely to look elsewhere, expect single-tenant / working-renter base with shorter leases.
- Market conditions: 274 active listings in the ZIP; 119 units permitted in Lamar County in 2024 (71 in 5+ unit buildings).
- This rent runs 38% of the median local income ($46k/yr) — at the standard rent-burdened threshold; future hikes will face affordability resistance.
Forward outlook
- Local home prices are declining (-3.0%/yr); year-one equity from $1k of loan paydown is wiped out by about $6k of value loss. Plan a longer hold.
- Lamar County population projected at -13% by 2050 — secular population decline; favor cash flow + early exit over multi-decade hold.
Negotiation context
- It's been on market 140 days — a 12% lower offer ($185k) is reasonable based on typical stale-listing flexibility.
- 2 sale attempts with the ask held roughly flat each time — persistent listings suggest the price (not the market) is what's stuck; bring a comps-based counter.
Risks & watch-outs
- Climate carrying-cost: major wildfire risk; extreme-heat days projected 7→22/yr by 2055 (HVAC capex compounding) — expect insurance premiums to compound above CPI over the hold.
Questions for the listing agent
- What do current leases actually rent for vs. the listed asking? Can we see a recent rent roll and the last 12 months of T-12 income?
- It's been on market 140 days. Have you received any prior offers? Is the seller open to a 30% concession, seller financing, or rate buy-down credit?
- Why hasn't it sold? Are there any deal-killer items the seller is aware of (foundation, flood, title, zoning, code violations)?
- Is there a deadline driving the sale (1031 exchange, divorce, estate, relocation)? That informs how much negotiation room exists.
- Schools are D-rated, which usually means shorter tenancies and higher turnover. Who's the typical renter profile here, and what's been the actual vacancy rate?
- Crime grade is F in this area — have there been break-ins, vandalism, or insurance claims at this property in the last 3 years? What carrier currently insures it and at what premium?
- The area grade is low — what's the realistic commute time and amenity access for the typical tenant pool here? Any planned neighborhood developments (good or bad) we should know about?
- What's the average days-on-market for RENTAL listings here right now (not sales)? A rising rental-DOM trend means longer vacancies and softer asking-rent achievability than the comps imply.
- What's the recent tenant-quality profile in this submarket — average credit score on applications, eviction rate, late-payment / NSF rate, and stable-employment percentage? A property-management company in the area should have these aggregated.
- How much new for-sale + rental construction is in the pipeline within 1–3 miles? Heavy new supply typically softens prices + rents 12–24 months out; constrained supply supports both.
Investment metrics
- 1% rule
- 0.70% ✗
- Cap rate
- 5.61%
- Cash-on-cash
- -2.43%
- DSCR
- 0.89
- GRM
- 11.8
CMA / ARV
- ARV (median comp)
- $243,942
- List price
- $210,000
- Delta
- -13.91%
- Verdict
- UNDERPRICED
- Comps
- 13 within 1.0 mi
Show comp detail 3 sales within ~0.75 mi
| Address | Dist | Beds/Ba | Sqft | Sold | Price | $/sf | Match |
|---|---|---|---|---|---|---|---|
| 2815 Ballard Dr | 0.62mi | 4/2.0 (-1) | 2,116 (+6%) | 1mo | $279,000 | $132 | 56 |
| 2365 Crescent Dr | 0.62mi | 4/2.5 (-1) | 1,808 (-10%) | 5mo | $130,000 | $72 | 44 |
| 2815 Ridgeview NONE | 0.74mi | 4/2.0 (-1) | 2,221 (+11%) | 12mo | $297,900 | $134 | 32 |
Match score weights: distance 35% · size 25% · config 20% · recency 20%. Top-matched comps best support the ARV.
Projected returns pro-forma
-3.0% appreciation · 3.0% rent growth · sell at horizon
- IRR
- -20.4%
- Equity multiple
- 0.29×
- Total profit
- $-41,691
- Equity at exit
- $31,312
- IRR
- -13.6%
- Equity multiple
- 0.21×
- Total profit
- $-46,389
- Equity at exit
- $18,157
Cash invested: $58,800 (down + closing). Projections, not guarantees.
Landlord ↔ Tenant lean methodology
- Overall (STATE)
- 87 Strongly Landlord-Friendly
- State Texas
- 87 Strongly Landlord-Friendly · R+5
- County
- — inherits STATE
- City
- — inherits STATE
ZIP-level market 75460
- Active inventory
- 274
- Price-to-rent
- 11.8×
Monthly cashflow live
- Estimated rent
- $1,478 medium interval (Pro) →
- Mortgage (P&I)
- −$1,101
- Tax from tax record
- −$98 /mo · $1,172/yr
- Insurance
- −$88
- HOA
- −$0
- Vacancy / Maint / Mgmt
- −$310
- Net cashflow
- $-119
Break-even live
UW: 25.0% down · 7.5% · 30yr · 1.5% tax · 5.0% vac · 8.0% maint · 8.0% mgmt
Financing live
Cash to close
- Down payment
- $52,500
- Closing costs
- $6,300
- Reserves months
- —
- Total cash needed
- —
Loan-product check · same deal, 3 products live
Conventional
25% down · 7.5% · 30yr
- Down + closing
- —
- Monthly P&I
- —
- Monthly cashflow
- —
- DSCR
- —
- Eligible?
- —
Personal DTI + credit; lowest rate.
DSCR
20% down · 8.5% · 30yr
- Down + closing
- —
- Monthly P&I
- —
- Monthly cashflow
- —
- DSCR
- —
- Eligible?
- —
No personal income docs; deal must DSCR.
Hard money
10% down · 12.0% · 12mo
- Down + closing
- —
- Monthly P&I
- —
- Monthly cashflow
- —
- DSCR
- —
- Eligible?
- —
Short-term bridge; refi at stabilization.
Listing history 19 events
-
2026-06-19days on market $210,000 Active 140 DOM
-
2026-06-18days on market $210,000 Active 139 DOM
-
2026-06-17days on market $210,000 Active 138 DOM
-
2026-06-16days on market $210,000 Active 137 DOM
-
2026-06-15days on market $210,000 Active 136 DOM
-
2026-06-14days on market $210,000 Active 134 DOM
-
2026-06-12days on market $210,000 Active 133 DOM
-
2026-06-09days on market $210,000 Active 130 DOM
-
2026-06-08days on market $210,000 Active 129 DOM
-
2026-06-07days on market $210,000 Active 128 DOM
-
2026-06-03days on market $210,000 Active 124 DOM
-
2026-06-02days on market $210,000 Active 123 DOM
-
2026-06-01days on market $210,000 Active 122 DOM
-
2026-05-31days on market $210,000 Active 121 DOM
-
2026-05-31days on market $210,000 Active 120 DOM
-
2026-03-13status Active 406-char remark
Show marketing remark (406 chars)
5-bedroom, 2 bath brick home located on FM 195 in Paris. This home has a spacious backyard with a 3-bay shop & circle driveway in the back. Great investment opportunity. Subject to receivership terms: All offers are subject to 10 business day accept or reject period offer to be sold AS IS and close within 30 days of acceptance. Buyer must provide proof of funds of prequalification letter with offer.
-
2026-01-06$210,000 Active 406-char remark
Show marketing remark (406 chars)
5-bedroom, 2 bath brick home located on FM 195 in Paris. This home has a spacious backyard with a 3-bay shop & circle driveway in the back. Great investment opportunity. Subject to receivership terms: All offers are subject to 10 business day accept or reject period offer to be sold AS IS and close within 30 days of acceptance. Buyer must provide proof of funds of prequalification letter with offer.
-
2022-11-02soldstatus
-
2006-05-19soldstatus
ⓘ Source: listings_history table (triggers on properties + properties_extension) + one-shot
backfill from property_details.listing_events for pre-trigger history.
Tax reassessment forecast TX · Resets to sale price
- Current annual tax
- $1,172 · $98/mo
- Projected year-2 tax
- $3,843 · $320/mo
- Expected delta
- +$2,671/yr (+$223/mo · 227.8%)
ⓘ Screening estimate from a state-policy table — verify with the county assessor before closing.
Climate risk First Street
- Flood 1/10 Low FEMA zone X (unshaded) · 0% chance over 30 yrs
- Wildfire 6/10 Major
- Heat 7/10 Severe 7 d/yr ≥110°F today · 22 d/yr by 30 yrs out
- Wind 4/10 Moderate 18% chance of damaging wind over 30 yrs
- Air quality 2/10 Low 0 unhealthy d/yr today · 1 by 30 yrs out
Nearby sold comps map
Loading sold comps map…
Walkable amenities ~0.75 mi
Loading nearby amenities…
Taxation est. · year 1
- Rental income
- $17,733
- − Mortgage interest
- −$11,763
- − Property taxes
- −$1,172
- − Insurance
- −$1,050
- − Repairs & maintenance
- −$1,419
- − Management
- −$1,419
- − Depreciation
- −$6,109
- Taxable loss
- −$5,199
- Est. tax savings @ 24.0%
- +$1,248
- After-tax cash flow
- $-181/yr
For passive investors: Depreciation is non-cash, so a rental often shows a tax loss while cash-flowing — sheltering income. Rental losses are passive: they offset passive income freely, and up to $25,000/yr can offset ordinary (W-2) income if you actively participate and your MAGI is under $100k (phasing out to $0 by $150k); unused losses carry forward. On sale, claimed depreciation is recaptured at up to 25%, and gains may owe capital-gains tax (a 1031 exchange can defer both). Figures are a year-1 estimate at your 24.0% rate — not tax advice; consult a CPA.
Schools (NCES district)
- District
- North Lamar ISD
- NCES district ID
- 4833010
- Math proficiency
- 43% ▼ -9.00%
- Reading proficiency
- 45% ▼ -4.00%
- Median HH income
- $53,328
- Composite
- 38.13/100
- National rank
- #4270
- State rank
- #275 of 826 in TX
Livability — Paris
- Score
- 61/100
- State rank
- #984
- US rank
- #17535
Category grades
Schools grade is shown separately in the Schools card above.
Census & demographics
- Census place
- Paris, TX
- County
- Lamar County · 23,426 people
- City population
- 23,426
- Metro
- Paris, TX
- Population (ZIP)
- 23,426
- Household income
- $46,473
- Rent vs Own
- Severe rent burden
- 1355.0
Population outlook (Lamar County) Hauer SSP2
- Today (2025)
- 48,319 people
- By 2030
- 47,160 · -2.4%
- By 2040
- 44,621 · -7.7%
- By 2050
- 42,024 · -13.0%
- By 2075
- 36,577 · -24.3%
- By 2100
- 30,580 · -36.7%
Race, ethnicity, and origin ACS 2023
- Neighborhood character
- Diverse neighborhood (Simpson 0.60)
- Race & ethnicity
- White 58% Black 22% Hispanic / Latino 13% Two or more races 8%
- Hispanic origin (detail)
- Mexican 12%
- Common ancestry
- Lithuanian 1% Slovak 1% Italian 1%
- Foreign-born
- 3% · Canada, China
- Languages at home
- 92% English-only · Spanish 7%
Political lean MEDSL · Lamar
- 2024 margin
- Solid R (+61.0) · D 19.2% · R 80.3%
- 2008→2024 swing
- -19.1pp toward R · 2008: -42.0pp · 2024: -61.0pp
- All cycles
- 2024: R+61.0 2020: R+57.4 2016: R+59.2 2012: R+50.3 2008: R+42.0
Not yet ingested
- Civics
- —
Market trends
- HPI YoY
- ▼ -201.50%
- Current HPI
- 145.3511
- Rent YoY
- —
- Metro
- Paris, TX
- State GDP YoY
- ▲ 3.95%
- F500 in state
- 110
Industry mix (Fortune 500 HQ in TX)
| Industry | F500 HQs | Revenue |
|---|---|---|
| Energy | 16 | $1,198B |
|
||
| Technology | 5 | $198B |
|
||
| Engineering / Construction | 4 | $72B |
|
||
| Energy Services | 3 | $60B |
|
||
| Utilities | 3 | $41B |
|
||
| Healthcare | 2 | $330B |
|
||
Price history
4 events — show timeline
- 2026-03-13 Relisted — NTREIS
- 2026-01-06 Listed $210,000 NTREIS
- 2022-11-02 Sold (Public Records) — Public Records
- 2006-05-19 Sold (Public Records) — Public Records
Property tax history
-3.4%/yrLatest (2025): $1,172 · +14.6% YoY. Source: county tax records.
Cash-flow waterfall
monthlySold comps — $/sqft
last 12 mo · ≤1 miLoading sold comps…