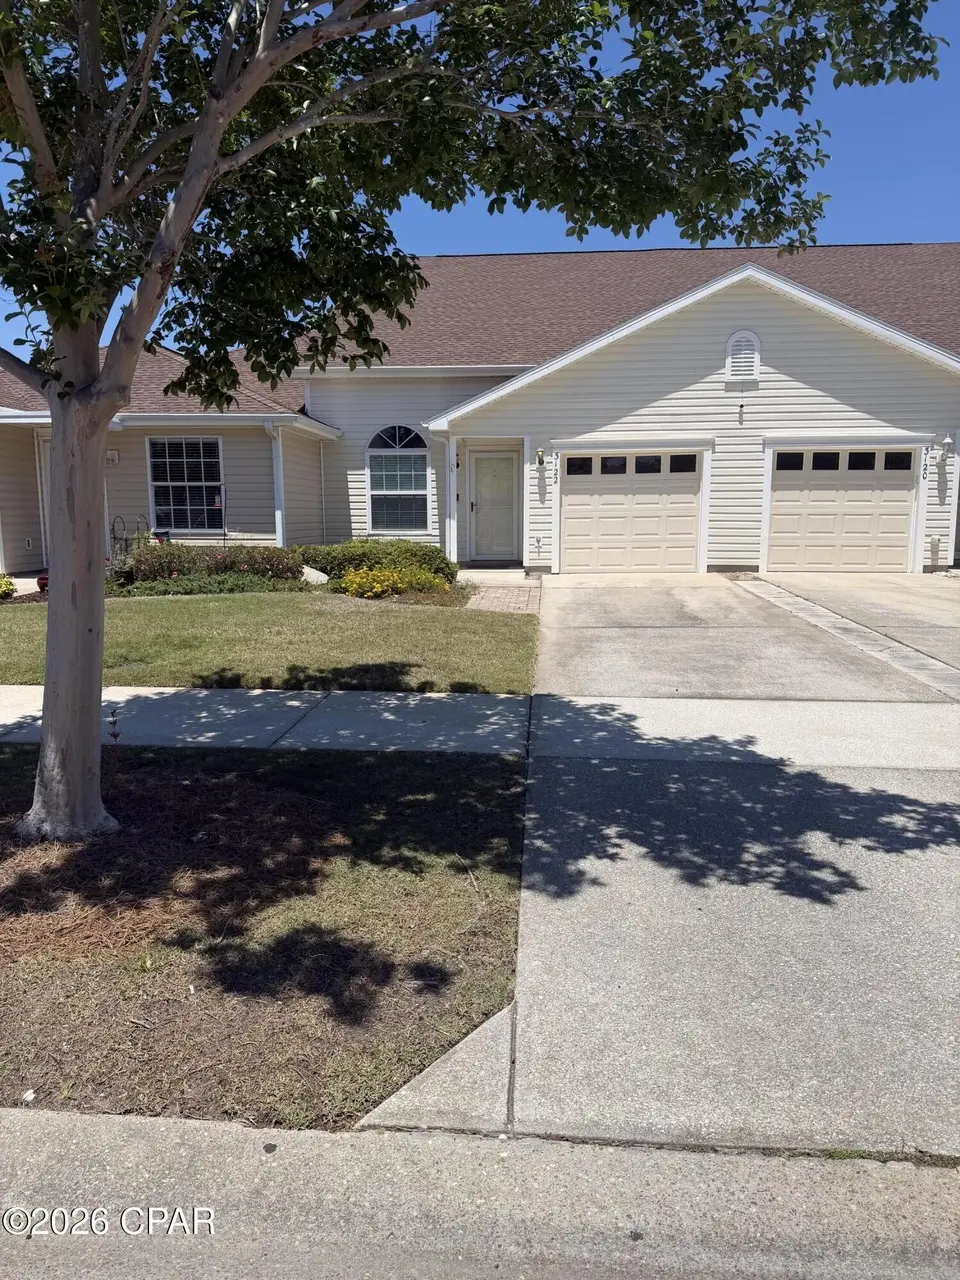
3122 Meadow St · Lynn Haven, FL
Flood risk 1/10 · Minimal
- FEMA flood zone
- X (unshaded)
- Chance of flooding over 30 yrs
- 0.0%
- Est. flood insurance / yr
- $507 – $1,088
Fire risk 4/10 · Minor
- Est. fire insurance / yr
- $947 – $1,759
Heat risk 10/10 · Severe
- Hot days now (above 105°F)
- 7 days/yr
- Hot days in 30 yrs
- 22 days/yr
Wind risk 9/10 · Severe
- Chance of severe wind over 30 yrs
- 99.0%
Air-quality risk 1/10 · Minimal
- Unhealthy air days now
- 0 days/yr
- Unhealthy air days in 30 yrs
- 0 days/yr
Risk factors via First Street. Map © Google.
Why this score? — see what drove the D+ grade
The composite is a weighted blend of 9 inputs, each scored 0–100. Each bar is that input's sub-score; the figure is the points it added to the 100-point composite (weight × sub-score).
- ARV discount +14.4/15.0
- Cash flow +13.6/30.0
- Schools +4.3/10.0
- DSCR +4.1/10.0
- Livability +4.0/5.0
- Rent growth +3.1/5.0
- 1% rule +2.8/10.0
- Condition / age +2.5/5.0
- Appreciation +0.0/10.0
$279,900
🖨 Deal sheet 📄 Offer letter ✓ Due diligence
Listing remarks MLS
Welcome to The Hammocks, a planned community developed by St. Joe. This neighborhood community features a community pool and lighted sidewalks. The home is located within minutes of Hiland Park Elementary, Mowat Middle School, & Mosley High School. Tyndall AFB is just twenty-five minutes away, while The Coastal System Station and the beautiful Gulf of Mexico are only 20 minutes away. This home features three bedrooms, two and a half baths, a must see as the home still looks brand new, with new paint and carpet! This home is ideal for an individual, couple, or a family. Come visit today!
Key facts
- Quartz countertops
- Screened paver patio
- Lvp flooring
Tags
Property features AI
Finance
- HOA & community: Homeowners association present; Community pool
Exterior
- Parking: 1-car garage
- Utilities: Electricity available; High speed internet available; Public sewer
- Home design: Resid Multi-Family zoning; Rooms include dining room, family room, kitchen, loft, breakfast nook, primary bedroom
- Construction: Vinyl siding; Composition/Shingle roof
- Exterior features: Porch; Screened porch; In-ground community pool; Paved lot
Interior
- Kitchen: Kitchen (approx. 13 x 13); Breakfast nook (approx. 9 x 6)
- Bedrooms: Bedrooms include upstairs bedrooms and a primary bedroom; Bedroom sizes include 11 x 9 (two bedrooms)
- Bathrooms: 2 full bathrooms; 1 half bathroom
- Heating & cooling: Central heating (electric); Central air conditioning; Ceiling fans
- Interior features: Loft
- Laundry & utility: Electric water heater
Neighborhood map
What this means for you Summary
Snapshot
- This is a 3-bed/3.0-bath single-family listed at $280k.
Deal economics
- At list price, monthly cash flow is $16 ($186/yr) — positive.
- The deal already cash-flows at list — no discount required.
- To meet the 1% rule (rent ≥ 1% of price), the offer needs to be $219k (21.6% below list).
- Recommended offer: $219k (21.6% below list) — sets the bar for 1% rule.
- Cap rate 6.4% vs local median 3.5% in Lynn Haven — top-decile yield for the area; either an underpriced asset or a hidden risk that comps aren't pricing in. Stress-test before assuming the spread holds.
Location & tenants
- Location reads 81/100 on livability (#96 in FL, #1,472 nationally) — a professional / high-income tenant draw. Strengths: crime A+, housing A+, health & safety A+; Watch: amenities D+, commute F.
- Bay (suburban): math 51% / reading 51% proficiency, ranked #29 of 73 in FL (top 40%) — acceptable for families but not a draw, mixed tenant base, ~2y average lease.
- Market conditions: Rents rising (+2.5%/yr); 196 active listings in the ZIP; 8 comparable units currently listed for rent nearby; rentals at typical pace (median 21d on market — plan ~3-4 weeks tenant-placement turnaround); solid renter incomes; 2,473 units permitted in Bay County in 2024 (559 in 5+ unit buildings).
- This rent runs 32% of the median local income ($83k/yr) — at the standard rent-burdened threshold; future hikes will face affordability resistance.
Forward outlook
- Local home prices are declining (-3.0%/yr); year-one equity from $2k of loan paydown is wiped out by about $8k of value loss. Plan a longer hold.
- Bay County population projected at +24% by 2050 — long-run rental-demand tailwind backs the buy-and-hold thesis.
Negotiation context
- It's been on market 36 days — a 3% lower offer ($272k) is reasonable based on typical stale-listing flexibility.
- 3 sale attempts since 25y ago with the ask held roughly flat each time — persistent listings suggest the price (not the market) is what's stuck; bring a comps-based counter.
- Current owner paid $150k; list at $280k implies a 87% gain — meaningful room to come down on a strong offer.
Risks & watch-outs
- Climate carrying-cost: severe wind risk, 99% chance of damaging wind over 30y; extreme-heat days projected 7→22/yr by 2055 (HVAC capex compounding) — expect insurance premiums to compound above CPI over the hold.
Questions for the listing agent
- It's been on market 36 days. Have you received any prior offers? Is the seller open to a 22% concession, seller financing, or rate buy-down credit?
- Is there a deadline driving the sale (1031 exchange, divorce, estate, relocation)? That informs how much negotiation room exists.
- Schools are B-rated — typically a magnet for longer-tenancy family renters. What's the average tenant stay here, and is there a school-zone premium baked into asking?
- The area grade is low — what's the realistic commute time and amenity access for the typical tenant pool here? Any planned neighborhood developments (good or bad) we should know about?
- What's the average days-on-market for RENTAL listings here right now (not sales)? A rising rental-DOM trend means longer vacancies and softer asking-rent achievability than the comps imply.
- What's the recent tenant-quality profile in this submarket — average credit score on applications, eviction rate, late-payment / NSF rate, and stable-employment percentage? A property-management company in the area should have these aggregated.
- How much new for-sale + rental construction is in the pipeline within 1–3 miles? Heavy new supply typically softens prices + rents 12–24 months out; constrained supply supports both.
Investment metrics
- 1% rule
- 0.78% ✗
- Cap rate
- 6.36%
- Cash-on-cash
- 0.24%
- DSCR
- 1.01
- GRM
- 10.6
CMA / ARV
- ARV (median comp)
- $330,384
- List price
- $279,900
- Delta
- -15.28%
- Verdict
- UNDERPRICED
- Comps
- 20 within 1.0 mi
Show comp detail 10 sales within ~0.75 mi
| Address | Dist | Beds/Ba | Sqft | Sold | Price | $/sf | Match |
|---|---|---|---|---|---|---|---|
| 3423 Cherry Ridge Rd | 0.35mi | 3/2.0 | 1,612 (+7%) | 10mo | $331,400 | $206 | 60 |
| 2530 E 37th Plz | 0.61mi | 3/2.0 | 1,411 (-6%) | 13mo | $250,000 | $177 | 46 |
| 1603 E 40th Pl | 0.68mi | 3/2.0 | 1,488 (-1%) | 20mo | $196,000 | $132 | 46 |
| 826 E 24th St | 0.58mi | 3/2.0 | 1,365 (-10%) | 13mo | $295,000 | $216 | 42 |
| 2531 E 37th St | 0.61mi | 3/2.0 | 1,332 (-12%) | 9mo | $246,150 | $185 | 40 |
| 2626 Paige Cir | 0.64mi | 4/2.0 (+1) | 1,535 (+2%) | 23mo | $330,000 | $215 | 39 |
| 3603 Azalea Ct | 0.49mi | 3/2.0 | 1,729 (+15%) | 13mo | $399,000 | $231 | 38 |
| 811 E 24th St | 0.63mi | 3/2.0 | 1,680 (+11%) | 14mo | $315,000 | $188 | 36 |
| 815 E 24th St | 0.61mi | 3/2.0 | 1,693 (+12%) | 24mo | $325,000 | $192 | 28 |
| 2517 E 37th St | 0.57mi | 3/2.0 | 1,300 (-14%) | 23mo | $249,000 | $192 | 27 |
Match score weights: distance 35% · size 25% · config 20% · recency 20%. Top-matched comps best support the ARV.
Projected returns pro-forma
-3.0% appreciation · 2.52% rent growth · sell at horizon
- IRR
- -16.5%
- Equity multiple
- 0.42×
- Total profit
- $-45,522
- Equity at exit
- $41,734
- IRR
- -9.1%
- Equity multiple
- 0.45×
- Total profit
- $-43,058
- Equity at exit
- $24,201
Cash invested: $78,372 (down + closing). Projections, not guarantees.
Landlord ↔ Tenant lean methodology
- Overall (STATE)
- 87 Strongly Landlord-Friendly
- State Florida
- 87 Strongly Landlord-Friendly · R+3
- County
- — inherits STATE
- City
- — inherits STATE
ZIP-level market 32444
- Home prices YoY
- -29.1%
- Rents YoY
- 2.5%
- Active inventory
- 196
- Price-to-rent
- 10.6×
Monthly cashflow live
- Estimated rent
- $2,195 high interval (Pro) →
- Mortgage (P&I)
- −$1,468
- Tax from tax record
- −$134 /mo · $1,608/yr
- Insurance
- −$117
- HOA
- −$0
- Vacancy / Maint / Mgmt
- −$461
- Net cashflow
- $16
Break-even live
UW: 25.0% down · 7.5% · 30yr · 1.5% tax · 5.0% vac · 8.0% maint · 8.0% mgmt
Financing live
Cash to close
- Down payment
- $69,975
- Closing costs
- $8,397
- Reserves months
- —
- Total cash needed
- —
Loan-product check · same deal, 3 products live
Conventional
25% down · 7.5% · 30yr
- Down + closing
- —
- Monthly P&I
- —
- Monthly cashflow
- —
- DSCR
- —
- Eligible?
- —
Personal DTI + credit; lowest rate.
DSCR
20% down · 8.5% · 30yr
- Down + closing
- —
- Monthly P&I
- —
- Monthly cashflow
- —
- DSCR
- —
- Eligible?
- —
No personal income docs; deal must DSCR.
Hard money
10% down · 12.0% · 12mo
- Down + closing
- —
- Monthly P&I
- —
- Monthly cashflow
- —
- DSCR
- —
- Eligible?
- —
Short-term bridge; refi at stabilization.
Rent comps 8 comps
| Address | Beds | Baths | Sqft | Rent | $/sqft | DOM | Units | Dist |
|---|---|---|---|---|---|---|---|---|
| 2305 Minnesota Ave Lynn Haven, FL | 4.0 | 2.0 | 1692 | $1,950 | $1.15 | 13d | 1 | 0.93mi |
| 2416 Camryns Xing Panama City, FL | 4.0 | 2.0 | 1867 | $2,100 | $1.12 | 21d | 1 | 0.94mi |
| 1713 Jakes Dr Panama City, FL | 3.0 | 2.5 | 1576 | $2,250 | $1.43 | 21d | 1 | 0.96mi |
| 108 Baldwin Rowe Cir Panama City, FL | 3.0 | 2.5 | 1604 | $2,350 | $1.47 | 21d | 1 | 1.09mi |
| 3126 Wood Valley Rd Panama City, FL | 3.0 | 2.0 | 1922 | $2,800 | $1.46 | 21d | 1 | 1.19mi |
| 2950 Harrison Ave Panama City, FL | 1.0–3.0 | 1.0–2.0 | 1199 | $1,725 | $1.44 | 21d | 6 | 1.35mi |
| 3502 Jenks Ave Panama City, FL | 1.0–3.0 | 1.0–2.0 | 1176 | $1,850 | $1.57 | 13d | 24 | 1.40mi |
| 2870 Harrison Ave Panama City, FL | 1.0–3.0 | 1.0–2.0 | 1230 | $1,770 | $1.44 | 21d | 1 | 1.44mi |
Listing history 23 events
-
2026-06-18status $279,900 Pending 36 DOM
-
2026-06-18days on market $279,900 Active 36 DOM
-
2026-06-17days on market $279,900 Active 35 DOM
-
2026-06-16days on market $279,900 Active 34 DOM
-
2026-06-15days on market $279,900 Active 33 DOM
-
2026-06-14days on market $279,900 Active 31 DOM
-
2026-06-13days on market $279,900 Active 30 DOM
-
2026-06-10days on market $279,900 Active 28 DOM
-
2026-06-09days on market $279,900 Active 27 DOM
-
2026-06-08days on market $279,900 Active 26 DOM
-
2026-06-07days on market $279,900 Active 25 DOM
-
2026-06-05days on market $279,900 Active 22 DOM
-
2026-06-03days on market $279,900 Active 21 DOM
-
2026-06-02days on market $279,900 Active 20 DOM
-
2026-06-01days on market $279,900 Active 19 DOM
-
2026-05-31days on market $279,900 Active 18 DOM
-
2026-05-30days on market $279,900 Active 17 DOM
-
2026-05-12$279,900 Active 2207-char remark
-
2015-09-16soldstatus $150,000
-
2015-09-10soldstatus $150,000 598-char remark
Show marketing remark (598 chars)
Welcome to The Hammocks, a planned community developed by St. Joe. This neighborhood community features a community pool and lighted sidewalks. The home is located within minutes of Hiland Park Elementary, Mowat Middle School, & Mosley High School. Tyndall AFB is just twenty-five minutes away, while The Coastal System Station and the beautiful Gulf of Mexico are only 20 minutes away. This home features three bedrooms, two and a half baths, a must see as the home still looks brand new, with new paint and carpet! This home is ideal for an individual, couple, or a family. Come visit today!
-
2015-01-23$155,000 598-char remark
Show marketing remark (598 chars)
Welcome to The Hammocks, a planned community developed by St. Joe. This neighborhood community features a community pool and lighted sidewalks. The home is located within minutes of Hiland Park Elementary, Mowat Middle School, & Mosley High School. Tyndall AFB is just twenty-five minutes away, while The Coastal System Station and the beautiful Gulf of Mexico are only 20 minutes away. This home features three bedrooms, two and a half baths, a must see as the home still looks brand new, with new paint and carpet! This home is ideal for an individual, couple, or a family. Come visit today!
-
2002-05-31soldstatus $116,165
Show marketing remark (281 chars)
Situated in the lush green countryside of Lynn Haven, this scenic community is conveniently located near shopping, entertainment, schools, churches and the airport. The distinctly elegant floor plans and models at The Hammocks have caused quite a stir in the real estate community.
-
2001-08-02$116,165
Show marketing remark (281 chars)
Situated in the lush green countryside of Lynn Haven, this scenic community is conveniently located near shopping, entertainment, schools, churches and the airport. The distinctly elegant floor plans and models at The Hammocks have caused quite a stir in the real estate community.
ⓘ Source: listings_history table (triggers on properties + properties_extension) + one-shot
backfill from property_details.listing_events for pre-trigger history.
Tax reassessment forecast FL · Resets to sale price
- Current annual tax
- $1,608 · $134/mo
- Projected year-2 tax
- $2,323 · $194/mo
- Expected delta
- +$715/yr (+$60/mo · 44.5%)
ⓘ Screening estimate from a state-policy table — verify with the county assessor before closing.
Climate risk First Street
- Flood 1/10 Low FEMA zone X (unshaded) · 0% chance over 30 yrs
- Wildfire 4/10 Moderate
- Heat 10/10 Extreme 7 d/yr ≥105°F today · 22 d/yr by 30 yrs out
- Wind 9/10 Extreme 99% chance of damaging wind over 30 yrs
- Air quality 1/10 Low 0 unhealthy d/yr today · 0 by 30 yrs out
Nearby sold comps map
Loading sold comps map…
Walkable amenities ~0.75 mi
Loading nearby amenities…
Taxation est. · year 1
- Rental income
- $26,339
- − Mortgage interest
- −$15,679
- − Property taxes
- −$1,608
- − Insurance
- −$1,400
- − Repairs & maintenance
- −$2,107
- − Management
- −$2,107
- − Depreciation
- −$8,143
- Taxable loss
- −$4,704
- Est. tax savings @ 24.0%
- +$1,129
- After-tax cash flow
- $1,315/yr
For passive investors: Depreciation is non-cash, so a rental often shows a tax loss while cash-flowing — sheltering income. Rental losses are passive: they offset passive income freely, and up to $25,000/yr can offset ordinary (W-2) income if you actively participate and your MAGI is under $100k (phasing out to $0 by $150k); unused losses carry forward. On sale, claimed depreciation is recaptured at up to 25%, and gains may owe capital-gains tax (a 1031 exchange can defer both). Figures are a year-1 estimate at your 24.0% rate — not tax advice; consult a CPA.
Schools (NCES district)
- District
- Bay
- NCES district ID
- 1200090
- Math proficiency
- 51% ▼ -8.00%
- Reading proficiency
- 51% ▼ -7.00%
- Median HH income
- $47,740
- Composite
- 43.41/100
- National rank
- #3014
- State rank
- #29 of 73 in FL
Livability — Lynn Haven
- Score
- 81/100
- State rank
- #96
- US rank
- #1472
Category grades
Schools grade is shown separately in the Schools card above.
Census & demographics
- Census place
- Lynn Haven, FL
- County
- Bay County · 163,593 people
- City population
- 21,459
- Metro
- Panama City, FL
- Population (ZIP)
- 21,459
- Household income
- $83,160
- Rent vs Own
- Severe rent burden
- 430.0
Population outlook (Bay County) Hauer SSP2
- Today (2025)
- 206,264 people
- By 2030
- 217,740 · +5.6%
- By 2040
- 238,738 · +15.7%
- By 2050
- 255,545 · +23.9%
- By 2075
- 288,295 · +39.8%
- By 2100
- 288,638 · +39.9%
Race, ethnicity, and origin ACS 2023
- Neighborhood character
- Predominantly White (75%)
- Race & ethnicity
- White 75% Two or more races 11% Hispanic / Latino 10% Black 6% Asian 3%
- Hispanic origin (detail)
- Mexican 2% Puerto Rican 2%
- Common ancestry
- Lithuanian 3% Romanian 3% Serbian 2%
- Foreign-born
- 10% · Canada, Vietnam, South Korea
- Languages at home
- 87% English-only · Spanish 8% Russian/Polish/Slavic 1% Other Indo-European 1%
Political lean MEDSL · Bay
- 2024 margin
- Solid R (+47.4) · D 25.8% · R 73.1% · Other 1.1%
- 2008→2024 swing
- -6.6pp toward R · 2008: -40.7pp · 2024: -47.4pp
- All cycles
- 2024: R+47.4 2020: R+43.5 2016: R+46.3 2012: R+43.6 2008: R+40.7
Not yet ingested
- Civics
- —
Market trends
- HPI YoY
- ▼ -108.08%
- Current HPI
- 263.5418
- Rent YoY
- ▲ 2.52%
- Metro
- Panama City, FL
- State GDP YoY
- ▲ 3.28%
- F500 in state
- 36
Industry mix (Fortune 500 HQ in FL)
| Industry | F500 HQs | Revenue |
|---|---|---|
| Industrial Technology | 2 | $29B |
|
||
| Insurance | 2 | $17B |
|
||
| Retail | 1 | $60B |
|
||
| Technology Distribution | 1 | $58B |
|
||
| Homebuilding | 1 | $35B |
|
||
| Technology Manufacturing | 1 | $35B |
|
||
Price history
+141.0% since first listed6 events — show timeline
- 2026-05-12 Listed $279,900 CPARMLS
- 2015-09-16 Sold (Public Records) $150,000 Public Records
- 2015-09-10 Sold (MLS) $150,000 CPARMLS
- 2015-01-23 Listed $155,000 CPARMLS
- 2002-05-31 Sold (MLS) $116,165 CPARMLS
- 2001-08-02 Listed $116,165 CPARMLS
Property tax history
+4.0%/yrLatest (2025): $1,608 · +4.5% YoY. Source: county tax records.
Cash-flow waterfall
monthlySold comps — $/sqft
last 12 mo · ≤1 miLoading sold comps…