 Duplex
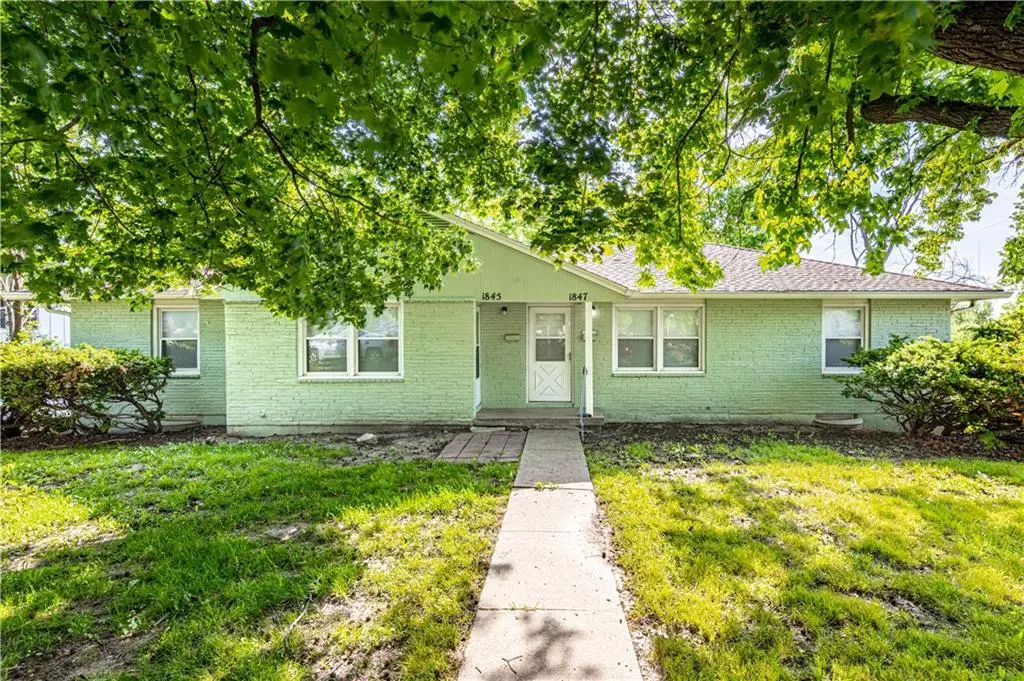
1845 Ewing Ave · Kansas City, MO
Flood risk 1/10 · Minimal
- FEMA flood zone
- X (unshaded)
- Chance of flooding over 30 yrs
- 0.0%
- Est. flood insurance / yr
- $473 – $860
Fire risk 1/10 · Minimal
- Est. fire insurance / yr
- $1,054 – $1,958
Heat risk 4/10 · Minor
- Hot days now (above 106°F)
- 7 days/yr
- Hot days in 30 yrs
- 17 days/yr
Wind risk 2/10 · Minimal
- Chance of severe wind over 30 yrs
- —
Air-quality risk 3/10 · Minor
- Unhealthy air days now
- 2 days/yr
- Unhealthy air days in 30 yrs
- 3 days/yr
Risk factors via First Street. Map © Google.
Why this score? — see what drove the C grade
The composite is a weighted blend of 9 inputs, each scored 0–100. Each bar is that input's sub-score; the figure is the points it added to the 100-point composite (weight × sub-score).
- Cash flow +25.2/30.0
- Appreciation +10.0/10.0
- DSCR +8.2/10.0
- 1% rule +5.3/10.0
- Livability +3.9/5.0
- Rent growth +2.5/5.0
- Condition / age +2.5/5.0
- Schools +1.5/10.0
- ARV discount +0.0/15.0
$204,000
🖨 Deal sheet 📄 Offer letter ✓ Due diligence
Multi-family units
County records classify this as Multi-Family (2-4 Unit). Listing-text estimate: 2 units. confirmed
Listing remarks MLS
New Price!!!All Brick Ranch duplex, 2 bedrooms, 1 bathroom each unit. Walk-out basement with washer/dryer hook up. Seller financing available to deserving buyer with large down payment. !!!!
Key facts
- 0.24 acre lot
- Built 1965
- Listed 28 days
Property features AI
Finance
- Other: Zoning: MF
- Financial info: Property type: Residential income (multi-family/duplex)
Exterior
- Parking: On-street parking
- Utilities: Public water; Public sewer; Individual water heaters; Individual heat and air
- Home design: Duplex (residential income property); Single-story
- Construction: Brick veneer exterior; Composition roof
- Exterior features: Public maintenance road access; Property sits on approximately 0.24-acre lot (estimated)
Interior
- Kitchen: Each unit includes a range/oven; Storm doors (listed under unit equipment)
- Bedrooms: Two 2-bedroom units
- Bathrooms: Each unit has 1 bathroom
- Heating & cooling: Forced air heating; Window air conditioning units
- Interior features: Basement
- Laundry & utility: Each unit has its own hot water heater; Individual heating and air systems
Neighborhood map
What this means for you Summary
Snapshot
- This is a 2 × 2-bed/1.0-bath units multifamily listed at $204k.
Deal economics
- At list price, monthly cash flow is $454 ($5k/yr) — positive. Per door: $227/mo.
- The deal already cash-flows at list — no discount required.
- Meets the 1% rule at list price ($2k rent vs $204k).
- Recommended offer: $201k (1.5% below list) — sets the bar for market timing.
- Cap rate 9.0% vs local median 3.9% in Kansas City — top-decile yield for the area; either an underpriced asset or a hidden risk that comps aren't pricing in. Stress-test before assuming the spread holds.
Location & tenants
- Location reads 78/100 on livability (#28 in MO, #2,671 nationally) — a middle-class / working-renter tenant base. Strengths: amenities A+, commute A+, cost of living A+; Watch: schools C-, crime F.
- Kansas City 33 (urban): math 12% / reading 24% proficiency, ranked #308 of 324 in MO (top 95%) — low school quality limits family demand, transient renter base, plan for 1-2y turnover; 75% free/reduced lunch — lower-income household profile, screen leases tightly.
- Market conditions: 21 active listings in the ZIP; 2 comparable units currently listed for rent nearby; 4,002 units permitted in Jackson County in 2024 (2,271 in 5+ unit buildings).
Forward outlook
- In year one you build about $22k of equity ($1k loan paydown + $20k appreciation (10.0% local appreciation)).
- Jackson County population projected at +4% by 2050 — modest demand growth; plan on rents tracking national, not racing it.
- At projected returns (10.0% appreciation + 3.0% rent growth), your $57k cash investment doubles in ~2 years — after that, you're playing with house money.
- By year 2, paydown + projected appreciation supports a ~$35k cash-out refi (75% LTV) — recoverable capital for the next deal without selling this one.
Negotiation context
- It's been on market 28 days — a 2% lower offer ($201k) is reasonable based on typical stale-listing flexibility.
- 6 sale attempts since 18y ago; this cycle's ask has dropped $16k (7%) from the opening price — seller is motivated, your offer sets the floor, not the list.
Questions for the listing agent
- Can we see the unit-by-unit rent roll, current vacancy, and any below-market leases? What's the average tenancy length?
- What capital expenditures (roof, boiler, parking lot, exteriors) have been made in the last 5 years, and what's planned in the next 2?
- Built in 1965 — when were the roof, HVAC, electrical panel, plumbing, and water heater last replaced?
- Is there a deadline driving the sale (1031 exchange, divorce, estate, relocation)? That informs how much negotiation room exists.
- Crime grade is F in this area — have there been break-ins, vandalism, or insurance claims at this property in the last 3 years? What carrier currently insures it and at what premium?
- What's the average days-on-market for RENTAL listings here right now (not sales)? A rising rental-DOM trend means longer vacancies and softer asking-rent achievability than the comps imply.
- What's the recent tenant-quality profile in this submarket — average credit score on applications, eviction rate, late-payment / NSF rate, and stable-employment percentage? A property-management company in the area should have these aggregated.
- How much new apartment / multifamily construction is in the pipeline within 1–3 miles? Heavy new supply (>2% of stock underway) typically softens rents 12–24 months out; light construction supports rent growth.
Investment metrics
- 1% rule
- 1.03% ✓
- Cap rate
- 8.96%
- Cash-on-cash
- 9.54%
- DSCR
- 1.42
- GRM
- 8.1
CMA / ARV
- ARV (median comp)
- $166,786
- List price
- $204,000
- Delta
- 22.31%
- Verdict
- OVERPRICED
- Comps
- 1 within 2.0 mi
Projected returns pro-forma
10.0% appreciation · 3.0% rent growth · sell at horizon
- IRR
- 31.2%
- Equity multiple
- 3.45×
- Total profit
- $139,919
- Equity at exit
- $183,779
- IRR
- 27.0%
- Equity multiple
- 7.81×
- Total profit
- $389,122
- Equity at exit
- $396,327
Cash invested: $57,120 (down + closing). Projections, not guarantees.
Landlord ↔ Tenant lean methodology
- Overall (STATE)
- 81 Strongly Landlord-Friendly
- State Missouri
- 81 Strongly Landlord-Friendly · R+10
- County
- — inherits STATE
- City
- — inherits STATE
ZIP-level market 64126
- Active inventory
- 21
- Price-to-rent
- 16.2×
Monthly cashflow live
- Estimated rent
- $2,103 high interval (Pro) →
- Mortgage (P&I)
- −$1,070
- Tax from tax record
- −$53 /mo · $632/yr
- Insurance
- −$85
- HOA
- −$0
- Vacancy / Maint / Mgmt
- −$442
- Net cashflow
- $454
Break-even live
2-unit breakdown (identical units grouped — click to expand)
| Units | Beds | Baths | Est. rent |
|---|---|---|---|
| 2× units | 2 | 1 | $2,104 |
| #1 | 2 | 1 | $1,052 |
| #2 | 2 | 1 | $1,052 |
| Total (2 units) | $2,103 | ||
UW: 25.0% down · 7.5% · 30yr · 1.5% tax · 5.0% vac · 8.0% maint · 8.0% mgmt
Financing live
Cash to close
- Down payment
- $51,000
- Closing costs
- $6,120
- Reserves months
- —
- Total cash needed
- —
Loan-product check · same deal, 3 products live
Conventional
25% down · 7.5% · 30yr
- Down + closing
- —
- Monthly P&I
- —
- Monthly cashflow
- —
- DSCR
- —
- Eligible?
- —
Personal DTI + credit; lowest rate.
DSCR
20% down · 8.5% · 30yr
- Down + closing
- —
- Monthly P&I
- —
- Monthly cashflow
- —
- DSCR
- —
- Eligible?
- —
No personal income docs; deal must DSCR.
Hard money
10% down · 12.0% · 12mo
- Down + closing
- —
- Monthly P&I
- —
- Monthly cashflow
- —
- DSCR
- —
- Eligible?
- —
Short-term bridge; refi at stabilization.
Rent comps 2 comps
| Address | Beds | Baths | Sqft | Rent | $/sqft | DOM | Units | Dist |
|---|---|---|---|---|---|---|---|---|
| 5852 E 20th St Unit TOP-1724 Kansas City, MO | 3.0 | 1.5 | 1482 | $1,075 | $0.73 | 2d | 1 | 0.57mi |
| 1812 Elmwood Ave Kansas City, MO | 3.0 | 1.0 | 1650 | $1,600 | $0.97 | 16d | 1 | 1.43mi |
Listing history 30 events
-
2026-06-13statusdays on market $204,000 Pending 28 DOM
-
2026-06-09days on market $204,000 Active 26 DOM
-
2026-06-08days on market $204,000 Active 25 DOM
-
2026-06-07days on market $204,000 Active 24 DOM
-
2026-06-05pricedays on market $204,000 Active 21 DOM
-
2026-06-03days on market $220,000 Active 20 DOM
-
2026-06-02days on market $220,000 Active 19 DOM
-
2026-06-01days on market $220,000 Active 18 DOM
-
2026-05-31days on market $220,000 Active 17 DOM
-
2026-05-15$220,000 Active 2021-char remark
-
2026-05-07historical $220,000 2021-char remark
-
2025-01-22historical
-
2024-07-26$220,000 Active
-
2018-05-19historical
Show marketing remark (190 chars)
New Price!!!All Brick Ranch duplex, 2 bedrooms, 1 bathroom each unit. Walk-out basement with washer/dryer hook up. Seller financing available to deserving buyer with large down payment. !!!!
-
2018-05-08price $82,500
Show marketing remark (190 chars)
New Price!!!All Brick Ranch duplex, 2 bedrooms, 1 bathroom each unit. Walk-out basement with washer/dryer hook up. Seller financing available to deserving buyer with large down payment. !!!!
-
2018-05-02price $102,499
Show marketing remark (190 chars)
New Price!!!All Brick Ranch duplex, 2 bedrooms, 1 bathroom each unit. Walk-out basement with washer/dryer hook up. Seller financing available to deserving buyer with large down payment. !!!!
-
2018-04-19$110,999 Active
Show marketing remark (190 chars)
New Price!!!All Brick Ranch duplex, 2 bedrooms, 1 bathroom each unit. Walk-out basement with washer/dryer hook up. Seller financing available to deserving buyer with large down payment. !!!!
-
2017-10-09soldstatus
-
2017-10-04soldstatus Sold
-
2017-09-19historical Contingent - Accepting Backup Offers
-
2017-09-18$70,000 Active
-
2016-06-08soldstatus Sold
-
2016-06-08soldstatus
-
2016-05-25historical Contingent - Accepting Backup Offers
-
2016-05-05$65,000 Active
-
2008-07-01soldstatus
-
2008-02-29$34,900
-
2006-11-07soldstatus
-
1999-11-30soldstatus
-
1994-07-25soldstatus
ⓘ Source: listings_history table (triggers on properties + properties_extension) + one-shot
backfill from property_details.listing_events for pre-trigger history.
Tax reassessment forecast MO · Resets to sale price
- Current annual tax
- $632 · $53/mo
- Projected year-2 tax
- $1,979 · $165/mo
- Expected delta
- +$1,347/yr (+$112/mo · 213.0%)
ⓘ Screening estimate from a state-policy table — verify with the county assessor before closing.
Climate risk First Street
- Flood 1/10 Low FEMA zone X (unshaded) · 0% chance over 30 yrs
- Wildfire 1/10 Low
- Heat 4/10 Moderate 7 d/yr ≥106°F today · 17 d/yr by 30 yrs out
- Wind 2/10 Low
- Air quality 3/10 Moderate 2 unhealthy d/yr today · 3 by 30 yrs out
Nearby sold comps map
Loading sold comps map…
Walkable amenities ~0.75 mi
Loading nearby amenities…
Taxation est. · year 1
- Rental income
- $25,236
- − Mortgage interest
- −$11,427
- − Property taxes
- −$632
- − Insurance
- −$1,020
- − Repairs & maintenance
- −$2,019
- − Management
- −$2,019
- − Depreciation
- −$5,935
- Taxable income
- $2,184
- Est. tax owed @ 24.0%
- −$524
- After-tax cash flow
- $4,922/yr
For passive investors: Depreciation is non-cash, so a rental often shows a tax loss while cash-flowing — sheltering income. Rental losses are passive: they offset passive income freely, and up to $25,000/yr can offset ordinary (W-2) income if you actively participate and your MAGI is under $100k (phasing out to $0 by $150k); unused losses carry forward. On sale, claimed depreciation is recaptured at up to 25%, and gains may owe capital-gains tax (a 1031 exchange can defer both). Figures are a year-1 estimate at your 24.0% rate — not tax advice; consult a CPA.
Schools (NCES district)
- District
- Kansas City 33
- NCES district ID
- 2916400
- Math proficiency
- 12% ▼ -8.00%
- Reading proficiency
- 24% ▬ 0.00%
- Median HH income
- $35,227
- Composite
- 14.8/100
- National rank
- #9387
- State rank
- #308 of 324 in MO
Livability — Kansas City
- Score
- 78/100
- State rank
- #28
- US rank
- #2671
Category grades
Schools grade is shown separately in the Schools card above.
Census & demographics
- Census place
- Kansas City, MO
- City population
- 439,467
- Population (ZIP)
- 6,433
Population outlook (Jackson County) Hauer SSP2
- Today (2025)
- 719,589 people
- By 2030
- 731,456 · +1.6%
- By 2040
- 746,689 · +3.8%
- By 2050
- 749,289 · +4.1%
- By 2075
- 736,227 · +2.3%
- By 2100
- 668,210 · -7.1%
Race, ethnicity, and origin ACS 2023
- Neighborhood character
- Diverse neighborhood (Simpson 0.62)
- Race & ethnicity
- Hispanic / Latino 57% Two or more races 29% White 19% Black 14% Asian 3% Native American 2%
- Hispanic origin (detail)
- Mexican 38% Cuban 4%
- Common ancestry
- Slovak 2% Iranian 1% Lithuanian 1%
- Foreign-born
- 36% · Canada
- Languages at home
- 44% English-only · Spanish 50% Vietnamese 1%
Political lean MEDSL · Jackson
- 2024 margin
- D (+19.3) · D 58.9% · R 39.5% · Other 1.6%
- 2008→2024 swing
- -6.1pp toward R · 2008: 25.4pp · 2024: 19.3pp
- All cycles
- 2024: D+19.3 2020: D+22.0 2016: D+16.6 2012: D+19.0 2008: D+25.4
Not yet ingested
- Civics
- —
Market trends
- HPI YoY
- ▲ 100.10%
- Current HPI
- 369.8782
- Rent YoY
- —
- Metro
- —
- State GDP YoY
- ▲ 1.84%
- F500 in state
- 20
Industry mix (Fortune 500 HQ in MO)
| Industry | F500 HQs | Revenue |
|---|---|---|
| Healthcare | 1 | $163B |
|
||
| Insurance | 1 | $21B |
|
||
| Industrial Technology | 1 | $17B |
|
||
| Retail | 1 | $16B |
|
||
| Industrial Distribution | 1 | $10B |
|
||
| Utilities | 1 | $9B |
|
||
Price history
+484.5% since first listed23 events — show timeline
- 2026-06-11 Pending — Heartland MLS as Distributed by MLS Grid
- 2026-06-05 Price Changed $204,000 Heartland MLS as Distributed by MLS Grid
- 2026-05-15 Listed $220,000 Heartland MLS as Distributed by MLS Grid
- 2026-05-07 Coming Soon $220,000 Heartland MLS as Distributed by MLS Grid
- 2025-01-22 Listing Removed — Heartland MLS as Distributed by MLS Grid
- 2024-07-26 Listed $220,000 Heartland MLS as Distributed by MLS Grid
- 2018-05-19 Listing Removed — Heartland MLS as Distributed by MLS Grid
- 2018-05-08 Price Changed $82,500 Heartland MLS as Distributed by MLS Grid
- 2018-05-02 Price Changed $102,499 Heartland MLS as Distributed by MLS Grid
- 2018-04-19 Listed $110,999 Heartland MLS as Distributed by MLS Grid
- 2017-10-09 Sold (Public Records) — Public Records
- 2017-10-04 Sold (MLS) — Heartland MLS as Distributed by MLS Grid
- 2017-09-19 Contingent — Heartland MLS as Distributed by MLS Grid
- 2017-09-18 Listed $70,000 Heartland MLS as Distributed by MLS Grid
- 2016-06-08 Sold (Public Records) — Public Records
- 2016-06-08 Sold (MLS) — Heartland MLS as Distributed by MLS Grid
- 2016-05-25 Contingent — Heartland MLS as Distributed by MLS Grid
- 2016-05-05 Listed $65,000 Heartland MLS as Distributed by MLS Grid
- 2008-07-01 Sold (MLS) — Heartland MLS as Distributed by MLS Grid
- 2008-02-29 Listed $34,900 Heartland MLS as Distributed by MLS Grid
- 2006-11-07 Sold (Public Records) — Public Records
- 1999-11-30 Sold (Public Records) — Public Records
- 1994-07-25 Sold (Public Records) — Public Records
Property tax history
+4.3%/yrLatest (2025): $632 · -36.3% YoY. Source: county tax records.
Cash-flow waterfall
monthlySold comps — $/sqft
last 12 mo · ≤1 miLoading sold comps…