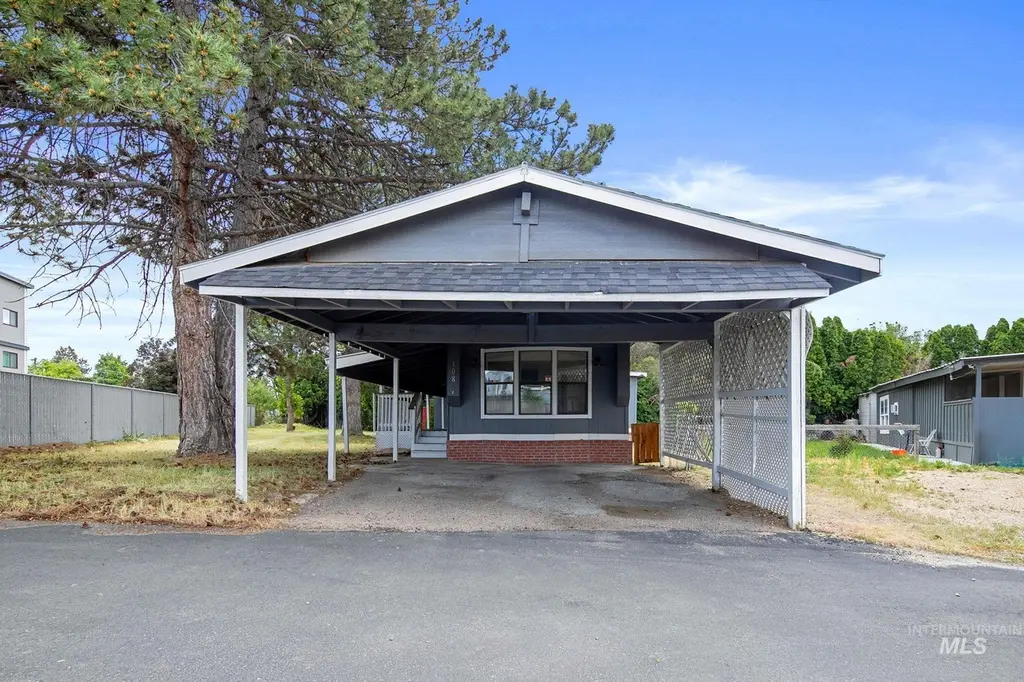
1410 W Flamingo Avenue #108 #108 · Nampa, ID
Flood risk 1/10 · Minimal
- FEMA flood zone
- X (unshaded)
- Chance of flooding over 30 yrs
- 0.0%
- Est. flood insurance / yr
- $507 – $1,088
Fire risk 1/10 · Minimal
- Est. fire insurance / yr
- $584 – $1,086
Heat risk 4/10 · Minor
- Hot days now (above 98°F)
- 7 days/yr
- Hot days in 30 yrs
- 18 days/yr
Wind risk 1/10 · Minimal
- Chance of severe wind over 30 yrs
- —
Air-quality risk 8/10 · Major
- Unhealthy air days now
- 12 days/yr
- Unhealthy air days in 30 yrs
- 19 days/yr
Risk factors via First Street. Map © Google.
Why this score? — see what drove the B+ grade
The composite is a weighted blend of 9 inputs, each scored 0–100. Each bar is that input's sub-score; the figure is the points it added to the 100-point composite (weight × sub-score).
- Cash flow +30.0/30.0
- ARV discount +15.0/15.0
- DSCR +10.0/10.0
- 1% rule +8.6/10.0
- Rent growth +4.1/5.0
- Schools +3.8/10.0
- Livability +3.6/5.0
- Condition / age +2.5/5.0
- Appreciation +0.0/10.0
$114,000
🖨 Deal sheet 📄 Offer letter ✓ Due diligence
Listing remarks
This 3 bedroom, 2 bath manufactured home offers a practical layout and a larger lot within a well-kept mobile home park—providing both space and potential. Recently remodeled for a clean new home feel. Large main living area and spacious rooms. The larger lot offers added outdoor space for relaxing, gardening, or future enhancements—set within a community that is cared for and conveniently located. Seller prepared to help buyer with financing, please ask about seller carry loan or for recommended lenders! Seller Promo! 3 Months prepaid lot rent - paid by seller with approved offer!
Key facts
- Recently remodeled
- Main living area
- Larger lot
Tags
Property features AI
Finance
- Other: Property currently in a mobile home park (rented lot)
- HOA & community: Located in Karcher Estates mobile home park
Exterior
- Parking: Carport for 2 vehicles; Finished driveway; 2 covered parking spaces
- Utilities: City water service; Sewer connected
- Home design: Mobile/manufactured home on a rented lot
- Construction: Built in 1989; Wood siding; Composition roof
- Exterior features: Partial metal and wire fencing; Storage shed; Located on a cul-de-sac; Irrigation system with manual sprinklers; Winter access
Interior
- Kitchen: Dishwasher; Microwave; Freestanding oven/range; Pantry
- Bedrooms: 3 bedrooms — all on the main level
- Bathrooms: 2 bathrooms
- Heating & cooling: Forced-air heating (natural gas); Central air conditioning
- Interior features: Primary bathroom with double vanity; Bath in master bedroom; Den/office; Pantry; All main living areas located on the main level
- Laundry & utility: Gas water heater
Neighborhood map
What this means for you Summary
Snapshot
- This is a 3-bed/1.5-bath manufactured listed at $114k.
Deal economics
- At list price, monthly cash flow is $495 ($6k/yr) — positive.
- The deal already cash-flows at list — no discount required.
- Meets the 1% rule at list price ($2k rent vs $114k).
- Recommended offer: $111k (3.0% below list) — sets the bar for market timing.
- Cap rate 11.5% vs local median 3.2% in Nampa — top-decile yield for the area; either an underpriced asset or a hidden risk that comps aren't pricing in. Stress-test before assuming the spread holds.
Location & tenants
- Location reads 72/100 on livability (#47 in ID) — a middle-class / working-renter tenant base. Strengths: housing A+, health & safety A+, cost of living A-; Watch: employment C-, amenities F, commute F.
- Vallivue School District (rural): math 34% / reading 56% proficiency, ranked #48 of 92 in ID (top 52%) — families likely to look elsewhere, expect single-tenant / working-renter base with shorter leases.
- Zoned schools: East Canyon Elementary School (math 34% / reading 44%, grade F, #247 of 357 statewide, top 70%, 692 students, 33% FRL); Ridgevue High School (math 27% / reading 67%, grade D-, #55 of 169 statewide, top 34%, 1,578 students, 31% FRL) — zoned schools average 32% FRL vs 52% district-wide (20 pts lower); this property's tenant base skews higher-income than the district average.
- Market conditions: Rents rising fast (+6.4%/yr); 319 active listings in the ZIP; 40 comparable units currently listed for rent nearby; rentals at typical pace (median 15d on market — plan ~3-4 weeks tenant-placement turnaround); 3,620 units permitted in Canyon County in 2024 (196 in 5+ unit buildings).
Forward outlook
- Local home prices are declining (-3.0%/yr); year-one equity from $788 of loan paydown is wiped out by about $3k of value loss. Plan a longer hold.
- Canyon County population projected at +41% by 2050 — long-run rental-demand tailwind backs the buy-and-hold thesis.
- At projected returns (-3.0% appreciation + 6.4% rent growth), your $32k cash investment doubles in ~6 years — after that, you're playing with house money.
Negotiation context
- It's been on market 31 days — a 3% lower offer ($111k) is reasonable based on typical stale-listing flexibility.
- 8 sale attempts since 23y ago; this cycle's ask has dropped $6k (5%) from the opening price — seller is motivated, your offer sets the floor, not the list.
Questions for the listing agent
- It's been on market 31 days. Have you received any prior offers? Is the seller open to a 3% concession, seller financing, or rate buy-down credit?
- Is there a deadline driving the sale (1031 exchange, divorce, estate, relocation)? That informs how much negotiation room exists.
- Schools are D-rated, which usually means shorter tenancies and higher turnover. Who's the typical renter profile here, and what's been the actual vacancy rate?
- What's the average days-on-market for RENTAL listings here right now (not sales)? A rising rental-DOM trend means longer vacancies and softer asking-rent achievability than the comps imply.
- What's the recent tenant-quality profile in this submarket — average credit score on applications, eviction rate, late-payment / NSF rate, and stable-employment percentage? A property-management company in the area should have these aggregated.
- How much new for-sale + rental construction is in the pipeline within 1–3 miles? Heavy new supply typically softens prices + rents 12–24 months out; constrained supply supports both.
Investment metrics
- 1% rule
- 1.36% ✓
- Cap rate
- 11.50%
- Cash-on-cash
- 18.61%
- DSCR
- 1.83
- GRM
- 6.1
CMA / ARV
- ARV (on-the-fly)
- $166,116
- Comps found
- 12
Show comp detail 12 sales within ~0.75 mi
| Address | Dist | Beds/Ba | Sqft | Sold | Price | $/sf | Match |
|---|---|---|---|---|---|---|---|
| 1410 W Flamingo Ave #42 #42 | 0.00mi | 3/2.0 | 1,248 (-5%) | 11mo | $99,900 | $80 | 81 |
| 1410 Flamingo Ave #49 | 0.00mi | 3/2.0 | 1,440 (+10%) | 2mo | $79,900 | $55 | 80 |
| 1907 W Flamingo Ave #79 | 0.38mi | 3/2.0 | 1,348 (+3%) | 2mo | $175,000 | $130 | 74 |
| 1907 W Flamingo Ave #74 | 0.38mi | 3/2.0 | 1,364 (+4%) | 1mo | $179,900 | $132 | 73 |
| 1907 Flamingo #109 | 0.38mi | 3/2.0 | 1,368 (+5%) | 3mo | $179,900 | $132 | 71 |
| 1410 Flamingo #73 | 0.00mi | 2/1.0 (-1) | 1,198 (-8%) | 11mo | $75,000 | $63 | 70 |
| 1907 W Flamingo Ave #169 | 0.38mi | 3/2.0 | 1,348 (+3%) | 8mo | $174,900 | $130 | 69 |
| 1907 W Flamingo #158 | 0.38mi | 3/2.0 | 1,216 (-7%) | 2mo | $285,000 | $234 | 67 |
| 1715 Flamingo Unit 61A | 0.23mi | 2/2.0 (-1) | 1,152 (-12%) | 1mo | $85,000 | $74 | 62 |
| 1907 W Flamingo Ave Unit 125 Unit 125 | 0.38mi | 3/2.0 | 1,404 (+7%) | 8mo | $160,000 | $114 | 62 |
| 1907 W Flamingo Ave #152 | 0.38mi | 2/2.0 (-1) | 1,452 (+11%) | 3mo | $160,000 | $110 | 55 |
| 1907 W Flamingo Ave Unit 86 #86 | 0.38mi | 2/2.0 (-1) | 1,486 (+14%) | 11mo | $189,086 | $127 | 44 |
Match score weights: distance 35% · size 25% · config 20% · recency 20%. Top-matched comps best support the ARV.
Projected returns pro-forma
-3.0% appreciation · 6.41% rent growth · sell at horizon
- IRR
- 14.0%
- Equity multiple
- 1.58×
- Total profit
- $18,543
- Equity at exit
- $16,998
- IRR
- 25.1%
- Equity multiple
- 3.53×
- Total profit
- $80,899
- Equity at exit
- $9,857
Cash invested: $31,920 (down + closing). Projections, not guarantees.
Landlord ↔ Tenant lean methodology
- Overall (STATE)
- 91 Strongly Landlord-Friendly
- State Idaho
- 91 Strongly Landlord-Friendly · R+18
- County
- — inherits STATE
- City
- — inherits STATE
ZIP-level market 83651
- Home prices YoY
- -28.3%
- Rents YoY
- 6.4%
- Active inventory
- 319
- Price-to-rent
- 6.1×
Monthly cashflow live
- Estimated rent
- $1,550 high interval (Pro) →
- Mortgage (P&I)
- −$598
- Tax from tax record
- −$84 /mo · $1,005/yr
- Insurance
- −$48
- HOA
- −$0
- Vacancy / Maint / Mgmt
- −$325
- Net cashflow
- $495
Break-even live
UW: 25.0% down · 7.5% · 30yr · 1.5% tax · 5.0% vac · 8.0% maint · 8.0% mgmt
Financing live
Cash to close
- Down payment
- $28,500
- Closing costs
- $3,420
- Reserves months
- —
- Total cash needed
- —
Loan-product check · same deal, 3 products live
Conventional
25% down · 7.5% · 30yr
- Down + closing
- —
- Monthly P&I
- —
- Monthly cashflow
- —
- DSCR
- —
- Eligible?
- —
Personal DTI + credit; lowest rate.
DSCR
20% down · 8.5% · 30yr
- Down + closing
- —
- Monthly P&I
- —
- Monthly cashflow
- —
- DSCR
- —
- Eligible?
- —
No personal income docs; deal must DSCR.
Hard money
10% down · 12.0% · 12mo
- Down + closing
- —
- Monthly P&I
- —
- Monthly cashflow
- —
- DSCR
- —
- Eligible?
- —
Short-term bridge; refi at stabilization.
Rent comps 40 comps
| Address | Beds | Baths | Sqft | Rent | $/sqft | DOM | Units | Dist |
|---|---|---|---|---|---|---|---|---|
| 1825 W Bella Ln Nampa, ID | 2.0 | 2.0 | 880 | $1,395 | $1.59 | 23d | 1 | 0.14mi |
| 1805 W Bella Ln Nampa, ID | 2.0 | 2.0 | 965 | $1,395 | $1.45 | 21d | 1 | 0.15mi |
| 1860 W Bella Ln Nampa, ID | 2.0 | 2.0 | 880 | $1,395 | $1.59 | 14d | 1 | 0.16mi |
| 1865 W Bella Ln Nampa, ID | 2.0 | 2.0 | 880 | $1,395 | $1.59 | 23d | 1 | 0.18mi |
| 1920 W Bella Ln Nampa, ID | 2.0 | 2.0 | 880 | $1,395 | $1.59 | 23d | 1 | 0.20mi |
| 1435 W Bonneville Cir Unit 1470-103 Nampa, ID | 2.0 | 1.5 | 970 | $1,350 | $1.39 | 3d | 1 | 0.21mi |
| 1925 W Bella Ln Nampa, ID | 2.0 | 2.0 | 965 | $1,395 | $1.45 | 23d | 1 | 0.21mi |
| 1490 W Bonneville Cir Nampa, ID | 2.0 | 1.5 | 970 | $1,350 | $1.39 | 23d | 1 | 0.24mi |
| 1275 Caldwell Blvd Nampa, ID | 1.0–3.0 | 1.0–2.0 | 921 | $1,900 | $2.06 | 23d | 1 | 0.26mi |
| 2084 W Bella Ln Unit 1460910P Nampa, ID | 3.0 | 2.0 | 1237 | $3,905 | $3.16 | 23d | 1 | 0.26mi |
| 1013 W Willow Ave Nampa, ID | 3.0 | 1.0 | 900 | $1,500 | $1.67 | 14d | 1 | 0.45mi |
| 1215 N Benewah St Nampa, ID | 3.0 | 2.0 | 1219 | $1,250 | $1.03 | 14d | 1 | 0.50mi |
| 11179 W Brassy Cove Loop Nampa, ID | 2.0 | 2.0 | 900 | $1,395 | $1.55 | 3d | 1 | 0.63mi |
| 11199 W Brassy Cove Loop Nampa, ID | 2.0 | 2.0 | 900 | $1,395 | $1.55 | 23d | 1 | 0.66mi |
| 11188 W Brassy Cove Loop Nampa, ID | 2.0 | 2.0 | 900 | $1,395 | $1.55 | 23d | 1 | 0.66mi |
| 15690 N Knightgate Ln Nampa, ID | 2.0–3.0 | 2.0–3.0 | 1239 | $1,825 | $1.47 | 3d | 3 | 0.67mi |
| 11010 W Brassy Cove Loop Nampa, ID | 2.0 | 2.0 | 900 | $1,395 | $1.55 | 23d | 1 | 0.67mi |
| 11004 W Brassy Cove Loop Nampa, ID | 2.0 | 2.0 | 900 | $1,395 | $1.55 | 21d | 1 | 0.68mi |
| 11160 W Brassy Cove Loop Nampa, ID | 2.0 | 2.0 | 900 | $1,395 | $1.55 | 23d | 1 | 0.68mi |
| 11159 W Brassy Cove Loop Nampa, ID | 2.0 | 2.0 | 900 | $1,395 | $1.55 | 23d | 1 | 0.70mi |
| 11028 W Brassy Cove Loop Nampa, ID | 2.0 | 2.0 | 900 | $1,395 | $1.55 | 23d | 1 | 0.71mi |
| 11130 W Ashburn Ln Nampa, ID | 2.0 | 2.0 | 1106 | $1,650 | $1.49 | 14d | 2 | 0.71mi |
| 11034 W Brassy Cove Loop Nampa, ID | 2.0 | 2.0 | 900 | $1,395 | $1.55 | 19d | 1 | 0.72mi |
| 15550 N Kodee Way Nampa, ID | 2.0 | 2.0 | 900 | $1,395 | $1.55 | 14d | 1 | 0.72mi |
| 11039 W Brassy Cove Loop Nampa, ID | 2.0 | 2.0 | 900 | $1,395 | $1.55 | 10d | 1 | 0.73mi |
| 16060 N Merchant Way Nampa, ID | 2.0–3.0 | 2.0 | 1115 | $1,695 | $1.52 | 3d | 1 | 0.75mi |
| 11144 W Brassy Cove Loop Nampa, ID | 2.0 | 2.0 | 900 | $1,395 | $1.55 | 3d | 1 | 0.77mi |
| 1820 W Camelot Dr Nampa, ID | 3.0 | 2.0 | 1400 | $2,195 | $1.57 | 3d | 1 | 0.77mi |
| 11139 W Brassy Cove Loop Nampa, ID | 2.0 | 2.0 | 945 | $1,395 | $1.48 | 14d | 1 | 0.78mi |
| 11139 W Brassy Cove Loop Unit 201 Nampa, ID | 2.0 | 2.0 | 900 | $1,395 | $1.55 | 21d | 1 | 0.78mi |
| 11215 W Ashburn Ln Nampa, ID | 2.0–3.0 | 2.0–3.0 | 1176 | $1,825 | $1.55 | 3d | 2 | 0.80mi |
| 11214 W Ashburn Ln Nampa, ID | 3.0 | 3.0 | 1301 | $1,825 | $1.40 | 3d | 2 | 0.80mi |
| 9848 W Sand Hill Dr Nampa, ID | 1.0–3.0 | 1.0–2.0 | 1008 | $1,650 | $1.64 | 23d | 1 | 0.81mi |
| 11132 W Brassy Cove Loop Nampa, ID | 2.0 | 2.0 | 900 | $1,395 | $1.55 | 3d | 1 | 0.81mi |
| 11082 W Brassy Cove Loop Nampa, ID | 2.0 | 2.0 | 900 | $1,395 | $1.55 | 10d | 1 | 0.81mi |
| 11106 W Brassy Cove Loop Nampa, ID | 2.0 | 2.0 | 900 | $1,395 | $1.55 | 3d | 1 | 0.82mi |
| 11103 W Brassy Cove Loop Nampa, ID | 2.0 | 2.0 | 900 | $1,395 | $1.55 | 3d | 1 | 0.85mi |
| 450 W Orchard Ave Nampa, ID | 1.0–3.0 | 1.0–2.0 | 1129 | $1,699 | $1.50 | 3d | 11 | 0.92mi |
| 151 N Midland Blvd Unit 101 Nampa, ID | 2.0 | 2.0 | 930 | $1,325 | $1.42 | 14d | 1 | 1.03mi |
| 151 N Midland Blvd Unit 103 Nampa, ID | 2.0 | 2.0 | 930 | $1,325 | $1.42 | 23d | 1 | 1.03mi |
Listing history 39 events
-
2026-06-18days on market $114,000 Active 31 DOM
-
2026-06-17price $114,000 Active 30 DOM
-
2026-06-17days on market $117,000 Active 30 DOM
-
2026-06-16days on market $117,000 Active 29 DOM
-
2026-06-15days on market $117,000 Active 28 DOM
-
2026-06-13days on market $117,000 Active 26 DOM
-
2026-06-13days on market $117,000 Active 25 DOM
-
2026-06-10days on market $117,000 Active 23 DOM
-
2026-06-09days on market $117,000 Active 22 DOM
-
2026-06-08days on market $117,000 Active 21 DOM
-
2026-06-07remarks 589-char remark
-
2026-06-07pricedays on market $117,000 Active 20 DOM
-
2026-06-03days on market $120,000 Active 16 DOM
-
2026-06-03days on market $120,000 Active 15 DOM
-
2026-06-01days on market $120,000 Active 14 DOM
-
2026-05-31days on market $120,000 Active 13 DOM
-
2026-05-18$120,000 Active
-
2026-05-01historical
-
2026-01-02price $122,900
-
2025-12-03$129,900 Active
-
2025-11-01historical
-
2025-08-21price $129,900
-
2025-07-10price $133,000
-
2025-04-25$134,900 Active
-
2025-03-18historical
-
2025-02-17price $139,999
-
2025-02-10$150,000 Active
-
2023-08-01soldstatus Sold
-
2023-07-22status Pending
-
2023-07-16price $135,900
-
2023-07-12price $145,000
-
2023-06-23$150,000 Active
-
2023-05-23soldstatus Sold
-
2023-05-05status Pending
-
2023-05-04$119,900 Active
-
2023-04-29historical
-
2023-04-21$119,900 Active
-
2003-04-14soldstatus
-
2003-02-24$22,900
ⓘ Source: listings_history table (triggers on properties + properties_extension) + one-shot
backfill from property_details.listing_events for pre-trigger history.
Tax reassessment forecast ID · Resets to sale price
- Current annual tax
- $1,005 · $84/mo
- Projected year-2 tax
- $1,005 · $84/mo
- Expected delta
- $0/yr ($0/mo · 0.0%)
ⓘ Screening estimate from a state-policy table — verify with the county assessor before closing.
Climate risk First Street
- Flood 1/10 Low FEMA zone X (unshaded) · 0% chance over 30 yrs
- Wildfire 1/10 Low
- Heat 4/10 Moderate 7 d/yr ≥98°F today · 18 d/yr by 30 yrs out
- Wind 1/10 Low
- Air quality 8/10 Severe 12 unhealthy d/yr today · 19 by 30 yrs out
Nearby sold comps map
Loading sold comps map…
Walkable amenities ~0.75 mi
Loading nearby amenities…
Taxation est. · year 1
- Rental income
- $18,595
- − Mortgage interest
- −$6,386
- − Property taxes
- −$1,005
- − Insurance
- −$570
- − Repairs & maintenance
- −$1,488
- − Management
- −$1,488
- − Depreciation
- −$3,316
- Taxable income
- $4,342
- Est. tax owed @ 24.0%
- −$1,042
- After-tax cash flow
- $4,899/yr
For passive investors: Depreciation is non-cash, so a rental often shows a tax loss while cash-flowing — sheltering income. Rental losses are passive: they offset passive income freely, and up to $25,000/yr can offset ordinary (W-2) income if you actively participate and your MAGI is under $100k (phasing out to $0 by $150k); unused losses carry forward. On sale, claimed depreciation is recaptured at up to 25%, and gains may owe capital-gains tax (a 1031 exchange can defer both). Figures are a year-1 estimate at your 24.0% rate — not tax advice; consult a CPA.
Schools (NCES district)
- District
- Vallivue School District
- NCES district ID
- 1600600
- Math proficiency
- 34% ▼ -9.00%
- Reading proficiency
- 56% ▼ -1.00%
- Median HH income
- $47,377
- Composite
- 38.3/100
- National rank
- #4229
- State rank
- #48 of 92 in ID
Livability — Nampa
- Score
- 72/100
- State rank
- #47
- US rank
- #6250
Category grades
Schools grade is shown separately in the Schools card above.
Census & demographics
- Census place
- Nampa, ID
- County
- Canyon County · 235,358 people
- City population
- 142,249
- Metro
- Boise City, ID
- Population (ZIP)
- 38,121
- Household income
- $69,914
- Rent vs Own
- Severe rent burden
- 723.0
Population outlook (Canyon County) Hauer SSP2
- Today (2025)
- 248,853 people
- By 2030
- 269,596 · +8.3%
- By 2040
- 311,081 · +25.0%
- By 2050
- 350,809 · +41.0%
- By 2075
- 441,884 · +77.6%
- By 2100
- 505,641 · +103.2%
Race, ethnicity, and origin ACS 2023
- Neighborhood character
- Predominantly White (70%)
- Race & ethnicity
- White 70% Hispanic / Latino 24% Two or more races 11%
- Hispanic origin (detail)
- Mexican 20%
- Common ancestry
- Portuguese 3% Slovak 2% Lithuanian 2%
- Foreign-born
- 8% · Canada, Vietnam
- Languages at home
- 81% English-only · Spanish 16% German/W. Germanic 1% Russian/Polish/Slavic 1%
Political lean MEDSL · Canyon
- 2024 margin
- Solid R (+46.6) · D 25.4% · R 72.0% · Other 2.5%
- 2008→2024 swing
- -11.4pp toward R · 2008: -35.2pp · 2024: -46.6pp
- All cycles
- 2024: R+46.6 2020: R+39.7 2016: R+41.8 2012: R+37.1 2008: R+35.2
Not yet ingested
- Civics
- —
Market trends
- HPI YoY
- ▼ -132.40%
- Current HPI
- 335.6717
- Rent YoY
- ▲ 6.41%
- Metro
- Boise City, ID
- State GDP YoY
- ▲ 4.51%
- F500 in state
- 6
Industry mix (Fortune 500 HQ in ID)
| Industry | F500 HQs | Revenue |
|---|---|---|
| Retail | 1 | $79B |
|
||
| Technology | 1 | $25B |
|
||
| Food / Agriculture | 1 | $6B |
|
||
Price history
+424.0% since first listed23 events — show timeline
- 2026-05-18 Listed $120,000 IMLS
- 2026-05-01 Listing Removed — IMLS
- 2026-01-02 Price Changed $122,900 IMLS
- 2025-12-03 Listed $129,900 IMLS
- 2025-11-01 Listing Removed — IMLS
- 2025-08-21 Price Changed $129,900 IMLS
- 2025-07-10 Price Changed $133,000 IMLS
- 2025-04-25 Listed $134,900 IMLS
- 2025-03-18 Listing Removed — IMLS
- 2025-02-17 Price Changed $139,999 IMLS
- 2025-02-10 Listed $150,000 IMLS
- 2023-08-01 Sold (MLS) — IMLS
- 2023-07-22 Pending — IMLS
- 2023-07-16 Price Changed $135,900 IMLS
- 2023-07-12 Price Changed $145,000 IMLS
- 2023-06-23 Listed $150,000 IMLS
- 2023-05-23 Sold (MLS) — IMLS
- 2023-05-05 Pending — IMLS
- 2023-05-04 Listed $119,900 IMLS
- 2023-04-29 Listing Removed — IMLS
- 2023-04-21 Listed $119,900 IMLS
- 2003-04-14 Sold (MLS) — IMLS
- 2003-02-24 Listed $22,900 IMLS
Property tax history
+14.7%/yrLatest (2025): $1,005 · +10.9% YoY. Source: county tax records.
Cash-flow waterfall
monthlySold comps — $/sqft
last 12 mo · ≤1 miLoading sold comps…