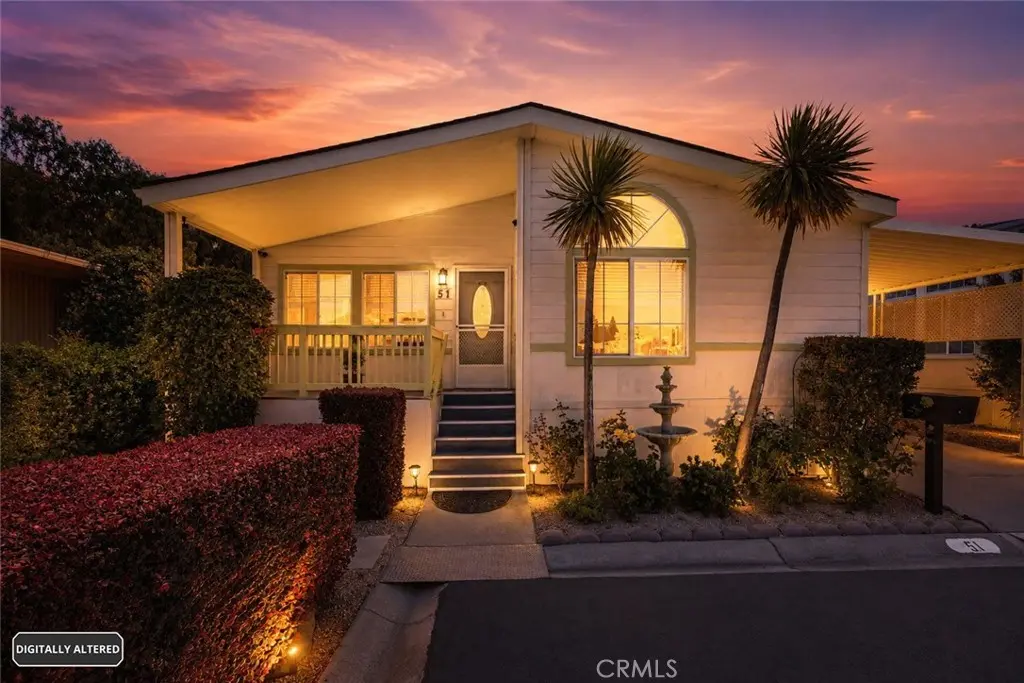
433 Sylvan Ave #51 · Mountain View, CA
Flood risk 1/10 · Minimal
- FEMA flood zone
- X
- Chance of flooding over 30 yrs
- 0.0%
- Est. flood insurance / yr
- $507 – $1,088
Fire risk 1/10 · Minimal
- Est. fire insurance / yr
- $659 – $1,223
Heat risk 4/10 · Minor
- Hot days now (above 92°F)
- 7 days/yr
- Hot days in 30 yrs
- 14 days/yr
Wind risk 1/10 · Minimal
- Chance of severe wind over 30 yrs
- —
Air-quality risk 7/10 · Major
- Unhealthy air days now
- 13 days/yr
- Unhealthy air days in 30 yrs
- 13 days/yr
Risk factors via First Street. Map © Google.
Why this score? — see what drove the B grade
The composite is a weighted blend of 9 inputs, each scored 0–100. Each bar is that input's sub-score; the figure is the points it added to the 100-point composite (weight × sub-score).
- Cash flow +26.1/30.0
- DSCR +8.8/10.0
- Schools +8.0/10.0
- ARV discount +7.1/15.0
- 1% rule +7.0/10.0
- Appreciation +4.5/10.0
- Livability +4.2/5.0
- Rent growth +3.4/5.0
- Condition / age +2.5/5.0
$419,000
🖨 Deal sheet (PDF) 📄 Offer letter ✓ Due diligence
Listing remarks MLS
Spacious home located in a beautiful Senior park. Gorgeous laminate flooring. The kitchen has room for a dining table, has a large center island, granite counters, tile backsplash lots of cabinets. Includes all stainless appliances. The master bedroom offers a large private bathroom with a step-in shower Central heating & dual-pane windows help with energy savings Laundry room includes the washer & dryer. Beautiful landscaping with a comfortable front yard to sit and relax. 2002 Silvercrest S/N 17309401A/B
Key facts
- Community pool
- Built 2002
- Listed 8 days
Property features AI
Finance
- Other: Located in Sunset Estates mobile home park; Directions: See park map; cross street Moorpark Way
- HOA & community: Senior community; Pets permitted; Pool; Barbecue area; Clubhouse; Billiard room; Suburban community setting; Manager approval required
Exterior
- Parking: Covered parking; Carport; Guest parking available; Located in Sunset Estates (park)
- Utilities: Public sewer; District/public water
- Home design: Single-story; Mobile home present (31' x 55'); Entry level 1
- Construction: Mobile home remains on site; Year built: see remarks
- Exterior features: Patio; Community pool; Patio/porch details: see remarks; Shop and shed on property; Corner lot
Interior
- Kitchen: Garbage disposal; Microwave; Refrigerator; Dishwasher
- Bathrooms: Two full bathrooms; Double sinks in master bathroom
- Heating & cooling: Central cooling; Central furnace heating
- Interior features: One-level home; Front entry
- Laundry & utility: Washer included; Dryer included; Laundry on site
Neighborhood map
What this means for you Summary
Snapshot
- This is a 3-bed/2.0-bath manufactured listed at $419k.
Deal economics
- At list price, monthly cash flow is $1k ($13k/yr) — positive.
- The deal already cash-flows at list — no discount required.
- Meets the 1% rule at list price ($5k rent vs $419k).
- Cap rate 9.3% vs local median 1.4% in Mountain View — top-decile yield for the area; either an underpriced asset or a hidden risk that comps aren't pricing in. Stress-test before assuming the spread holds.
Location & tenants
- Location reads 84/100 on livability (#14 in CA, #671 nationally) — a professional / high-income tenant draw. Strengths: schools A+, amenities A+, commute A+; Watch: crime D+, cost of living F.
- Mountain View-Los Altos Union High (urban): math 77% / reading 86% proficiency, ranked #11 of 517 in CA (top 2%) — strong family-tenant draw, lease renewals of 3-5y typical.
- Market conditions: Rents rising (+3.4%/yr); 23 active listings in the ZIP; 25 comparable units currently listed for rent nearby; rentals leasing fast (median 3d on market — plan ~1-2 weeks tenant-placement turnaround); high-income renter base; 3,838 units permitted in Santa Clara County in 2024 (1,886 in 5+ unit buildings).
- This rent runs 34% of the median local income ($179k/yr) — at the standard rent-burdened threshold; future hikes will face affordability resistance.
Forward outlook
- Local home prices are declining (-1.1%/yr); year-one equity from $3k of loan paydown is wiped out by about $4k of value loss. Plan a longer hold.
- Santa Clara County population projected at +24% by 2050 — long-run rental-demand tailwind backs the buy-and-hold thesis.
- At projected returns (-1.1% appreciation + 3.4% rent growth), your $117k cash investment doubles in ~8 years — after that, you're playing with house money.
Negotiation context
- Only 8 days on market — expect competitive offers; lowballing is unlikely to land.
- 6 sale attempts since 15y ago; this cycle's ask is 25% above the opening price — seller raised mid-cycle; expect resistance to lowballs.
- Current owner paid $322k; 30% above their basis — modest negotiation headroom, anchor on the comps not their cost.
Questions for the listing agent
- Is there a deadline driving the sale (1031 exchange, divorce, estate, relocation)? That informs how much negotiation room exists.
- Schools are A-rated — typically a magnet for longer-tenancy family renters. What's the average tenant stay here, and is there a school-zone premium baked into asking?
- Crime grade is D in this area — have there been break-ins, vandalism, or insurance claims at this property in the last 3 years? What carrier currently insures it and at what premium?
- What's the average days-on-market for RENTAL listings here right now (not sales)? A rising rental-DOM trend means longer vacancies and softer asking-rent achievability than the comps imply.
- What's the recent tenant-quality profile in this submarket — average credit score on applications, eviction rate, late-payment / NSF rate, and stable-employment percentage? A property-management company in the area should have these aggregated.
- How much new for-sale + rental construction is in the pipeline within 1–3 miles? Heavy new supply typically softens prices + rents 12–24 months out; constrained supply supports both.
Investment metrics
- 1% rule
- 1.20% ✓
- Cap rate
- 9.33%
- Cash-on-cash
- 10.85%
- DSCR
- 1.48
- GRM
- 7.0
CMA / ARV
- ARV (on-the-fly)
- $415,530
- Comps found
- 5
Show comp detail 5 sales within ~0.75 mi
| Address | Dist | Beds/Ba | Sqft | Sold | Price | $/sf | Match |
|---|---|---|---|---|---|---|---|
| 433 Sylvan Ave #2 | 0.08mi | 3/2.0 | 1,710 (0%) | 13mo | $439,000 | $257 | 85 |
| 325 Sylvan Ave #47 | 0.12mi | 3/2.0 | 1,663 (-3%) | 8mo | $389,000 | $234 | 84 |
| 325 Sylvan Ave #117 | 0.15mi | 3/2.0 | 1,485 (-13%) | 4mo | $379,000 | $255 | 68 |
| 325 Sylvan Ave #106 | 0.14mi | 3/2.0 | 1,512 (-12%) | 11mo | $368,000 | $243 | 65 |
| 433 SYLVAN Ave #121 | 0.00mi | 2/2.0 (-1) | 1,480 (-14%) | 17mo | $250,000 | $169 | 58 |
Match score weights: distance 35% · size 25% · config 20% · recency 20%. Top-matched comps best support the ARV.
Projected returns pro-forma
-1.06% appreciation · 3.44% rent growth · sell at horizon
- IRR
- 7.1%
- Equity multiple
- 1.32×
- Total profit
- $37,234
- Equity at exit
- $100,010
- IRR
- 13.8%
- Equity multiple
- 2.38×
- Total profit
- $161,958
- Equity at exit
- $104,056
Cash invested: $117,320 (down + closing). Projections, not guarantees.
Landlord ↔ Tenant lean methodology
- Overall (CITY)
- 0 Strongly Tenant-Friendly
- State California
- 18 Strongly Tenant-Friendly · D+13
- County
- — inherits STATE
- City Mountain View
- 0 Strongly Tenant-Friendly · D+34
ZIP-level market 94041
- Home prices YoY
- -0.3%
- Rents YoY
- 3.4%
- Active inventory
- 23
- Price-to-rent
- 7.0×
Monthly cashflow live
- Estimated rent
- $5,008 high interval (Pro) →
- Mortgage (P&I)
- −$2,197
- Tax est. 1.5%
- −$524 /mo · $6,285/yr
- Insurance
- −$175
- HOA
- −$0
- Vacancy / Maint / Mgmt
- −$1,052
- Net cashflow
- $1,061
Break-even live
Sensitivity live
| Price | -10% $1,350 | -5% $1,205 | +0% $1,061 | +5% $916 | +10% $771 |
|---|---|---|---|---|---|
| Rent | -10% $665 | -5% $863 | +0% $1,061 | +5% $1,258 | +10% $1,456 |
| Rate | -1.0pp $1,272 | -0.5pp $1,167 | base $1,061 | +0.5pp $952 | +1.0pp $841 |
UW: 25.0% down · 7.5% · 30yr · 1.5% tax · 5.0% vac · 8.0% maint · 8.0% mgmt
Financing live
Cash to close
- Down payment
- $104,750
- Closing costs
- $12,570
- Reserves months
- —
- Total cash needed
- —
Loan-product check · same deal, 3 products live
Conventional
25% down · 7.5% · 30yr
- Down + closing
- —
- Monthly P&I
- —
- Monthly cashflow
- —
- DSCR
- —
- Eligible?
- —
Personal DTI + credit; lowest rate.
DSCR
20% down · 8.5% · 30yr
- Down + closing
- —
- Monthly P&I
- —
- Monthly cashflow
- —
- DSCR
- —
- Eligible?
- —
No personal income docs; deal must DSCR.
Hard money
10% down · 12.0% · 12mo
- Down + closing
- —
- Monthly P&I
- —
- Monthly cashflow
- —
- DSCR
- —
- Eligible?
- —
Short-term bridge; refi at stabilization.
Rent comps 25 comps
| Address | Beds | Baths | Sqft | Rent | $/sqft | DOM | Units | Dist |
|---|---|---|---|---|---|---|---|---|
| 817 E Dana St Unit 819 Mountain View, CA | 2.0 | 2.0 | 1200 | $4,395 | $3.66 | 2d | 1 | 0.10mi |
| 251 Arriba Dr #450 Sunnyvale, CA | 3.0 | 2.0 | 1300 | $4,970 | $3.82 | 2d | 1 | 0.30mi |
| 1223 W McKinley Ave Unit 3 Sunnyvale, CA | 2.0 | 1.0 | 1100 | $3,099 | $2.82 | 2d | 1 | 0.36mi |
| 555 E Evelyn Ave Mountain View, CA | 3.0 | 1.0–2.0 | 903 | $6,962 | $7.71 | 2d | 18 | 0.36mi |
| 600 Rainbow Dr Mountain View, CA | 1.0–2.0 | 1.0–2.0 | 880 | $4,848 | $5.51 | 2d | 4 | 0.37mi |
| 150 Paseo Ct Mountain View, CA | 3.0 | 2.0 | 1288 | $4,550 | $3.53 | 11d | 1 | 0.50mi |
| 179 Georgetown Ct Mountain View, CA | 3.0 | 3.0 | 1288 | $5,000 | $3.88 | 4d | 1 | 0.54mi |
| 881 E El Camino Real Mountain View, CA | 2.0 | 2.0 | 1079 | $6,042 | $5.60 | 2d | 1 | 0.55mi |
| 1050 Crestview Dr Mountain View, CA | 1.0–2.0 | 1.0–2.0 | 1004 | $4,850 | $4.83 | 2d | 6 | 0.65mi |
| 1033 Crestview Dr #303 Mountain View, CA | 2.0 | 2.0 | 1140 | $3,550 | $3.11 | 24d | 1 | 0.70mi |
| 100 N Whisman Rd Mountain View, CA | 1.0–2.0 | 1.0–1.5 | 909 | $4,248 | $4.67 | 2d | 6 | 0.72mi |
| 695 S Knickerbocker Dr #15 Sunnyvale, CA | 2.0 | 2.5 | 1257 | $4,200 | $3.34 | 11d | 1 | 0.77mi |
| 217 Ada Ave #37 Mountain View, CA | 3.0 | 2.5 | 1484 | $5,400 | $3.64 | 2d | 1 | 0.85mi |
| 221 Geary Way Mountain View, CA | 3.0 | 3.5 | 1748 | $6,650 | $3.80 | 8d | 1 | 0.90mi |
| 291 Geary Way Mountain View, CA | 4.0 | 4.0 | 1744 | $8,495 | $4.87 | 23d | 1 | 0.93mi |
| 991 Belmont Ter #3 Sunnyvale, CA | 2.0 | 2.5 | 1483 | $4,650 | $3.14 | 2d | 1 | 0.95mi |
| 455 W Evelyn Ave Mountain View, CA | 1.0–2.0 | 1.0–2.0 | 992 | $6,615 | $6.66 | 2d | 6 | 1.06mi |
| 180 Pasito Ter Sunnyvale, CA | 1.0–2.0 | 1.0–2.0 | 840 | $4,393 | $5.23 | 2d | 3 | 1.08mi |
| 959 La Mesa Ter Unit G Sunnyvale, CA | 3.0 | 2.5 | 2082 | $5,295 | $2.54 | 2d | 1 | 1.08mi |
| 492 Nuestra Ave Sunnyvale, CA | 4.0 | 3.0 | 2000 | $6,500 | $3.25 | 23d | 1 | 1.08mi |
| 50 E Middlefield Rd Mountain View, CA | 2.0 | 2.0 | 1100 | $3,500 | $3.18 | 20d | 1 | 1.13mi |
| 836 Blair Ave Unit 1 Sunnyvale, CA | 3.0 | 2.0 | 1300 | $4,695 | $3.61 | 11d | 1 | 1.30mi |
| 100 Moffett Blvd Mountain View, CA | 1.0–2.0 | 1.0–2.0 | 970 | $6,300 | $6.49 | 2d | 4 | 1.34mi |
| 108 Bryant St #1653 Mountain View, CA | 3.0 | 2.5 | 1381 | $5,990 | $4.34 | 2d | 1 | 1.38mi |
| 481 S Mathilda Ave Sunnyvale, CA | 2.0 | 1.0–2.0 | 1046 | $5,053 | $4.83 | 2d | 2 | 1.49mi |
Listing history 8 events
-
2026-06-21days on market $419,000 Active 8 DOM
-
2026-06-18days on market $419,000 Active 5 DOM
-
2026-06-17days on market $419,000 Active 4 DOM
-
2026-06-16days on market $419,000 Active 3 DOM
-
2026-06-15days on market $419,000 Active 2 DOM
-
2026-06-13status $419,000 Active 1 DOM
-
2026-06-13remarks 699-char remark
-
2026-06-13$419,000 Coming Soon 1 DOM
ⓘ Source: listings_history table (triggers on properties + properties_extension) + one-shot
backfill from property_details.listing_events for pre-trigger history.
Climate risk First Street
- Flood 1/10 Low FEMA zone X · 0% chance over 30 yrs
- Wildfire 1/10 Low
- Heat 4/10 Moderate 7 d/yr ≥92°F today · 14 d/yr by 30 yrs out
- Wind 1/10 Low
- Air quality 7/10 Severe 13 unhealthy d/yr today · 13 by 30 yrs out
Nearby sold comps map
Loading sold comps map…
Walkable amenities ~0.75 mi
Loading nearby amenities…
Taxation est. · year 1
- Rental income
- $60,093
- − Mortgage interest
- −$23,471
- − Property taxes
- −$6,285
- − Insurance
- −$2,095
- − Repairs & maintenance
- −$4,807
- − Management
- −$4,807
- − Depreciation
- −$12,189
- Taxable income
- $6,439
- Est. tax owed @ 24.0%
- −$1,545
- After-tax cash flow
- $11,181/yr
For passive investors: Depreciation is non-cash, so a rental often shows a tax loss while cash-flowing — sheltering income. Rental losses are passive: they offset passive income freely, and up to $25,000/yr can offset ordinary (W-2) income if you actively participate and your MAGI is under $100k (phasing out to $0 by $150k); unused losses carry forward. On sale, claimed depreciation is recaptured at up to 25%, and gains may owe capital-gains tax (a 1031 exchange can defer both). Figures are a year-1 estimate at your 24.0% rate — not tax advice; consult a CPA.
Schools (NCES district)
- District
- Mountain View-Los Altos Union High
- NCES district ID
- 0626310
- Math proficiency
- 77% ▲ 9.00%
- Reading proficiency
- 86% ▲ 4.00%
- Median HH income
- $161,233
- Composite
- 79.5/100
- National rank
- #59
- State rank
- #11 of 517 in CA
Livability — Mountain View
- Score
- 84/100
- State rank
- #14
- US rank
- #671
Category grades
Schools grade is shown separately in the Schools card above.
Census & demographics
- Census place
- Mountain View, CA
- County
- Santa Clara County · 1,806,974 people
- City population
- 84,858
- Metro
- San Jose-Sunnyvale-Santa Clara, CA
- Population (ZIP)
- 16,050
- Household income
- $178,558
- Rent vs Own
- Severe rent burden
- 981.0
Population outlook (Santa Clara County) Hauer SSP2
- Today (2025)
- 2,179,074 people
- By 2030
- 2,301,297 · +5.6%
- By 2040
- 2,528,195 · +16.0%
- By 2050
- 2,712,135 · +24.5%
- By 2075
- 2,998,701 · +37.6%
- By 2100
- 2,931,429 · +34.5%
Race, ethnicity, and origin ACS 2023
- Neighborhood character
- Highly diverse neighborhood (Simpson 0.71)
- Race & ethnicity
- White 37% Hispanic / Latino 28% Asian 27% Two or more races 13% Black 2% Native American 1%
- Hispanic origin (detail)
- Mexican 17%
- Common ancestry
- Italian 3% Romanian 2% Lithuanian 2%
- Foreign-born
- 39% · Canada, China, Jamaica
- Languages at home
- 50% English-only · Spanish 20% Chinese 11% Other Indo-European 7%
Political lean MEDSL · Santa Clara
- 2024 margin
- Solid D (+40.0) · D 68.1% · R 28.1% · Other 3.8%
- 2008→2024 swing
- -0.9pp no change · 2008: 40.9pp · 2024: 40.0pp
- All cycles
- 2024: D+40.0 2020: D+47.4 2016: D+52.5 2012: D+42.1 2008: D+40.9
Not yet ingested
- Civics
- —
Market trends
- HPI YoY
- ▼ -1.06%
- Current HPI
- 399.4625
- Rent YoY
- ▲ 3.44%
- Metro
- San Jose-Sunnyvale-Santa Clara, CA
- State GDP YoY
- ▲ 3.21%
- F500 in state
- 116
Industry mix (Fortune 500 HQ in CA)
| Industry | F500 HQs | Revenue |
|---|---|---|
| Technology | 27 | $1,492B |
|
||
| Financial Services | 3 | $174B |
|
||
| Retail | 3 | $44B |
|
||
| Insurance | 3 | $26B |
|
||
| Media / Entertainment | 2 | $115B |
|
||
| Pharmaceuticals / Biotech | 2 | $62B |
|
||
Price history
+166.9% since first listed18 events — show timeline
- 2026-06-12 Coming Soon $419,000 CRMLS
- 2022-03-30 Sold (MLS) $322,000 MLSListings
- 2022-03-03 Pending — MLSListings
- 2022-03-01 Listed $335,000 MLSListings
- 2017-06-23 Sold (MLS) $303,475 MLSListings
- 2017-06-09 Pending — MLSListings
- 2017-06-09 Contingent — MLSListings
- 2017-05-31 Relisted — MLSListings
- 2017-05-31 Contingent — MLSListings
- 2017-05-05 Price Changed $315,000 MLSListings
- 2017-03-27 Relisted — MLSListings
- 2017-03-22 Pending — MLSListings
- 2017-03-22 Relisted — MLSListings
- 2017-03-22 Pending — MLSListings
- 2017-03-13 Listed $324,450 MLSListings
- 2012-05-04 Sold (MLS) $149,999 MLSListings
- 2012-04-24 Pending — MLSListings
- 2011-10-13 Listed $156,999 MLSListings
Cash-flow waterfall
monthlySold comps — $/sqft
last 12 mo · ≤1 miLoading sold comps…