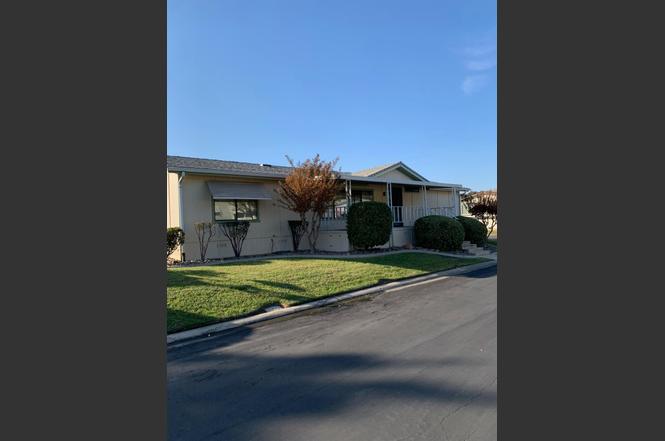
700 2nd St #14 · Galt, CA
Flood risk 1/10 · Minimal
- FEMA flood zone
- X (unshaded)
- Chance of flooding over 30 yrs
- 0.0%
- Est. flood insurance / yr
- $507 – $1,088
Fire risk 6/10 · Moderate
- Est. fire insurance / yr
- $659 – $1,223
Heat risk 7/10 · Major
- Hot days now (above 101°F)
- 7 days/yr
- Hot days in 30 yrs
- 14 days/yr
Wind risk 1/10 · Minimal
- Chance of severe wind over 30 yrs
- —
Air-quality risk 10/10 · Severe
- Unhealthy air days now
- 24 days/yr
- Unhealthy air days in 30 yrs
- 25 days/yr
Risk factors via First Street. Map © Google.
Why this score? — see what drove the C grade
The composite is a weighted blend of 9 inputs, each scored 0–100. Each bar is that input's sub-score; the figure is the points it added to the 100-point composite (weight × sub-score).
- Cash flow +28.0/30.0
- DSCR +9.9/10.0
- 1% rule +7.7/10.0
- Schools +4.4/10.0
- Livability +2.9/5.0
- Rent growth +2.5/5.0
- Condition / age +2.5/5.0
- ARV discount +1.8/15.0
- Appreciation +0.0/10.0
$224,000
🖨 Deal sheet 📄 Offer letter ✓ Due diligence
Listing remarks
Welcome to this rare 3-bedroom home, one of the few in the entire community of Heritage Park! Situated on a desirable corner lot, this home offers a spacious and functional layout with bedrooms thoughtfully positioned on opposite ends for added privacy. While it has only had one owner and retains much of its original charm, it does present an exciting opportunity for updates and personal touches. Notable recent improvements include a newly rebuilt deck and shed, as well as recently repaired siding. The exterior has also been power washed, enhancing the curb appeal. The property boasts a mature orange and lemon tree, providing fresh citrus right from your own yard. With a little TLC, this ho
Key facts
- Mature fruit trees
- Rebuilt deck
- Corner lot
Tags
Neighborhood map
What this means for you Summary
Snapshot
- This is a 3-bed/2.0-bath manufactured listed at $224k.
Deal economics
- At list price, monthly cash flow is $695 ($8k/yr) — positive.
- The deal already cash-flows at list — no discount required.
- Meets the 1% rule at list price ($3k rent vs $224k).
- Recommended offer: $197k (12.0% below list) — sets the bar for market timing.
- Cap rate 10.0% vs local median 3.3% in Galt — top-decile yield for the area; either an underpriced asset or a hidden risk that comps aren't pricing in. Stress-test before assuming the spread holds.
Location & tenants
- Location reads 57/100 on livability (#733 in CA) — a working-class tenant base; expect higher turnover. Strengths: housing A+, employment B; Watch: crime C-, schools D, amenities F.
- Galt Joint Union High (town): math 75% / reading 25% proficiency, ranked #137 of 517 in CA (top 26%) — acceptable for families but not a draw, mixed tenant base, ~2y average lease.
- Market conditions: 308 active listings in the ZIP; 3 comparable units currently listed for rent nearby; rentals leasing fast (median 2d on market — plan ~1-2 weeks tenant-placement turnaround); solid renter incomes; 6,825 units permitted in Sacramento County in 2024 (1,752 in 5+ unit buildings).
- This rent runs 33% of the median local income ($102k/yr) — at the standard rent-burdened threshold; future hikes will face affordability resistance.
Forward outlook
- Local home prices are declining (-3.0%/yr); year-one equity from $2k of loan paydown is wiped out by about $7k of value loss. Plan a longer hold.
- Sacramento County population projected at +17% by 2050 — long-run rental-demand tailwind backs the buy-and-hold thesis.
- At projected returns (-3.0% appreciation + 3.0% rent growth), your $63k cash investment doubles in ~9 years — after that, you're playing with house money.
Negotiation context
- It's been on market 166 days — a 12% lower offer ($197k) is reasonable based on typical stale-listing flexibility.
- 2 sale attempts since 2y ago with the ask held roughly flat each time — persistent listings suggest the price (not the market) is what's stuck; bring a comps-based counter.
Risks & watch-outs
- Climate carrying-cost: major wildfire risk; extreme-heat days projected 7→14/yr by 2055 (HVAC capex compounding) — expect insurance premiums to compound above CPI over the hold.
Questions for the listing agent
- It's been on market 166 days. Have you received any prior offers? Is the seller open to a 12% concession, seller financing, or rate buy-down credit?
- Why hasn't it sold? Are there any deal-killer items the seller is aware of (foundation, flood, title, zoning, code violations)?
- Is there a deadline driving the sale (1031 exchange, divorce, estate, relocation)? That informs how much negotiation room exists.
- Schools are D-rated, which usually means shorter tenancies and higher turnover. Who's the typical renter profile here, and what's been the actual vacancy rate?
- What's the average days-on-market for RENTAL listings here right now (not sales)? A rising rental-DOM trend means longer vacancies and softer asking-rent achievability than the comps imply.
- What's the recent tenant-quality profile in this submarket — average credit score on applications, eviction rate, late-payment / NSF rate, and stable-employment percentage? A property-management company in the area should have these aggregated.
- How much new for-sale + rental construction is in the pipeline within 1–3 miles? Heavy new supply typically softens prices + rents 12–24 months out; constrained supply supports both.
Investment metrics
- 1% rule
- 1.27% ✓
- Cap rate
- 10.02%
- Cash-on-cash
- 13.30%
- DSCR
- 1.59
- GRM
- 6.6
CMA / ARV
- ARV (on-the-fly)
- $198,912
- Comps found
- 3
Show comp detail 3 sales within ~0.75 mi
| Address | Dist | Beds/Ba | Sqft | Sold | Price | $/sf | Match |
|---|---|---|---|---|---|---|---|
| 700 2nd St #59 | 0.00mi | 2/2.0 (-1) | 1,344 (0%) | 13mo | $154,000 | $115 | 84 |
| 700 S 2nd St #28 | 0.00mi | 2/2.0 (-1) | 1,456 (+8%) | 24mo | $230,000 | $158 | 61 |
| 700 2nd St #43 | 0.00mi | 2/2.0 (-1) | 1,152 (-14%) | 22mo | $170,000 | $148 | 53 |
Match score weights: distance 35% · size 25% · config 20% · recency 20%. Top-matched comps best support the ARV.
Projected returns pro-forma
-3.0% appreciation · 3.0% rent growth · sell at horizon
- IRR
- 3.3%
- Equity multiple
- 1.13×
- Total profit
- $8,033
- Equity at exit
- $33,399
- IRR
- 12.9%
- Equity multiple
- 2.02×
- Total profit
- $64,198
- Equity at exit
- $19,367
Cash invested: $62,720 (down + closing). Projections, not guarantees.
Landlord ↔ Tenant lean methodology
- Overall (STATE)
- 18 Strongly Tenant-Friendly
- State California
- 18 Strongly Tenant-Friendly · D+13
- County
- — inherits STATE
- City
- — inherits STATE
ZIP-level market 95632
- Active inventory
- 308
- Price-to-rent
- 6.6×
Monthly cashflow live
- Estimated rent
- $2,840 medium interval (Pro) →
- Mortgage (P&I)
- −$1,175
- Tax est. 1.5%
- −$280 /mo · $3,360/yr
- Insurance
- −$93
- HOA
- −$0
- Vacancy / Maint / Mgmt
- −$596
- Net cashflow
- $695
Break-even live
UW: 25.0% down · 7.5% · 30yr · 1.5% tax · 5.0% vac · 8.0% maint · 8.0% mgmt
Financing live
Cash to close
- Down payment
- $56,000
- Closing costs
- $6,720
- Reserves months
- —
- Total cash needed
- —
Loan-product check · same deal, 3 products live
Conventional
25% down · 7.5% · 30yr
- Down + closing
- —
- Monthly P&I
- —
- Monthly cashflow
- —
- DSCR
- —
- Eligible?
- —
Personal DTI + credit; lowest rate.
DSCR
20% down · 8.5% · 30yr
- Down + closing
- —
- Monthly P&I
- —
- Monthly cashflow
- —
- DSCR
- —
- Eligible?
- —
No personal income docs; deal must DSCR.
Hard money
10% down · 12.0% · 12mo
- Down + closing
- —
- Monthly P&I
- —
- Monthly cashflow
- —
- DSCR
- —
- Eligible?
- —
Short-term bridge; refi at stabilization.
Rent comps 3 comps
| Address | Beds | Baths | Sqft | Rent | $/sqft | DOM | Units | Dist |
|---|---|---|---|---|---|---|---|---|
| 111 E St Galt, CA | 4.0 | 2.0 | 1500 | $2,795 | $1.86 | 2d | 1 | 0.24mi |
| 410 5th St Unit 1 Galt, CA | 2.0 | 1.5 | 900 | $1,895 | $2.11 | 2d | 1 | 0.41mi |
| 243 Rio Mesa Ct Galt, CA | 3.0 | 2.0 | 1582 | $3,250 | $2.05 | 2d | 1 | 0.53mi |
Listing history 5 events
-
2025-04-16status Pending
-
2025-01-30historical Contingent - No Show
-
2024-10-17status Active
-
2024-10-08historical Contingent - Show
-
2024-09-16$224,000 Active
ⓘ Source: listings_history table (triggers on properties + properties_extension) + one-shot
backfill from property_details.listing_events for pre-trigger history.
Climate risk First Street
- Flood 1/10 Low FEMA zone X (unshaded) · 0% chance over 30 yrs
- Wildfire 6/10 Major
- Heat 7/10 Severe 7 d/yr ≥101°F today · 14 d/yr by 30 yrs out
- Wind 1/10 Low
- Air quality 10/10 Extreme 24 unhealthy d/yr today · 25 by 30 yrs out
Nearby sold comps map
Loading sold comps map…
Walkable amenities ~0.75 mi
Loading nearby amenities…
Taxation est. · year 1
- Rental income
- $34,077
- − Mortgage interest
- −$12,547
- − Property taxes
- −$3,360
- − Insurance
- −$1,120
- − Repairs & maintenance
- −$2,726
- − Management
- −$2,726
- − Depreciation
- −$6,516
- Taxable income
- $5,081
- Est. tax owed @ 24.0%
- −$1,219
- After-tax cash flow
- $7,125/yr
For passive investors: Depreciation is non-cash, so a rental often shows a tax loss while cash-flowing — sheltering income. Rental losses are passive: they offset passive income freely, and up to $25,000/yr can offset ordinary (W-2) income if you actively participate and your MAGI is under $100k (phasing out to $0 by $150k); unused losses carry forward. On sale, claimed depreciation is recaptured at up to 25%, and gains may owe capital-gains tax (a 1031 exchange can defer both). Figures are a year-1 estimate at your 24.0% rate — not tax advice; consult a CPA.
Schools (NCES district)
- District
- Galt Joint Union High
- NCES district ID
- 0614820
- Math proficiency
- 75% ▲ 48.00%
- Reading proficiency
- 25% ▼ -32.00%
- Median HH income
- $62,916
- Composite
- 44.24/100
- National rank
- #2844
- State rank
- #137 of 517 in CA
Livability — Galt
- Score
- 57/100
- State rank
- #733
- US rank
- #21603
Category grades
Schools grade is shown separately in the Schools card above.
Census & demographics
- Census place
- Galt, CA
- County
- Sacramento County · 1,539,646 people
- City population
- 32,493
- Metro
- Sacramento-Roseville-Folsom, CA
- Population (ZIP)
- 32,493
- Household income
- $102,239
- Rent vs Own
- Severe rent burden
- 476.0
Population outlook (Sacramento County) Hauer SSP2
- Today (2025)
- 1,660,763 people
- By 2030
- 1,732,990 · +4.3%
- By 2040
- 1,855,755 · +11.7%
- By 2050
- 1,941,335 · +16.9%
- By 2075
- 2,046,162 · +23.2%
- By 2100
- 1,961,444 · +18.1%
Race, ethnicity, and origin ACS 2023
- Neighborhood character
- Diverse neighborhood (Simpson 0.60)
- Race & ethnicity
- White 45% Hispanic / Latino 44% Two or more races 16% Asian 5% Native American 2% Black 2%
- Hispanic origin (detail)
- Mexican 42%
- Common ancestry
- Russian 4% Italian 2% Slovak 2%
- Foreign-born
- 19% · Canada, China, Vietnam
- Languages at home
- 63% English-only · Spanish 32% Other Indo-European 2% Other Asian/Pacific 1%
Political lean MEDSL · Sacramento
- 2024 margin
- D (+19.7) · D 58.1% · R 38.4% · Other 3.5%
- 2008→2024 swing
- +0.7pp no change · 2008: 19.0pp · 2024: 19.7pp
- All cycles
- 2024: D+19.7 2020: D+25.3 2016: D+23.7 2012: D+16.3 2008: D+19.0
Not yet ingested
- Civics
- —
Market trends
- HPI YoY
- ▼ -309.48%
- Current HPI
- 309.3197
- Rent YoY
- —
- Metro
- Sacramento-Roseville-Folsom, CA
- State GDP YoY
- ▲ 3.21%
- F500 in state
- 116
Industry mix (Fortune 500 HQ in CA)
| Industry | F500 HQs | Revenue |
|---|---|---|
| Technology | 27 | $1,492B |
|
||
| Financial Services | 3 | $174B |
|
||
| Retail | 3 | $44B |
|
||
| Insurance | 3 | $26B |
|
||
| Media / Entertainment | 2 | $115B |
|
||
| Pharmaceuticals / Biotech | 2 | $62B |
|
||
Price history
5 events — show timeline
- 2025-04-16 Pending — San Francisco MLS
- 2025-01-30 Contingent — San Francisco MLS
- 2024-10-17 Relisted — San Francisco MLS
- 2024-10-08 Contingent — San Francisco MLS
- 2024-09-16 Listed $224,000 San Francisco MLS
Property tax history
+0.9%/yrLatest (2025): $367 · -1.3% YoY. Source: county tax records.
Cash-flow waterfall
monthlySold comps — $/sqft
last 12 mo · ≤1 miLoading sold comps…