720 Elm St · Seminole, OK
Flood risk No data
- FEMA flood zone
- —
- Chance of flooding over 30 yrs
- —
- Est. flood insurance / yr
- —
Fire risk No data
- Est. fire insurance / yr
- —
Heat risk No data
- Hot days now (above threshold)
- —
- Hot days in 30 yrs
- —
Wind risk No data
- Chance of severe wind over 30 yrs
- —
Air-quality risk No data
- Unhealthy air days now
- —
- Unhealthy air days in 30 yrs
- —
Risk factors via First Street. Map © Google.
Why this score? — see what drove the D- grade
The composite is a weighted blend of 9 inputs, each scored 0–100. Each bar is that input's sub-score; the figure is the points it added to the 100-point composite (weight × sub-score).
- Appreciation +10.0/10.0
- ARV discount +7.5/15.0
- Cash flow +7.4/30.0
- Livability +3.2/5.0
- Rent growth +2.5/5.0
- Condition / age +2.5/5.0
- 1% rule +2.1/10.0
- DSCR +1.6/10.0
- Schools +1.6/10.0
$154,900
🖨 Deal sheet 📄 Offer letter ✓ Due diligence
Listing remarks
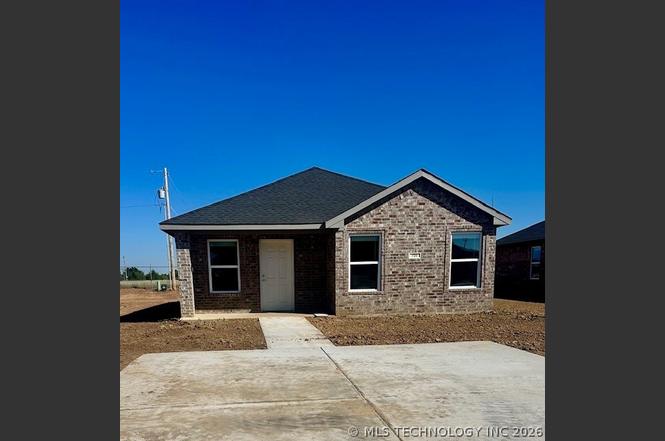
Step into comfort, and efficiency with this stunning brick home in one of Seminole’s fastest-growing subdivisions! Featuring 3 spacious bedrooms, 2 modern bathrooms, and an open-concept layout, this home is designed for both style and functionality. The gourmet kitchen boasts sleek granite countertops, perfect for cooking and entertaining. Enjoy year-round comfort with central heat and air and unwind outdoors in your covered porch overlooking a great backyard. Don’t miss out—schedule your tour today before it’s gone! Up to $14,951 in down payment assisstance available! Estimated finish date in thirty days due to rain.
Key facts
- Covered porch
- Gourmet kitchen
- Brick home
Tags
Property features AI
Exterior
- Security: No safety shelter
- Utilities: Electricity available; Public water; Public sewer
- Home design: Single-story; Faces east; Slab foundation
- Construction: Brick and wood frame construction; Asphalt/fiberglass roof; Built by builder (year built source: Builder); Has home warranty
- Exterior features: Porch; No other exterior features listed
Interior
- Kitchen: Dishwasher; Range / Stove
- Flooring: Laminate
- Bathrooms: 2 full bathrooms
- Heating & cooling: Central heating (electric); Central air conditioning
- Interior features: Granite counters; No additional interior features listed
- Laundry & utility: Electric water heater
Neighborhood map
What this means for you Summary
Snapshot
- This is a 3-bed/2.0-bath single-family listed at $155k.
Deal economics
- At list price, monthly cash flow is $-197 ($-2k/yr) — negative.
- To cash-flow at today's rent, offer at most $126k (18.4% below list).
- To meet the 1% rule (rent ≥ 1% of price), the offer needs to be $111k (28.6% below list).
- Recommended offer: $111k (28.6% below list) — sets the bar for 1% rule.
Location & tenants
- Location reads 63/100 on livability (#222 in OK) — a middle-class / working-renter tenant base. Strengths: cost of living A+, housing A; Watch: crime D+, schools F, amenities F.
- Seminole (town): math 17% / reading 21% proficiency, ranked #193 of 270 in OK (top 72%) — low school quality limits family demand, transient renter base, plan for 1-2y turnover; 63% free/reduced lunch — lower-income household profile, screen leases tightly.
- Market conditions: 136 active listings in the ZIP; 93 units permitted in Seminole County in 2024 (43 in 5+ unit buildings).
Forward outlook
- In year one you build about $17k of equity ($1k loan paydown + $15k appreciation (10.0% local appreciation)).
- By year 3, paydown + projected appreciation supports a ~$42k cash-out refi (75% LTV) — recoverable capital for the next deal without selling this one.
Negotiation context
- It's been on market 101 days — a 9% lower offer ($141k) is reasonable based on typical stale-listing flexibility.
- 2 sale attempts; this cycle's ask has dropped $10k (6%) from the opening price — seller is motivated, your offer sets the floor, not the list.
Questions for the listing agent
- What do current leases actually rent for vs. the listed asking? Can we see a recent rent roll and the last 12 months of T-12 income?
- It's been on market 101 days. Have you received any prior offers? Is the seller open to a 29% concession, seller financing, or rate buy-down credit?
- Why hasn't it sold? Are there any deal-killer items the seller is aware of (foundation, flood, title, zoning, code violations)?
- Is there a deadline driving the sale (1031 exchange, divorce, estate, relocation)? That informs how much negotiation room exists.
- Schools are F-rated, which usually means shorter tenancies and higher turnover. Who's the typical renter profile here, and what's been the actual vacancy rate?
- Crime grade is D in this area — have there been break-ins, vandalism, or insurance claims at this property in the last 3 years? What carrier currently insures it and at what premium?
- The area grade is low — what's the realistic commute time and amenity access for the typical tenant pool here? Any planned neighborhood developments (good or bad) we should know about?
- What's the average days-on-market for RENTAL listings here right now (not sales)? A rising rental-DOM trend means longer vacancies and softer asking-rent achievability than the comps imply.
- What's the recent tenant-quality profile in this submarket — average credit score on applications, eviction rate, late-payment / NSF rate, and stable-employment percentage? A property-management company in the area should have these aggregated.
- How much new for-sale + rental construction is in the pipeline within 1–3 miles? Heavy new supply typically softens prices + rents 12–24 months out; constrained supply supports both.
Investment metrics
- 1% rule
- 0.71% ✗
- Cap rate
- 4.76%
- Cash-on-cash
- -5.46%
- DSCR
- 0.76
- GRM
- 11.7
CMA / ARV
- ARV (on-the-fly)
- $57,132
- Comps found
- 12
Show comp detail 12 sales within ~0.75 mi
| Address | Dist | Beds/Ba | Sqft | Sold | Price | $/sf | Match |
|---|---|---|---|---|---|---|---|
| 712 Elm St | 0.00mi | 3/2.0 | 1,242 (0%) | 1mo | $162,500 | $131 | 100 |
| 716 Elm St | 0.00mi | 3/2.0 | 1,242 (0%) | 3mo | $165,900 | $134 | 97 |
| 901 Lincoln St | 0.15mi | 3/1.5 | 1,384 (+11%) | 6mo | $120,000 | $87 | 67 |
| 903 Jefferson St | 0.63mi | 3/1.0 | 1,235 (-1%) | 1mo | $100,000 | $81 | 64 |
| 801 Hoover St | 0.42mi | 2/1.0 (-1) | 1,184 (-5%) | 8mo | $18,600 | $16 | 57 |
| 1222 Gessel St | 0.57mi | 3/1.0 | 1,188 (-4%) | 8mo | $21,000 | $18 | 56 |
| 600 Hoover St | 0.58mi | 3/1.0 | 1,152 (-7%) | 7mo | $17,000 | $15 | 51 |
| 1509 Boren Blvd | 0.45mi | 2/1.0 (-1) | 1,100 (-11%) | 2mo | $15,500 | $14 | 50 |
| 1412 Ideal St | 0.37mi | 2/1.0 (-1) | 1,104 (-11%) | 7mo | $120,000 | $109 | 49 |
| 1314 Roosevelt St | 0.52mi | 3/1.0 | 1,092 (-12%) | 6mo | $26,000 | $24 | 47 |
| 812 Hoover St | 0.38mi | 2/1.0 (-1) | 1,060 (-15%) | 6mo | $49,000 | $46 | 44 |
| 1120 Eureka St | 0.65mi | 2/1.0 (-1) | 1,084 (-13%) | 3mo | $45,000 | $42 | 37 |
Match score weights: distance 35% · size 25% · config 20% · recency 20%. Top-matched comps best support the ARV.
Projected returns pro-forma
10.0% appreciation · 3.0% rent growth · sell at horizon
- IRR
- 20.4%
- Equity multiple
- 2.66×
- Total profit
- $71,816
- Equity at exit
- $139,546
- IRR
- 18.6%
- Equity multiple
- 6.10×
- Total profit
- $221,398
- Equity at exit
- $300,937
Cash invested: $43,372 (down + closing). Projections, not guarantees.
Landlord ↔ Tenant lean methodology
- Overall (STATE)
- 83 Strongly Landlord-Friendly
- State Oklahoma
- 83 Strongly Landlord-Friendly · R+20
- County
- — inherits STATE
- City
- — inherits STATE
ZIP-level market 74868
- Home prices YoY
- 6.4%
- Active inventory
- 136
- Price-to-rent
- 11.7×
Monthly cashflow live
- Estimated rent
- $1,105 medium interval (Pro) →
- Mortgage (P&I)
- −$812
- Tax est. 1.5%
- −$194 /mo · $2,324/yr
- Insurance
- −$65
- HOA
- −$0
- Vacancy / Maint / Mgmt
- −$232
- Net cashflow
- $-197
Break-even live
UW: 25.0% down · 7.5% · 30yr · 1.5% tax · 5.0% vac · 8.0% maint · 8.0% mgmt
Financing live
Cash to close
- Down payment
- $38,725
- Closing costs
- $4,647
- Reserves months
- —
- Total cash needed
- —
Loan-product check · same deal, 3 products live
Conventional
25% down · 7.5% · 30yr
- Down + closing
- —
- Monthly P&I
- —
- Monthly cashflow
- —
- DSCR
- —
- Eligible?
- —
Personal DTI + credit; lowest rate.
DSCR
20% down · 8.5% · 30yr
- Down + closing
- —
- Monthly P&I
- —
- Monthly cashflow
- —
- DSCR
- —
- Eligible?
- —
No personal income docs; deal must DSCR.
Hard money
10% down · 12.0% · 12mo
- Down + closing
- —
- Monthly P&I
- —
- Monthly cashflow
- —
- DSCR
- —
- Eligible?
- —
Short-term bridge; refi at stabilization.
Listing history 19 events
-
2026-06-18days on market $154,900 Active 101 DOM
-
2026-06-17days on market $154,900 Active 100 DOM
-
2026-06-16days on market $154,900 Active 99 DOM
-
2026-06-15days on market $154,900 Active 98 DOM
-
2026-06-13days on market $154,900 Active 96 DOM
-
2026-06-12days on market $154,900 Active 95 DOM
-
2026-06-09days on market $154,900 Active 92 DOM
-
2026-06-08days on market $154,900 Active 91 DOM
-
2026-06-08days on market $154,900 Active 90 DOM
-
2026-06-07days on market $154,900 Active 89 DOM
-
2026-06-04days on market $154,900 Active 86 DOM
-
2026-06-02days on market $154,900 Active 85 DOM
-
2026-06-01days on market $154,900 Active 84 DOM
-
2026-05-31days on market $154,900 Active 83 DOM
-
2026-05-15price $154,900
-
2026-03-09$164,900 Active
-
2026-03-07historical
-
2025-10-28price $165,900
-
2025-03-07$175,900 Active
ⓘ Source: listings_history table (triggers on properties + properties_extension) + one-shot
backfill from property_details.listing_events for pre-trigger history.
Nearby sold comps map
Loading sold comps map…
Walkable amenities ~0.75 mi
Loading nearby amenities…
Taxation est. · year 1
- Rental income
- $13,264
- − Mortgage interest
- −$8,677
- − Property taxes
- −$2,324
- − Insurance
- −$774
- − Repairs & maintenance
- −$1,061
- − Management
- −$1,061
- − Depreciation
- −$4,506
- Taxable loss
- −$5,139
- Est. tax savings @ 24.0%
- +$1,233
- After-tax cash flow
- $-1,134/yr
For passive investors: Depreciation is non-cash, so a rental often shows a tax loss while cash-flowing — sheltering income. Rental losses are passive: they offset passive income freely, and up to $25,000/yr can offset ordinary (W-2) income if you actively participate and your MAGI is under $100k (phasing out to $0 by $150k); unused losses carry forward. On sale, claimed depreciation is recaptured at up to 25%, and gains may owe capital-gains tax (a 1031 exchange can defer both). Figures are a year-1 estimate at your 24.0% rate — not tax advice; consult a CPA.
Schools (NCES district)
- District
- Seminole
- NCES district ID
- 4027300
- Math proficiency
- 17% ▼ -10.00%
- Reading proficiency
- 21% ▼ -5.00%
- Median HH income
- $33,661
- Composite
- 15.51/100
- National rank
- #9304
- State rank
- #193 of 270 in OK
Livability — Seminole
- Score
- 63/100
- State rank
- #222
- US rank
- #15706
Category grades
Schools grade is shown separately in the Schools card above.
Census & demographics
- Census place
- Seminole, OK
- Population (ZIP)
- 12,451
Population outlook (Seminole County) Hauer SSP2
- Today (2025)
- 25,628 people
- By 2030
- 25,617 · +-0.0%
- By 2040
- 25,619 · +-0.0%
- By 2050
- 25,726 · +0.4%
- By 2075
- 26,261 · +2.5%
- By 2100
- 25,844 · +0.8%
Race, ethnicity, and origin ACS 2023
- Neighborhood character
- Diverse neighborhood (Simpson 0.57)
- Race & ethnicity
- White 65% Native American 19% Two or more races 10% Hispanic / Latino 5% Black 4%
- Hispanic origin (detail)
- Mexican 4%
- Common ancestry
- Iranian 1% Italian 1% Slovak 1%
- Foreign-born
- 3% · Canada
- Languages at home
- 96% English-only · Spanish 2%
Political lean MEDSL · Seminole
- 2024 margin
- Solid R (+49.7) · D 24.2% · R 74.0% · Other 1.8%
- 2008→2024 swing
- -19.1pp toward R · 2008: -30.6pp · 2024: -49.7pp
- All cycles
- 2024: R+49.7 2020: R+46.3 2016: R+44.1 2012: R+30.3 2008: R+30.6
Not yet ingested
- Civics
- —
Market trends
- HPI YoY
- ▲ 15.39%
- Current HPI
- 255.6657
- Rent YoY
- —
- Metro
- —
- State GDP YoY
- ▲ 1.55%
- F500 in state
- 6
Industry mix (Fortune 500 HQ in OK)
| Industry | F500 HQs | Revenue |
|---|---|---|
| Energy | 3 | $48B |
|
||
Price history
-11.9% since first listed5 events — show timeline
- 2026-05-15 Price Changed $154,900 MLS Technology, Inc.
- 2026-03-09 Listed $164,900 MLS Technology, Inc.
- 2026-03-07 Listing Removed — MLS Technology, Inc.
- 2025-10-28 Price Changed $165,900 MLS Technology, Inc.
- 2025-03-07 Listed $175,900 MLS Technology, Inc.
Cash-flow waterfall
monthlySold comps — $/sqft
last 12 mo · ≤1 miLoading sold comps…