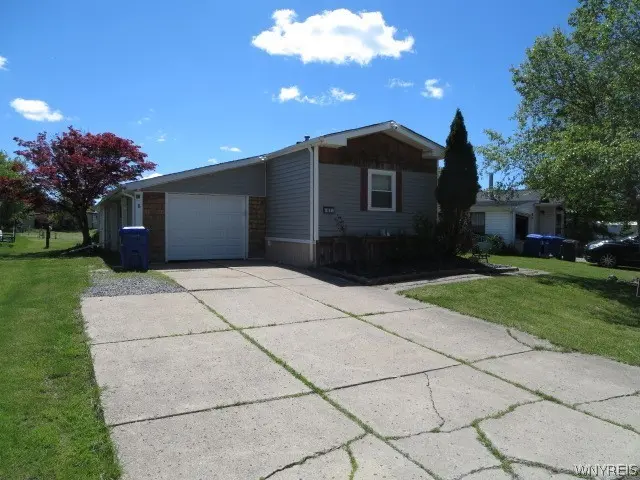
67 W Canyon Dr · Blasdell, NY
Flood risk 1/10 · Minimal
- FEMA flood zone
- X (unshaded)
- Chance of flooding over 30 yrs
- 0.0%
- Est. flood insurance / yr
- $507 – $1,088
Fire risk 1/10 · Minimal
- Est. fire insurance / yr
- $691 – $1,283
Heat risk 2/10 · Minimal
- Hot days now (above 93°F)
- 7 days/yr
- Hot days in 30 yrs
- 16 days/yr
Wind risk 1/10 · Minimal
- Chance of severe wind over 30 yrs
- —
Air-quality risk 4/10 · Minor
- Unhealthy air days now
- 4 days/yr
- Unhealthy air days in 30 yrs
- 9 days/yr
Risk factors via First Street. Map © Google.
Why this score? — see what drove the C+ grade
The composite is a weighted blend of 9 inputs, each scored 0–100. Each bar is that input's sub-score; the figure is the points it added to the 100-point composite (weight × sub-score).
- Cash flow +30.0/30.0
- 1% rule +10.0/10.0
- DSCR +10.0/10.0
- Schools +4.7/10.0
- Rent growth +3.8/5.0
- Livability +3.3/5.0
- Condition / age +2.5/5.0
- ARV discount +0.0/15.0
- Appreciation +0.0/10.0
$59,000
🖨 Deal sheet 📄 Offer letter ✓ Due diligence
Listing remarks
Best Value on the Market! 2 bedroom 2 bath double wide - spacious living. Chef's kitchen with newer appliances that stay. Family room and bedrooms with newer gray wall to wall carpeting. All new windows, 6 new doors, new blinds, furnace and central air 2 years - Hot water tank 3 years. Both remodeled baths have walk in showers. Primary bedroom with ensuite & walk in closet. Garage with 2 openers and screen for garage door. Bonus room heated & could be office/den/flex space. Parking on driveway for 4 cars. 2 Ring doorbells- 1 will stay plus 2 security cameras - Always on & recording. Sprinkler system, huge deck for R & R & has recently been stained. Many extra's
Key facts
- Ensuite
- Newer appliances
- Walk in showers
Tags
Property features AI
Finance
- Financial info: Land lease (reported)
Exterior
- Parking: Attached garage with garage door opener; 1-car garage
- Security: Owned security system
- Utilities: Public water (connected); Sewer connected; Cable available; Circuit breaker electrical system
- Home design: Single-story residence; Double-wide body type (manufactured/mobile home); Resale property; Asphalt roof; Vinyl siding; Copper plumbing; Property faces a city street; Rectangular residential lot (approx. 40 x 110)
- Construction: Vinyl siding construction; Asphalt roof; Copper plumbing
- Exterior features: Concrete driveway; Deck; Automatic sprinkler/irrigation; Shed(s) and additional storage; Security system (owned)
Interior
- Kitchen: Built-in refrigerator; Dishwasher; Gas oven; Gas range; Microwave; Eat-in kitchen with breakfast bar
- Bedrooms: Three main-level bedrooms
- Flooring: Carpet; Laminate; Varies
- Bathrooms: Two full bathrooms (both on main level)
- Heating & cooling: Gas forced-air heating; Central air conditioning
- Interior features: No stairs (accessible); Breakfast bar; Ceiling fan(s); Entrance foyer; Eat-in kitchen; Combined living/dining room; Storage; Natural woodwork; Bedroom on main level; Main level primary
- Laundry & utility: Main-level laundry with accessible utilities; Gas water heater
Neighborhood map
What this means for you Summary
Snapshot
- This is a 2-bed/2.0-bath manufactured listed at $59k.
Deal economics
- At list price, monthly cash flow is $842 ($10k/yr) — positive.
- The deal already cash-flows at list — no discount required.
- Meets the 1% rule at list price ($2k rent vs $59k).
- Recommended offer: $58k (1.5% below list) — sets the bar for market timing.
- Cap rate 23.4% vs local median 4.5% in Blasdell — top-decile yield for the area; either an underpriced asset or a hidden risk that comps aren't pricing in. Stress-test before assuming the spread holds.
Location & tenants
- Location reads 66/100 on livability (#643 in NY) — a middle-class / working-renter tenant base. Strengths: cost of living A+, housing A+, health & safety A+; Watch: employment D, schools D-, amenities F.
- Frontier Central School District (suburban): math 54% / reading 55% proficiency, ranked #301 of 590 in NY (top 51%) — acceptable for families but not a draw, mixed tenant base, ~2y average lease; only 20% free/reduced lunch — higher-income household profile.
- Market conditions: Rents rising fast (+5.2%/yr); 262 active listings in the ZIP; 5 comparable units currently listed for rent nearby; rentals leasing fast (median 2d on market — plan ~1-2 weeks tenant-placement turnaround); solid renter incomes; 1,244 units permitted in Erie County in 2024 (563 in 5+ unit buildings).
Forward outlook
- Local home prices are declining (-3.0%/yr); year-one equity from $408 of loan paydown is wiped out by about $2k of value loss. Plan a longer hold.
- At projected returns (-3.0% appreciation + 5.2% rent growth), your $17k cash investment doubles in ~2 years — after that, you're playing with house money.
Negotiation context
- It's been on market 17 days — a 2% lower offer ($58k) is reasonable based on typical stale-listing flexibility.
- 2 sale attempts since 3y ago with the ask held roughly flat each time — persistent listings suggest the price (not the market) is what's stuck; bring a comps-based counter.
Questions for the listing agent
- Is there a deadline driving the sale (1031 exchange, divorce, estate, relocation)? That informs how much negotiation room exists.
- Schools are D-rated, which usually means shorter tenancies and higher turnover. Who's the typical renter profile here, and what's been the actual vacancy rate?
- What's the average days-on-market for RENTAL listings here right now (not sales)? A rising rental-DOM trend means longer vacancies and softer asking-rent achievability than the comps imply.
- What's the recent tenant-quality profile in this submarket — average credit score on applications, eviction rate, late-payment / NSF rate, and stable-employment percentage? A property-management company in the area should have these aggregated.
- How much new for-sale + rental construction is in the pipeline within 1–3 miles? Heavy new supply typically softens prices + rents 12–24 months out; constrained supply supports both.
Investment metrics
- 1% rule
- 2.70% ✓
- Cap rate
- 23.41%
- Cash-on-cash
- 61.14%
- DSCR
- 3.72
- GRM
- 3.1
CMA / ARV
- ARV (on-the-fly)
- $45,752
- Comps found
- 12
Show comp detail 12 sales within ~0.75 mi
| Address | Dist | Beds/Ba | Sqft | Sold | Price | $/sf | Match |
|---|---|---|---|---|---|---|---|
| 21 Brush Dr | 0.20mi | 3/2.0 (+1) | 1,066 (+0%) | 4mo | $93,500 | $88 | 82 |
| 17 Rippleway Dr | 0.35mi | 3/1.0 (+1) | 1,036 (-3%) | 1mo | $28,000 | $27 | 69 |
| 69 S Eaglecrest Dr | 0.39mi | 2/2.0 | 994 (-7%) | 3mo | $52,500 | $53 | 68 |
| 2 Vibernum Dr | 0.04mi | 2/1.0 | 924 (-13%) | 10mo | $26,000 | $28 | 64 |
| 41 S Roxbury Dr | 0.22mi | 3/2.0 (+1) | 924 (-13%) | 3mo | $40,000 | $43 | 60 |
| 32 Brookridge Dr | 0.31mi | 2/1.0 | 924 (-13%) | 2mo | $37,250 | $40 | 58 |
| 10 Vibernum Dr | 0.05mi | 3/1.0 (+1) | 924 (-13%) | 10mo | $23,500 | $25 | 58 |
| 52 Waterview Pkwy | 0.28mi | 3/2.0 (+1) | 924 (-13%) | 3mo | $65,000 | $70 | 58 |
| 32 Waterview Pkwy | 0.24mi | 2/1.0 | 936 (-12%) | 8mo | $25,000 | $27 | 58 |
| 50 S Roxbury Dr | 0.32mi | 3/2.0 (+1) | 924 (-13%) | 6mo | $84,900 | $92 | 53 |
| 147 E Canyon Dr | 0.29mi | 3/1.0 (+1) | 1,182 (+11%) | 8mo | $37,000 | $31 | 52 |
| 38 Foster Ridge Dr | 0.27mi | 3/1.0 (+1) | 1,218 (+14%) | 10mo | $68,000 | $56 | 45 |
Match score weights: distance 35% · size 25% · config 20% · recency 20%. Top-matched comps best support the ARV.
Projected returns pro-forma
-3.0% appreciation · 5.21% rent growth · sell at horizon
- IRR
- 62.5%
- Equity multiple
- 3.89×
- Total profit
- $47,699
- Equity at exit
- $8,797
- IRR
- 67.8%
- Equity multiple
- 8.64×
- Total profit
- $126,234
- Equity at exit
- $5,101
Cash invested: $16,520 (down + closing). Projections, not guarantees.
Landlord ↔ Tenant lean methodology
- Overall (STATE)
- 15 Strongly Tenant-Friendly
- State New York
- 15 Strongly Tenant-Friendly · D+10
- County
- — inherits STATE
- City
- — inherits STATE
ZIP-level market 14075
- Rents YoY
- 5.2%
- Active inventory
- 262
- Price-to-rent
- 3.1×
Monthly cashflow live
- Estimated rent
- $1,593 high interval (Pro) →
- Mortgage (P&I)
- −$309
- Tax from tax record
- −$83 /mo · $997/yr
- Insurance
- −$25
- HOA
- −$0
- Vacancy / Maint / Mgmt
- −$335
- Net cashflow
- $842
Break-even live
UW: 25.0% down · 7.5% · 30yr · 1.5% tax · 5.0% vac · 8.0% maint · 8.0% mgmt
Financing live
Cash to close
- Down payment
- $14,750
- Closing costs
- $1,770
- Reserves months
- —
- Total cash needed
- —
Loan-product check · same deal, 3 products live
Conventional
25% down · 7.5% · 30yr
- Down + closing
- —
- Monthly P&I
- —
- Monthly cashflow
- —
- DSCR
- —
- Eligible?
- —
Personal DTI + credit; lowest rate.
DSCR
20% down · 8.5% · 30yr
- Down + closing
- —
- Monthly P&I
- —
- Monthly cashflow
- —
- DSCR
- —
- Eligible?
- —
No personal income docs; deal must DSCR.
Hard money
10% down · 12.0% · 12mo
- Down + closing
- —
- Monthly P&I
- —
- Monthly cashflow
- —
- DSCR
- —
- Eligible?
- —
Short-term bridge; refi at stabilization.
Rent comps 5 comps
| Address | Beds | Baths | Sqft | Rent | $/sqft | DOM | Units | Dist |
|---|---|---|---|---|---|---|---|---|
| 3580 Sowles Rd Hamburg, NY | 2.0 | 1.0 | 850 | $1,450 | $1.71 | 1d | 1 | 1.21mi |
| 4819 Southwestern Blvd Hamburg, NY | 2.0 | 2.0 | 1170 | $2,055 | $1.76 | 1d | 1 | 1.23mi |
| 4600 Southwestern Blvd Hamburg, NY | 1.0–2.0 | 1.0 | 725 | $1,750 | $2.41 | 1d | 13 | 1.32mi |
| 4779 S Park Ave Hamburg, NY | 2.0 | 2.0–2.5 | 1287 | $1,875 | $1.46 | 1d | 3 | 1.48mi |
| 4591 Southwestern Blvd Hamburg, NY | 1.0–2.0 | 1.0 | 737 | $1,415 | $1.92 | 1d | 12 | 1.48mi |
Listing history 13 events
-
2026-06-18days on market $59,000 Active 17 DOM
-
2026-06-17days on market $59,000 Active 16 DOM
-
2026-06-16days on market $59,000 Active 15 DOM
-
2026-06-15days on market $59,000 Active 14 DOM
-
2026-06-13days on market $59,000 Active 12 DOM
-
2026-06-10days on market $59,000 Active 9 DOM
-
2026-06-09days on market $59,000 Active 8 DOM
-
2026-06-08days on market $59,000 Active 7 DOM
-
2026-06-07days on market $59,000 Active 6 DOM
-
2026-06-05days on market $59,000 Active 3 DOM
-
2026-06-03days on market $59,000 Active 2 DOM
-
2026-06-02remarks 679-char remark
-
2026-06-02$59,000 Active 1 DOM
ⓘ Source: listings_history table (triggers on properties + properties_extension) + one-shot
backfill from property_details.listing_events for pre-trigger history.
Tax reassessment forecast NY · Partial reset (capped growth)
- Current annual tax
- $997 · $83/mo
- Projected year-2 tax
- $997 · $83/mo
- Expected delta
- $0/yr ($0/mo · 0.0%)
ⓘ Screening estimate from a state-policy table — verify with the county assessor before closing.
Climate risk First Street
- Flood 1/10 Low FEMA zone X (unshaded) · 0% chance over 30 yrs
- Wildfire 1/10 Low
- Heat 2/10 Low 7 d/yr ≥93°F today · 16 d/yr by 30 yrs out
- Wind 1/10 Low
- Air quality 4/10 Moderate 4 unhealthy d/yr today · 9 by 30 yrs out
Nearby sold comps map
Loading sold comps map…
Walkable amenities ~0.75 mi
Loading nearby amenities…
Taxation est. · year 1
- Rental income
- $19,121
- − Mortgage interest
- −$3,305
- − Property taxes
- −$997
- − Insurance
- −$295
- − Repairs & maintenance
- −$1,530
- − Management
- −$1,530
- − Depreciation
- −$1,716
- Taxable income
- $9,748
- Est. tax owed @ 24.0%
- −$2,340
- After-tax cash flow
- $7,761/yr
For passive investors: Depreciation is non-cash, so a rental often shows a tax loss while cash-flowing — sheltering income. Rental losses are passive: they offset passive income freely, and up to $25,000/yr can offset ordinary (W-2) income if you actively participate and your MAGI is under $100k (phasing out to $0 by $150k); unused losses carry forward. On sale, claimed depreciation is recaptured at up to 25%, and gains may owe capital-gains tax (a 1031 exchange can defer both). Figures are a year-1 estimate at your 24.0% rate — not tax advice; consult a CPA.
Schools (NCES district)
- District
- Frontier Central School District
- NCES district ID
- 3611670
- Math proficiency
- 54% ▼ -16.00%
- Reading proficiency
- 55% ▼ -10.00%
- Median HH income
- $58,807
- Composite
- 47.36/100
- National rank
- #2291
- State rank
- #301 of 590 in NY
Livability — Blasdell
- Score
- 66/100
- State rank
- #643
- US rank
- #12059
Category grades
Schools grade is shown separately in the Schools card above.
Census & demographics
- County
- Erie County · 714,559 people
- Metro
- Buffalo-Cheektowaga, NY
- Population (ZIP)
- 44,520
- Household income
- $83,383
- Rent vs Own
- Severe rent burden
- 824.0
Population outlook (Erie County) Hauer SSP2
- Today (2025)
- 933,037 people
- By 2030
- 935,181 · +0.2%
- By 2040
- 928,531 · -0.5%
- By 2050
- 905,725 · -2.9%
- By 2075
- 834,037 · -10.6%
- By 2100
- 708,033 · -24.1%
Race, ethnicity, and origin ACS 2023
- Neighborhood character
- Predominantly White (92%)
- Race & ethnicity
- White 92% Two or more races 4% Hispanic / Latino 3% Black 1%
- Common ancestry
- Romanian 20% Lithuanian 2% Slovak 2%
- Foreign-born
- 2% · Canada
- Languages at home
- 97% English-only · Spanish 1% Other Indo-European 1%
Political lean MEDSL · Erie
- 2024 margin
- Lean D (+9.7) · D 54.8% · R 45.2%
- 2008→2024 swing
- -7.9pp toward R · 2008: 17.5pp · 2024: 9.7pp
- All cycles
- 2024: D+9.7 2020: D+14.7 2016: D+4.8 2012: D+15.6 2008: D+17.5
Not yet ingested
- Civics
- —
Market trends
- HPI YoY
- ▼ -261.10%
- Current HPI
- 300.2852
- Rent YoY
- ▲ 5.21%
- Metro
- Buffalo-Cheektowaga, NY
- State GDP YoY
- ▲ 2.60%
- F500 in state
- 92
Industry mix (Fortune 500 HQ in NY)
| Industry | F500 HQs | Revenue |
|---|---|---|
| Financial Services | 10 | $950B |
|
||
| Consumer Goods | 9 | $162B |
|
||
| Insurance | 4 | $225B |
|
||
| Telecommunications | 2 | $144B |
|
||
| Pharmaceuticals | 2 | $112B |
|
||
| Media / Entertainment | 2 | $69B |
|
||
Price history
+18.2% since first listed3 events — show timeline
- 2026-06-01 Listed $59,000 WNYREIS
- 2023-01-24 Listing Removed — WNYREIS
- 2023-01-17 Listed $49,900 WNYREIS
Property tax history
+2.7%/yrLatest (2025): $997 · +3.9% YoY. Source: county tax records.
Cash-flow waterfall
monthlySold comps — $/sqft
last 12 mo · ≤1 miLoading sold comps…