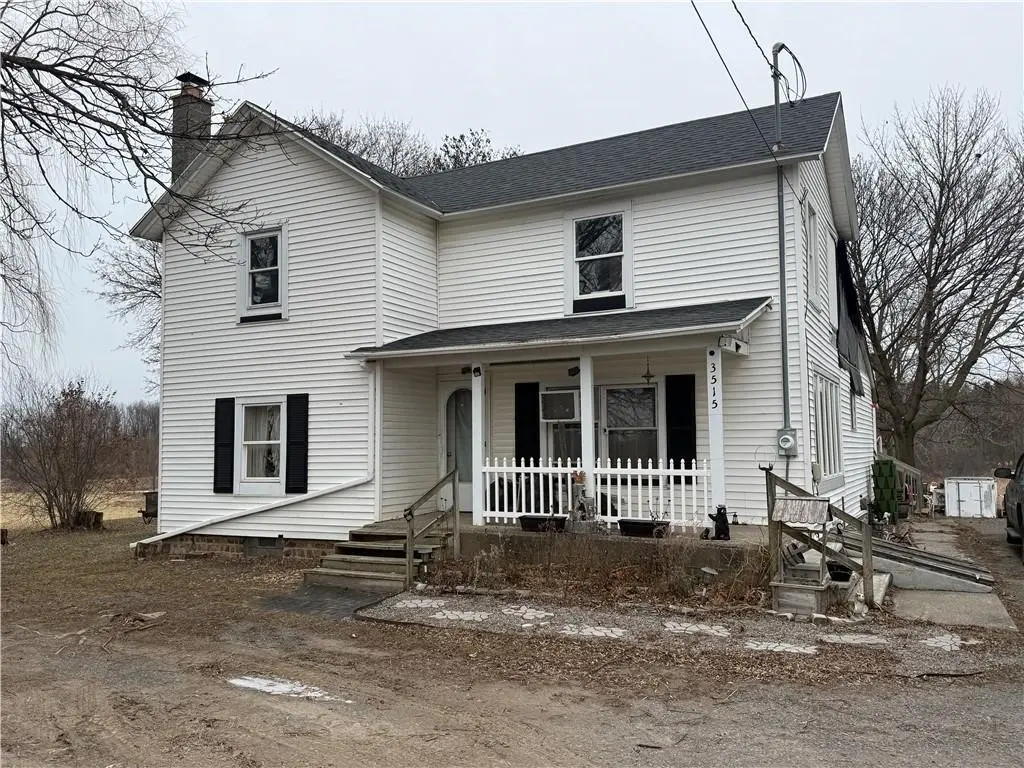
3515 Seneca Castle Rd · Hall, NY
Flood risk 1/10 · Minimal
- FEMA flood zone
- X
- Chance of flooding over 30 yrs
- 0.0%
- Est. flood insurance / yr
- $473 – $860
Fire risk 3/10 · Minor
- Est. fire insurance / yr
- $691 – $1,283
Heat risk 2/10 · Minimal
- Hot days now (above 93°F)
- 7 days/yr
- Hot days in 30 yrs
- 15 days/yr
Wind risk 1/10 · Minimal
- Chance of severe wind over 30 yrs
- —
Air-quality risk 2/10 · Minimal
- Unhealthy air days now
- 0 days/yr
- Unhealthy air days in 30 yrs
- 1 days/yr
Risk factors via First Street. Map © Google.
Why this score? — see what drove the B+ grade
The composite is a weighted blend of 9 inputs, each scored 0–100. Each bar is that input's sub-score; the figure is the points it added to the 100-point composite (weight × sub-score).
- Cash flow +30.0/30.0
- 1% rule +10.0/10.0
- DSCR +10.0/10.0
- ARV discount +7.5/15.0
- Appreciation +7.4/10.0
- Schools +3.4/10.0
- Livability +2.8/5.0
- Rent growth +2.5/5.0
- Condition / age +2.5/5.0
$94,900
🖨 Deal sheet 📄 Offer letter ✓ Due diligence
Listing remarks
So Much Potential! This developed property offers a rare opportunity to rebuild or create your dream home. The former two-story residence (3 bedrooms, 1 full bath, full basement) sustained fire damage, but many components—including windows and other salvageable parts—remain. The level acreage features a pond, a shop/garage, and essential utilities already in place: public water, septic, and electric. Appliances (furnace, hot water heater) are included in as-is condition. Conveniently located halfway between Canandaigua and Geneva in the Marcus Whitman School District, this property combines rural tranquility with easy access to nearby amenities. Bring your vision and make this p
Key facts
- Pond
- Shop garage
- Septic
Tags
Property features AI
Exterior
- Parking: No garage
- Utilities: Public water connected; Septic tank; Electric water heater
- Home design: Two-story frame home with vinyl siding; Existing (previously built) property
- Construction: Stone foundation; Asphalt roof; Frame construction with vinyl siding; Built as existing structure
- Exterior features: Dirt driveway; Leased propane tank; Rural setting; Rectangular lot (approx. 1.7 acres, 250 x 299)
Interior
- Kitchen: Eat-in kitchen
- Bedrooms: One main-level bedroom
- Flooring: Carpet; Hardwood; Laminate; Mixed/varies
- Bathrooms: One full bathroom (main level)
- Heating & cooling: Propane forced-air heating
- Interior features: Eat-in kitchen; Bedroom on main level; Full basement
- Laundry & utility: Electric water heater
Neighborhood map
What this means for you Summary
Snapshot
- This is a 3-bed/1.0-bath single-family listed at $95k.
Deal economics
- At list price, monthly cash flow is $532 ($6k/yr) — positive.
- The deal already cash-flows at list — no discount required.
- Meets the 1% rule at list price ($2k rent vs $95k).
- Recommended offer: $92k (3.0% below list) — sets the bar for market timing.
Location & tenants
- Location reads 55/100 on livability (#1,131 in NY) — a working-class tenant base; expect higher turnover. Strengths: cost of living A+, housing A; Watch: employment D+, health & safety D, schools F.
- Gorham-Middlesex Central School District (Marcus Whitman) (rural): math 36% / reading 42% proficiency, ranked #519 of 590 in NY (top 88%) — families likely to look elsewhere, expect single-tenant / working-renter base with shorter leases.
- Market conditions: 8 active listings in the ZIP; 284 units permitted in Ontario County in 2024 (69 in 5+ unit buildings).
Forward outlook
- In year one you build about $5k of equity ($656 loan paydown + $5k appreciation (4.8% local appreciation)).
- Ontario County population projected to shrink 6% by 2050 — rents likely to lag national; underwrite the cash flow, not the appreciation.
- At projected returns (4.8% appreciation + 3.0% rent growth), your $27k cash investment doubles in ~3 years — after that, you're playing with house money.
- By year 7, paydown + projected appreciation supports a ~$33k cash-out refi (75% LTV) — recoverable capital for the next deal without selling this one.
Negotiation context
- It's been on market 31 days — a 3% lower offer ($92k) is reasonable based on typical stale-listing flexibility.
- 3 sale attempts with the ask held roughly flat each time — persistent listings suggest the price (not the market) is what's stuck; bring a comps-based counter.
Risks & watch-outs
- Watch-outs: property tax is 2.5% of price; built in 1890 — expect roof / HVAC / electrical / plumbing capex.
Questions for the listing agent
- It's been on market 31 days. Have you received any prior offers? Is the seller open to a 3% concession, seller financing, or rate buy-down credit?
- Built in 1890 — when were the roof, HVAC, electrical panel, plumbing, and water heater last replaced?
- Property tax is high relative to price — has the assessment been appealed recently, and will the sale trigger a re-assessment?
- Is there a deadline driving the sale (1031 exchange, divorce, estate, relocation)? That informs how much negotiation room exists.
- Schools are F-rated, which usually means shorter tenancies and higher turnover. Who's the typical renter profile here, and what's been the actual vacancy rate?
- Crime grade is F in this area — have there been break-ins, vandalism, or insurance claims at this property in the last 3 years? What carrier currently insures it and at what premium?
- What's the average days-on-market for RENTAL listings here right now (not sales)? A rising rental-DOM trend means longer vacancies and softer asking-rent achievability than the comps imply.
- What's the recent tenant-quality profile in this submarket — average credit score on applications, eviction rate, late-payment / NSF rate, and stable-employment percentage? A property-management company in the area should have these aggregated.
- How much new for-sale + rental construction is in the pipeline within 1–3 miles? Heavy new supply typically softens prices + rents 12–24 months out; constrained supply supports both.
Investment metrics
- 1% rule
- 1.69% ✓
- Cap rate
- 13.02%
- Cash-on-cash
- 24.02%
- DSCR
- 2.07
- GRM
- 4.9
CMA / ARV
No comps found within radius.
Projected returns pro-forma
4.79% appreciation · 3.0% rent growth · sell at horizon
- IRR
- 33.5%
- Equity multiple
- 3.06×
- Total profit
- $54,695
- Equity at exit
- $52,583
- IRR
- 32.1%
- Equity multiple
- 6.15×
- Total profit
- $136,759
- Equity at exit
- $89,778
Cash invested: $26,572 (down + closing). Projections, not guarantees.
Landlord ↔ Tenant lean methodology
- Overall (STATE)
- 15 Strongly Tenant-Friendly
- State New York
- 15 Strongly Tenant-Friendly · D+10
- County
- — inherits STATE
- City
- — inherits STATE
ZIP-level market 14561
- Home prices YoY
- 1.7%
- Active inventory
- 8
- Price-to-rent
- 4.9×
Monthly cashflow live
- Estimated rent
- $1,604 medium interval (Pro) →
- Mortgage (P&I)
- −$498
- Tax from tax record
- −$198 /mo · $2,375/yr
- Insurance
- −$40
- HOA
- −$0
- Vacancy / Maint / Mgmt
- −$337
- Net cashflow
- $532
Break-even live
UW: 25.0% down · 7.5% · 30yr · 1.5% tax · 5.0% vac · 8.0% maint · 8.0% mgmt
Financing live
Cash to close
- Down payment
- $23,725
- Closing costs
- $2,847
- Reserves months
- —
- Total cash needed
- —
Loan-product check · same deal, 3 products live
Conventional
25% down · 7.5% · 30yr
- Down + closing
- —
- Monthly P&I
- —
- Monthly cashflow
- —
- DSCR
- —
- Eligible?
- —
Personal DTI + credit; lowest rate.
DSCR
20% down · 8.5% · 30yr
- Down + closing
- —
- Monthly P&I
- —
- Monthly cashflow
- —
- DSCR
- —
- Eligible?
- —
No personal income docs; deal must DSCR.
Hard money
10% down · 12.0% · 12mo
- Down + closing
- —
- Monthly P&I
- —
- Monthly cashflow
- —
- DSCR
- —
- Eligible?
- —
Short-term bridge; refi at stabilization.
Listing history 23 events
-
2026-06-18days on market $94,900 Active 31 DOM
-
2026-06-17days on market $94,900 Active 30 DOM
-
2026-06-16days on market $94,900 Active 29 DOM
-
2026-06-15days on market $94,900 Active 28 DOM
-
2026-06-13days on market $94,900 Active 26 DOM
-
2026-06-10days on market $94,900 Active 23 DOM
-
2026-06-09days on market $94,900 Active 22 DOM
-
2026-06-09days on market $94,900 Active 21 DOM
-
2026-06-07days on market $94,900 Active 20 DOM
-
2026-06-05days on market $94,900 Active 17 DOM
-
2026-06-03days on market $94,900 Active 16 DOM
-
2026-06-03days on market $94,900 Active 15 DOM
-
2026-06-01days on market $94,900 Active 14 DOM
-
2026-05-31days on market $94,900 Active 13 DOM
-
2026-05-18$94,900 Active
-
2026-04-27historical
-
2026-01-14historical
-
2026-01-10historical
-
2026-01-09historical
-
2025-12-27$94,900 Active
-
2025-12-27$94,999 Active
-
2017-11-02soldstatus $100,000
-
2000-05-26soldstatus $21,000
ⓘ Source: listings_history table (triggers on properties + properties_extension) + one-shot
backfill from property_details.listing_events for pre-trigger history.
Tax reassessment forecast NY · Partial reset (capped growth)
- Current annual tax
- $2,375 · $198/mo
- Projected year-2 tax
- $2,375 · $198/mo
- Expected delta
- $0/yr ($0/mo · 0.0%)
ⓘ Screening estimate from a state-policy table — verify with the county assessor before closing.
Climate risk First Street
- Flood 1/10 Low FEMA zone X · 0% chance over 30 yrs
- Wildfire 3/10 Moderate
- Heat 2/10 Low 7 d/yr ≥93°F today · 15 d/yr by 30 yrs out
- Wind 1/10 Low
- Air quality 2/10 Low 0 unhealthy d/yr today · 1 by 30 yrs out
Nearby sold comps map
Loading sold comps map…
Walkable amenities ~0.75 mi
Loading nearby amenities…
Taxation est. · year 1
- Rental income
- $19,245
- − Mortgage interest
- −$5,316
- − Property taxes
- −$2,375
- − Insurance
- −$474
- − Repairs & maintenance
- −$1,540
- − Management
- −$1,540
- − Depreciation
- −$2,761
- Taxable income
- $5,240
- Est. tax owed @ 24.0%
- −$1,258
- After-tax cash flow
- $5,124/yr
For passive investors: Depreciation is non-cash, so a rental often shows a tax loss while cash-flowing — sheltering income. Rental losses are passive: they offset passive income freely, and up to $25,000/yr can offset ordinary (W-2) income if you actively participate and your MAGI is under $100k (phasing out to $0 by $150k); unused losses carry forward. On sale, claimed depreciation is recaptured at up to 25%, and gains may owe capital-gains tax (a 1031 exchange can defer both). Figures are a year-1 estimate at your 24.0% rate — not tax advice; consult a CPA.
Schools (NCES district)
- District
- Gorham-Middlesex Central School District (Marcus Whitman)
- NCES district ID
- 3612300
- Math proficiency
- 36% ▼ -7.00%
- Reading proficiency
- 42% ▲ 2.00%
- Median HH income
- $57,088
- Composite
- 34.33/100
- National rank
- #5233
- State rank
- #519 of 590 in NY
Livability — Hall
- Score
- 55/100
- State rank
- #1131
- US rank
- #23313
Category grades
Schools grade is shown separately in the Schools card above.
Census & demographics
- City population
- 258
- Population (ZIP)
- 2,198
Population outlook (Ontario County) Hauer SSP2
- Today (2025)
- 111,230 people
- By 2030
- 111,401 · +0.2%
- By 2040
- 109,535 · -1.5%
- By 2050
- 104,895 · -5.7%
- By 2075
- 92,999 · -16.4%
- By 2100
- 73,723 · -33.7%
Race, ethnicity, and origin ACS 2023
- Neighborhood character
- Predominantly White (98%)
- Race & ethnicity
- White 98% Two or more races 2%
- Common ancestry
- Romanian 2% Lithuanian 2% Portuguese 2%
- Foreign-born
- 0%
- Languages at home
- 86% English-only · German/W. Germanic 13%
Political lean MEDSL · Ontario
- 2024 margin
- Toss-up / Even · D 49.4% · R 50.6%
- 2008→2024 swing
- -1.0pp toward R · 2008: -0.1pp · 2024: -1.2pp
- All cycles
- 2024: R+1.2 2020: R+0.0 2016: R+8.6 2012: R+1.6 2008: R+0.1
Not yet ingested
- Civics
- —
Market trends
- HPI YoY
- ▲ 4.79%
- Current HPI
- 292.3642
- Rent YoY
- —
- Metro
- —
- State GDP YoY
- ▲ 2.60%
- F500 in state
- 92
Industry mix (Fortune 500 HQ in NY)
| Industry | F500 HQs | Revenue |
|---|---|---|
| Financial Services | 10 | $950B |
|
||
| Consumer Goods | 9 | $162B |
|
||
| Insurance | 4 | $225B |
|
||
| Telecommunications | 2 | $144B |
|
||
| Pharmaceuticals | 2 | $112B |
|
||
| Media / Entertainment | 2 | $69B |
|
||
Price history
+351.9% since first listed9 events — show timeline
- 2026-05-18 Listed $94,900 UNYREIS
- 2026-04-27 Listing Removed — UNYREIS
- 2026-01-14 Listing Removed — UNYREIS
- 2026-01-10 Listing Removed — UNYREIS
- 2026-01-09 Listing Removed — UNYREIS
- 2025-12-27 Listed $94,999 UNYREIS
- 2025-12-27 Listed $94,900 UNYREIS
- 2017-11-02 Sold (Public Records) $100,000 Public Records
- 2000-05-26 Sold (Public Records) $21,000 Public Records
Property tax history
+4.1%/yrLatest (2025): $2,375 · +2.0% YoY. Source: county tax records.
Cash-flow waterfall
monthlySold comps — $/sqft
last 12 mo · ≤1 miLoading sold comps…