 13-Plex
7105 NE 4 Ct · Miami, FL
Flood risk 5/10 · Moderate
- FEMA flood zone
- X (unshaded)
- Chance of flooding over 30 yrs
- 0.24%
- Est. flood insurance / yr
- $507 – $1,088
Fire risk 1/10 · Minimal
- Est. fire insurance / yr
- $947 – $1,759
Heat risk 10/10 · Severe
- Hot days now (above 103°F)
- 7 days/yr
- Hot days in 30 yrs
- 28 days/yr
Wind risk 10/10 · Severe
- Chance of severe wind over 30 yrs
- 99.0%
Air-quality risk 2/10 · Minimal
- Unhealthy air days now
- 1 days/yr
- Unhealthy air days in 30 yrs
- 1 days/yr
Risk factors via First Street. Map © Google.
Why this score? — see what drove the C- grade
The composite is a weighted blend of 9 inputs, each scored 0–100. Each bar is that input's sub-score; the figure is the points it added to the 100-point composite (weight × sub-score).
- Cash flow +17.7/30.0
- ARV discount +7.5/15.0
- DSCR +5.5/10.0
- 1% rule +4.8/10.0
- Schools +4.2/10.0
- Condition / age +4.0/5.0
- Livability +3.9/5.0
- Rent growth +2.6/5.0
- Appreciation +0.0/10.0
$4,487,617
🖨 Deal sheet 📄 Offer letter ✓ Due diligence
Multi-family units
County records classify this as Multi-Family (2-4 Unit). Listing-text estimate: 13 units. estimate disagrees with records
Listing remarks
Rare investment opportunity you don’t want to miss! This offering includes the entire project of four townhouses (7101–7107 NE 4th Ct) being sold together as a complete multifamily asset. Perfect for investors seeking strong cash flow and long-term appreciation in a low-density product highly desirable to today’s renters. Properties like this rarely come to market as a package. For more details, financials, and additional information, please contact the listing agent directly.
Key facts
- 4 parking spots
- Built 2021
- Listed 79 days
Property features AI
Finance
- Financial info: Multiple units producing rental income (example rents listed: $5,000 and $4,750 for unit types); Some units currently leased
- HOA & community: Association fees charged monthly
Exterior
- Parking: Total of 4 parking spaces; Garage parking for units
- Utilities: Cable available
- Home design: 2-story multifamily building; Efficiency units; Some units furnished
- Construction: Block construction; Concrete roof; Effective year built listed
- Exterior features: Less than quarter acre lot
Interior
- Bedrooms: Multiple efficiency units with bedrooms totaling 4 per unit type listed
- Flooring: Concrete
- Bathrooms: Multiple full bathrooms across units (total full baths listed per unit types)
- Heating & cooling: Central heating; Central air conditioning
- Interior features: Concrete flooring
Neighborhood map
What this means for you Summary
Snapshot
- This is a 13 × 3-bed/?-bath units multifamily listed at $4.49M. Condition is rated good.
Deal economics
- At list price, monthly cash flow is $4k ($44k/yr) — positive. Per door: $279/mo.
- The deal already cash-flows at list — no discount required.
- To meet the 1% rule (rent ≥ 1% of price), the offer needs to be $4.38M (2.3% below list).
- Recommended offer: $4.22M (6.0% below list) — sets the bar for market timing.
- Cap rate 7.3% vs local median 1.9% in Miami — top-decile yield for the area; either an underpriced asset or a hidden risk that comps aren't pricing in. Stress-test before assuming the spread holds.
Location & tenants
- Location reads 78/100 on livability (#177 in FL, #2,724 nationally) — a middle-class / working-renter tenant base. Strengths: amenities A+, commute A+, health & safety A+; Watch: employment C-, crime F, cost of living F.
- Miami-Dade (suburban): math 45% / reading 54% proficiency, ranked #40 of 73 in FL (top 55%) — families likely to look elsewhere, expect single-tenant / working-renter base with shorter leases; 64% free/reduced lunch — lower-income household profile, screen leases tightly.
- Market conditions: Rents flat; 368 active listings in the ZIP; solid renter incomes; 10,051 units permitted in Miami-Dade County in 2024 (7,758 in 5+ unit buildings).
- At $43,846/mo this rent would consume 701% of the median local household income ($75k/yr) (locally 2049% of renters already pay >50% of income on rent) — very limited rent-growth headroom before tenants either downsize or default.
Forward outlook
- Local home prices are declining (-3.0%/yr); year-one equity from $31k of loan paydown is wiped out by about $135k of value loss. Plan a longer hold.
- Miami-Dade County population projected at +28% by 2050 — long-run rental-demand tailwind backs the buy-and-hold thesis.
Negotiation context
- It's been on market 79 days — a 6% lower offer ($4.22M) is reasonable based on typical stale-listing flexibility.
- 3 sale attempts since 4y ago with the ask held roughly flat each time — persistent listings suggest the price (not the market) is what's stuck; bring a comps-based counter.
Risks & watch-outs
- Climate carrying-cost: moderate flood risk; severe wind risk, 99% chance of damaging wind over 30y; extreme-heat days projected 7→28/yr by 2055 (HVAC capex compounding) — expect insurance premiums to compound above CPI over the hold.
Questions for the listing agent
- It's been on market 79 days. Have you received any prior offers? Is the seller open to a 6% concession, seller financing, or rate buy-down credit?
- Can we see the unit-by-unit rent roll, current vacancy, and any below-market leases? What's the average tenancy length?
- What capital expenditures (roof, boiler, parking lot, exteriors) have been made in the last 5 years, and what's planned in the next 2?
- Why hasn't it sold? Are there any deal-killer items the seller is aware of (foundation, flood, title, zoning, code violations)?
- Is there a deadline driving the sale (1031 exchange, divorce, estate, relocation)? That informs how much negotiation room exists.
- Schools are B-rated — typically a magnet for longer-tenancy family renters. What's the average tenant stay here, and is there a school-zone premium baked into asking?
- Crime grade is F in this area — have there been break-ins, vandalism, or insurance claims at this property in the last 3 years? What carrier currently insures it and at what premium?
- What's the average days-on-market for RENTAL listings here right now (not sales)? A rising rental-DOM trend means longer vacancies and softer asking-rent achievability than the comps imply.
- What's the recent tenant-quality profile in this submarket — average credit score on applications, eviction rate, late-payment / NSF rate, and stable-employment percentage? A property-management company in the area should have these aggregated.
- How much new apartment / multifamily construction is in the pipeline within 1–3 miles? Heavy new supply (>2% of stock underway) typically softens rents 12–24 months out; light construction supports rent growth.
Investment metrics
- 1% rule
- 0.98% ✗
- Cap rate
- 7.26%
- Cash-on-cash
- 3.46%
- DSCR
- 1.15
- GRM
- 8.5
CMA / ARV
No comps found within radius.
Projected returns pro-forma
-3.0% appreciation · 0.33% rent growth · sell at horizon
- IRR
- -13.9%
- Equity multiple
- 0.51×
- Total profit
- $-610,353
- Equity at exit
- $669,118
- IRR
- -10.0%
- Equity multiple
- 0.46×
- Total profit
- $-677,766
- Equity at exit
- $388,007
Cash invested: $1,256,533 (down + closing). Projections, not guarantees.
Landlord ↔ Tenant lean methodology
- Overall (STATE)
- 87 Strongly Landlord-Friendly
- State Florida
- 87 Strongly Landlord-Friendly · R+3
- County
- — inherits STATE
- City
- — inherits STATE
ZIP-level market 33138
- Rents YoY
- 0.3%
- Active inventory
- 368
- Price-to-rent
- 110.9×
Monthly cashflow live
- Estimated rent
- $43,846 medium interval (Pro) →
- Mortgage (P&I)
- −$23,534
- Tax est. 1.5%
- −$5,610 /mo · $67,314/yr
- Insurance
- −$1,870
- HOA
- −$0
- Vacancy / Maint / Mgmt
- −$9,208
- Net cashflow
- $3,625
Break-even live
13-unit breakdown (identical units grouped — click to expand)
| Units | Beds | Baths | Est. rent |
|---|---|---|---|
| 13× units | 3 | — | $43,849 |
| #1 | 3 | — | $3,373 |
| #2 | 3 | — | $3,373 |
| #3 | 3 | — | $3,373 |
| #4 | 3 | — | $3,373 |
| #5 | 3 | — | $3,373 |
| #6 | 3 | — | $3,373 |
| #7 | 3 | — | $3,373 |
| #8 | 3 | — | $3,373 |
| #9 | 3 | — | $3,373 |
| #10 | 3 | — | $3,373 |
| #11 | 3 | — | $3,373 |
| #12 | 3 | — | $3,373 |
| #13 | 3 | — | $3,373 |
| Total (13 units) | $43,846 | ||
UW: 25.0% down · 7.5% · 30yr · 1.5% tax · 5.0% vac · 8.0% maint · 8.0% mgmt
Financing live
Cash to close
- Down payment
- $1,121,904
- Closing costs
- $134,629
- Reserves months
- —
- Total cash needed
- —
Loan-product check · same deal, 3 products live
Conventional
25% down · 7.5% · 30yr
- Down + closing
- —
- Monthly P&I
- —
- Monthly cashflow
- —
- DSCR
- —
- Eligible?
- —
Personal DTI + credit; lowest rate.
DSCR
20% down · 8.5% · 30yr
- Down + closing
- —
- Monthly P&I
- —
- Monthly cashflow
- —
- DSCR
- —
- Eligible?
- —
No personal income docs; deal must DSCR.
Hard money
10% down · 12.0% · 12mo
- Down + closing
- —
- Monthly P&I
- —
- Monthly cashflow
- —
- DSCR
- —
- Eligible?
- —
Short-term bridge; refi at stabilization.
Listing history 18 events
-
2026-06-18days on market $4,487,617 Active 79 DOM
-
2026-06-17days on market $4,487,617 Active 78 DOM
-
2026-06-16days on market $4,487,617 Active 77 DOM
-
2026-06-15days on market $4,487,617 Active 76 DOM
-
2026-06-13days on market $4,487,617 Active 74 DOM
-
2026-06-09days on market $4,487,617 Active 70 DOM
-
2026-06-08days on market $4,487,617 Active 69 DOM
-
2026-06-07days on market $4,487,617 Active 68 DOM
-
2026-06-04days on market $4,487,617 Active 65 DOM
-
2026-06-03days on market $4,487,617 Active 64 DOM
-
2026-06-02days on market $4,487,617 Active 63 DOM
-
2026-06-01days on market $4,487,617 Active 62 DOM
-
2026-05-31days on market $4,487,617 Active 61 DOM
-
2026-03-18historical $5,000
-
2026-03-06$4,487,617 Active
-
2025-08-05$5,000
-
2022-05-10historical
-
2022-04-22$1,450,000 Active
ⓘ Source: listings_history table (triggers on properties + properties_extension) + one-shot
backfill from property_details.listing_events for pre-trigger history.
Climate risk First Street
- Flood 5/10 Major FEMA zone X (unshaded) · 24% chance over 30 yrs
- Wildfire 1/10 Low
- Heat 10/10 Extreme 7 d/yr ≥103°F today · 28 d/yr by 30 yrs out
- Wind 10/10 Extreme 99% chance of damaging wind over 30 yrs
- Air quality 2/10 Low 1 unhealthy d/yr today · 1 by 30 yrs out
Nearby sold comps map
Loading sold comps map…
Walkable amenities ~0.75 mi
Loading nearby amenities…
Taxation est. · year 1
- Rental income
- $526,152
- − Mortgage interest
- −$251,376
- − Property taxes
- −$67,314
- − Insurance
- −$22,438
- − Repairs & maintenance
- −$42,092
- − Management
- −$42,092
- − Depreciation
- −$130,549
- Taxable loss
- −$29,710
- Est. tax savings @ 24.0%
- +$7,130
- After-tax cash flow
- $50,635/yr
For passive investors: Depreciation is non-cash, so a rental often shows a tax loss while cash-flowing — sheltering income. Rental losses are passive: they offset passive income freely, and up to $25,000/yr can offset ordinary (W-2) income if you actively participate and your MAGI is under $100k (phasing out to $0 by $150k); unused losses carry forward. On sale, claimed depreciation is recaptured at up to 25%, and gains may owe capital-gains tax (a 1031 exchange can defer both). Figures are a year-1 estimate at your 24.0% rate — not tax advice; consult a CPA.
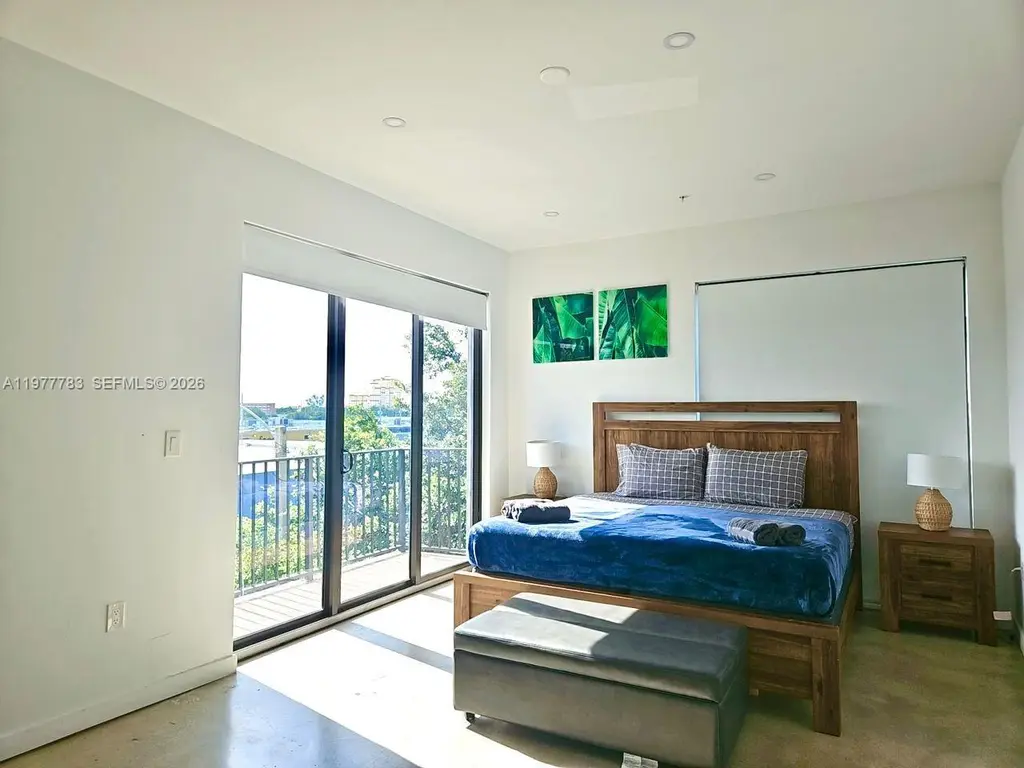
Condition & rehab AI · 14 photos
This multi-family property is in good condition with modern amenities and a well-maintained exterior. It offers a great investment opportunity with potential for value enhancement through minor updates.
Value-add opportunities
- Both Painting the exterior and interior walls — Fresh paint can enhance the curb appeal and interior aesthetics, attracting more buyers and renters.
- Both Updating the flooring in the bathrooms — Replacing old or worn-out flooring with modern materials can improve the overall look and functionality of the bathrooms.
Renovation cost estimate screening
Value-add ROI direction
- Both Painting the exterior and interior walls — Fresh paint can enhance the curb appeal and interior aesthetics, attracting more buyers and renters. ↑
- Both Updating the flooring in the bathrooms — Replacing old or worn-out flooring with modern materials can improve the overall look and functionality of the bathrooms. ↑
ⓘ Cost ranges are severity-bucket heuristics (US national rule-of-thumb). Get contractor quotes + a written scope before underwriting a rehab budget.
Schools (NCES district)
- District
- Miami-Dade
- NCES district ID
- 1200390
- Math proficiency
- 45% ▼ -16.00%
- Reading proficiency
- 54% ▼ -5.00%
- Median HH income
- $43,928
- Composite
- 41.76/100
- National rank
- #3397
- State rank
- #40 of 73 in FL
Livability — Miami
- Score
- 78/100
- State rank
- #177
- US rank
- #2724
Category grades
Schools grade is shown separately in the Schools card above.
Census & demographics
- Census place
- Miami, FL
- County
- Miami-Dade County · 2,697,751 people
- City population
- 827,308
- Metro
- Miami-Fort Lauderdale-Pompano Beach, FL
- Population (ZIP)
- 28,980
- Household income
- $75,051
- Rent vs Own
- Severe rent burden
- 2049.0
Population outlook (Miami-Dade County) Hauer SSP2
- Today (2025)
- 3,126,439 people
- By 2030
- 3,325,765 · +6.4%
- By 2040
- 3,697,561 · +18.3%
- By 2050
- 4,012,134 · +28.3%
- By 2075
- 4,605,612 · +47.3%
- By 2100
- 4,866,598 · +55.7%
Race, ethnicity, and origin ACS 2023
- Neighborhood character
- Highly diverse neighborhood (Simpson 0.70)
- Race & ethnicity
- Hispanic / Latino 36% White 29% Black 29% Two or more races 21% Asian 1%
- Hispanic origin (detail)
- Puerto Rican 3% Cuban 11% Dominican 2% Salvadoran 3%
- Common ancestry
- Hispanic 16% Estonian 2% Lithuanian 2%
- Foreign-born
- 41% · Canada, Jamaica, Dominican Republic
- Languages at home
- 36% English-only · Spanish 39% French/Haitian/Cajun 19% Other Indo-European 4%
Political lean MEDSL · Miami-Dade
- 2024 margin
- R (+11.4) · D 43.9% · R 55.4%
- 2008→2024 swing
- -27.6pp toward R · 2008: 16.1pp · 2024: -11.4pp
- All cycles
- 2024: R+11.4 2020: D+7.3 2016: D+29.6 2012: D+23.7 2008: D+16.1
Not yet ingested
- Civics
- —
Market trends
- HPI YoY
- ▼ -890.01%
- Current HPI
- 551.4791
- Rent YoY
- ▲ 0.33%
- Metro
- Miami-Fort Lauderdale-Pompano Beach, FL
- State GDP YoY
- ▲ 3.28%
- F500 in state
- 36
Industry mix (Fortune 500 HQ in FL)
| Industry | F500 HQs | Revenue |
|---|---|---|
| Industrial Technology | 2 | $29B |
|
||
| Insurance | 2 | $17B |
|
||
| Retail | 1 | $60B |
|
||
| Technology Distribution | 1 | $58B |
|
||
| Homebuilding | 1 | $35B |
|
||
| Technology Manufacturing | 1 | $35B |
|
||
Price history
-99.7% since first listed5 events — show timeline
- 2026-03-18 Rental Removed $5,000 REDFIN
- 2026-03-06 Listed $4,487,617 MARMLS
- 2025-08-05 Listed for Rent $5,000 REDFIN
- 2022-05-10 Listing Removed — MARMLS
- 2022-04-22 Listed $1,450,000 MARMLS
Cash-flow waterfall
monthlySold comps — $/sqft
last 12 mo · ≤1 miLoading sold comps…