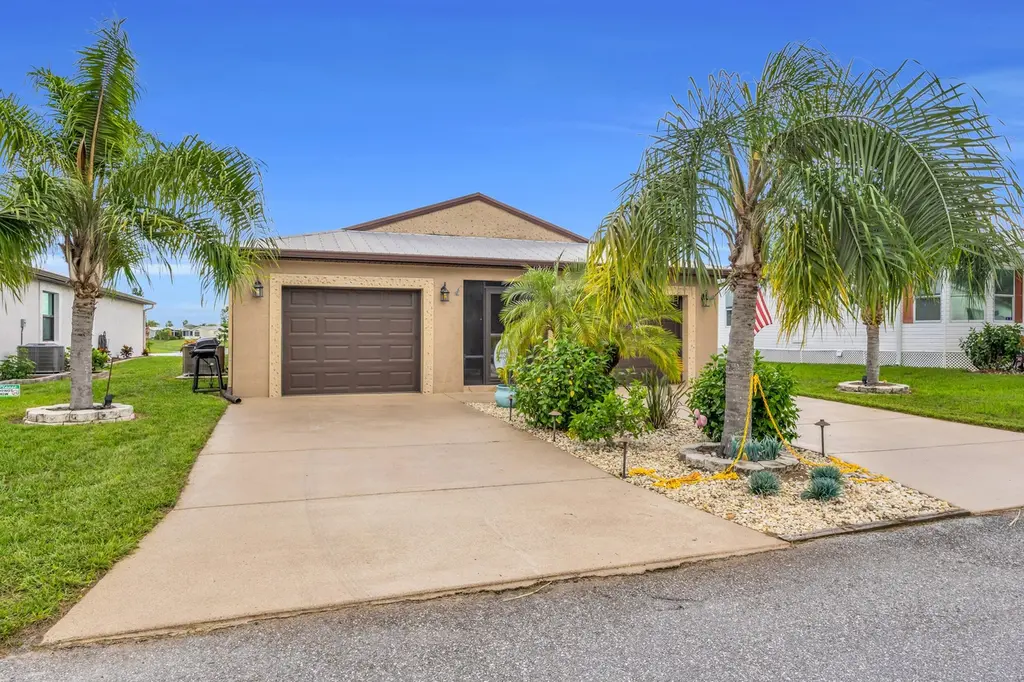
14961 Aguila · Vero Beach South, FL
Flood risk 1/10 · Minimal
- FEMA flood zone
- X (unshaded)
- Chance of flooding over 30 yrs
- 0.0%
- Est. flood insurance / yr
- $507 – $1,088
Fire risk 4/10 · Minor
- Est. fire insurance / yr
- $947 – $1,759
Heat risk 10/10 · Severe
- Hot days now (above 107°F)
- 7 days/yr
- Hot days in 30 yrs
- 23 days/yr
Wind risk 10/10 · Severe
- Chance of severe wind over 30 yrs
- 99.0%
Air-quality risk 1/10 · Minimal
- Unhealthy air days now
- 0 days/yr
- Unhealthy air days in 30 yrs
- 0 days/yr
Risk factors via First Street. Map © Google.
Why this score? — see what drove the C- grade
The composite is a weighted blend of 9 inputs, each scored 0–100. Each bar is that input's sub-score; the figure is the points it added to the 100-point composite (weight × sub-score).
- Cash flow +25.3/30.0
- DSCR +8.3/10.0
- 1% rule +5.7/10.0
- Livability +3.9/5.0
- Schools +3.7/10.0
- Rent growth +2.5/5.0
- Condition / age +2.5/5.0
- ARV discount +2.3/15.0
- Appreciation +0.0/10.0
$224,900
🖨 Deal sheet 📄 Offer letter ✓ Due diligence
Key facts
- 5,663 sq ft lot
- Garage
- Built 2017
Property features AI
Finance
- Financial info: Pets not allowed
- HOA & community: Association fee paid monthly; Senior community
Exterior
- Parking: Attached garage with one garage space (total 2 parking spaces, 1 covered)
- Security: Closed-circuit cameras
- Utilities: Public water; Public sewer; Three-phase electric; Cable available
- Home design: Single-family residence; One story; Resale property; Faces north
- Construction: CBS construction; Metal roof; Built in public-records area of 1,767 living area
- Exterior features: Screened patio; Patio; Waterfront property
Interior
- Kitchen: Dishwasher; Microwave; Electric water heater
- Bedrooms: Three bedrooms on the main level
- Flooring: Carpet; Ceramic tile
- Bathrooms: Two full bathrooms (main level)
- Heating & cooling: Central heating; Central air conditioning
- Interior features: Built-in features; Cathedral and vaulted ceilings; Kitchen island; Walk-in closets; Bedroom layout with stacked rooms
- Laundry & utility: Laundry area inside the home
Neighborhood map
What this means for you Summary
Snapshot
- This is a 3-bed/2.0-bath single-family listed at $225k.
Deal economics
- At list price, monthly cash flow is $508 ($6k/yr) — positive.
- The deal already cash-flows at list — no discount required.
- Meets the 1% rule at list price ($2k rent vs $225k).
- Recommended offer: $218k (3.0% below list) — sets the bar for market timing.
- Cap rate 9.0% vs local median 4.3% in Vero Beach South — top-decile yield for the area; either an underpriced asset or a hidden risk that comps aren't pricing in. Stress-test before assuming the spread holds.
Location & tenants
- Location reads 78/100 on livability (#163 in FL, #2,445 nationally) — a middle-class / working-renter tenant base. Strengths: commute A+, housing A+, health & safety A; Watch: amenities F.
- St. Lucie (urban): math 40% / reading 48% proficiency, ranked #51 of 73 in FL (top 70%) — families likely to look elsewhere, expect single-tenant / working-renter base with shorter leases.
- Zoned schools: Weatherbee Elementary School (math 32% / reading 32%, grade F, #1,797 of 2,144 statewide, top 86%, 672 students, 90% FRL); Dan Mccarty Middle School (math 23% / reading 23%, grade F, #542 of 571 statewide, top 95%, 747 students, 88% FRL); Fort Pierce Westwood Academy The W.E.S.T. Prep Magnet (math 16% / reading 36%, grade F, #494 of 667 statewide, top 75%, 2,010 students, 75% FRL) — zoned schools average 85% FRL vs 59% district-wide (26 pts higher); higher-poverty schools than district average — tighter screening recommended.
- Zoned-school proficiency averages 27% at this address vs 44% district-wide (-17 pts) — the specific schools serving this property underperform the St. Lucie average; the district grade overstates school quality for this exact location.
- Market conditions: 292 active listings in the ZIP; 1 comparable units currently listed for rent nearby; 4,868 units permitted in St. Lucie County in 2024 (268 in 5+ unit buildings).
- At $2,401/mo this rent would consume 46% of the median local household income ($63k/yr) (locally 140% of renters already pay >50% of income on rent) — very limited rent-growth headroom before tenants either downsize or default.
Forward outlook
- Local home prices are declining (-3.0%/yr); year-one equity from $2k of loan paydown is wiped out by about $7k of value loss. Plan a longer hold.
- St. Lucie County population projected at +20% by 2050 — long-run rental-demand tailwind backs the buy-and-hold thesis.
Negotiation context
- It's been on market 36 days — a 3% lower offer ($218k) is reasonable based on typical stale-listing flexibility.
- 4 sale attempts since 2y ago with the ask held roughly flat each time — persistent listings suggest the price (not the market) is what's stuck; bring a comps-based counter.
Risks & watch-outs
- Climate carrying-cost: severe wind risk, 99% chance of damaging wind over 30y; extreme-heat days projected 7→23/yr by 2055 (HVAC capex compounding) — expect insurance premiums to compound above CPI over the hold.
Questions for the listing agent
- It's been on market 36 days. Have you received any prior offers? Is the seller open to a 3% concession, seller financing, or rate buy-down credit?
- Is there a deadline driving the sale (1031 exchange, divorce, estate, relocation)? That informs how much negotiation room exists.
- What's the average days-on-market for RENTAL listings here right now (not sales)? A rising rental-DOM trend means longer vacancies and softer asking-rent achievability than the comps imply.
- What's the recent tenant-quality profile in this submarket — average credit score on applications, eviction rate, late-payment / NSF rate, and stable-employment percentage? A property-management company in the area should have these aggregated.
- How much new for-sale + rental construction is in the pipeline within 1–3 miles? Heavy new supply typically softens prices + rents 12–24 months out; constrained supply supports both.
Investment metrics
- 1% rule
- 1.07% ✓
- Cap rate
- 9.00%
- Cash-on-cash
- 9.67%
- DSCR
- 1.43
- GRM
- 7.8
CMA / ARV
- ARV (on-the-fly)
- $201,438
- Comps found
- 5
Show comp detail 5 sales within ~0.75 mi
| Address | Dist | Beds/Ba | Sqft | Sold | Price | $/sf | Match |
|---|---|---|---|---|---|---|---|
| 6539 Yedra Ave | 0.40mi | 2/2.5 (-1) | 1,839 (+4%) | 2mo | $309,000 | $168 | 65 |
| 6449 Alemendra St | 0.74mi | 3/2.5 | 1,753 (-1%) | 5mo | $309,000 | $176 | 58 |
| 6631 Nuevo Lagos | 0.51mi | 3/2.0 | 1,714 (-3%) | 21mo | $175,000 | $102 | 54 |
| 14374 Azucena Court Ct | 0.55mi | 2/2.0 (-1) | 1,599 (-10%) | 9mo | $175,000 | $109 | 46 |
| 6655 Alemendra St | 0.63mi | 2/2.0 (-1) | 1,530 (-13%) | 2mo | $175,000 | $114 | 42 |
Match score weights: distance 35% · size 25% · config 20% · recency 20%. Top-matched comps best support the ARV.
Projected returns pro-forma
-3.0% appreciation · 3.0% rent growth · sell at horizon
- IRR
- -1.8%
- Equity multiple
- 0.93×
- Total profit
- $-4,183
- Equity at exit
- $33,533
- IRR
- 7.9%
- Equity multiple
- 1.60×
- Total profit
- $37,718
- Equity at exit
- $19,445
Cash invested: $62,972 (down + closing). Projections, not guarantees.
Landlord ↔ Tenant lean methodology
- Overall (STATE)
- 87 Strongly Landlord-Friendly
- State Florida
- 87 Strongly Landlord-Friendly · R+3
- County
- — inherits STATE
- City
- — inherits STATE
ZIP-level market 34951
- Home prices YoY
- -23.6%
- Active inventory
- 292
- Price-to-rent
- 7.8×
Monthly cashflow live
- Estimated rent
- $2,401 medium interval (Pro) →
- Mortgage (P&I)
- −$1,179
- Tax from tax record
- −$116 /mo · $1,396/yr
- Insurance
- −$94
- HOA
- −$0
- Vacancy / Maint / Mgmt
- −$504
- Net cashflow
- $508
Break-even live
UW: 25.0% down · 7.5% · 30yr · 1.5% tax · 5.0% vac · 8.0% maint · 8.0% mgmt
Financing live
Cash to close
- Down payment
- $56,225
- Closing costs
- $6,747
- Reserves months
- —
- Total cash needed
- —
Loan-product check · same deal, 3 products live
Conventional
25% down · 7.5% · 30yr
- Down + closing
- —
- Monthly P&I
- —
- Monthly cashflow
- —
- DSCR
- —
- Eligible?
- —
Personal DTI + credit; lowest rate.
DSCR
20% down · 8.5% · 30yr
- Down + closing
- —
- Monthly P&I
- —
- Monthly cashflow
- —
- DSCR
- —
- Eligible?
- —
No personal income docs; deal must DSCR.
Hard money
10% down · 12.0% · 12mo
- Down + closing
- —
- Monthly P&I
- —
- Monthly cashflow
- —
- DSCR
- —
- Eligible?
- —
Short-term bridge; refi at stabilization.
Rent comps 1 comps
| Address | Beds | Baths | Sqft | Rent | $/sqft | DOM | Units | Dist |
|---|---|---|---|---|---|---|---|---|
| 6765 Spanish Lakes Blvd Fort Pierce, FL | 2.0 | 2.0 | 1368 | $2,500 | $1.83 | 23d | 1 | 0.18mi |
Listing history 28 events
-
2026-06-18days on market $224,900 Active 36 DOM
-
2026-06-17days on market $224,900 Active 35 DOM
-
2026-06-16days on market $224,900 Active 34 DOM
-
2026-06-15days on market $224,900 Active 33 DOM
-
2026-06-14days on market $224,900 Active 31 DOM
-
2026-06-13days on market $224,900 Active 30 DOM
-
2026-06-10days on market $224,900 Active 28 DOM
-
2026-06-09days on market $224,900 Active 27 DOM
-
2026-06-08days on market $224,900 Active 26 DOM
-
2026-06-07days on market $224,900 Active 25 DOM
-
2026-06-05days on market $224,900 Active 22 DOM
-
2026-06-03days on market $224,900 Active 21 DOM
-
2026-06-02days on market $224,900 Active 20 DOM
-
2026-06-01days on market $224,900 Active 19 DOM
-
2026-05-31days on market $224,900 Active 18 DOM
-
2026-05-30days on market $224,900 Active 17 DOM
-
2026-05-09$224,900 Active
-
2026-04-23historical
-
2026-02-28price $227,900
-
2026-01-04price $232,900
-
2025-12-06price $234,900
-
2025-11-13price $239,900
-
2025-10-23$245,000 Active
-
2025-06-04historical
-
2025-02-16price $260,000
-
2025-02-16price $260,000
-
2024-10-17$295,000 Active
-
2024-10-17$295,000 Active
ⓘ Source: listings_history table (triggers on properties + properties_extension) + one-shot
backfill from property_details.listing_events for pre-trigger history.
Tax reassessment forecast FL · Resets to sale price
- Current annual tax
- $1,396 · $116/mo
- Projected year-2 tax
- $1,867 · $156/mo
- Expected delta
- +$471/yr (+$39/mo · 33.7%)
ⓘ Screening estimate from a state-policy table — verify with the county assessor before closing.
Climate risk First Street
- Flood 1/10 Low FEMA zone X (unshaded) · 0% chance over 30 yrs
- Wildfire 4/10 Moderate
- Heat 10/10 Extreme 7 d/yr ≥107°F today · 23 d/yr by 30 yrs out
- Wind 10/10 Extreme 99% chance of damaging wind over 30 yrs
- Air quality 1/10 Low 0 unhealthy d/yr today · 0 by 30 yrs out
Nearby sold comps map
Loading sold comps map…
Walkable amenities ~0.75 mi
Loading nearby amenities…
Taxation est. · year 1
- Rental income
- $28,815
- − Mortgage interest
- −$12,598
- − Property taxes
- −$1,396
- − Insurance
- −$1,124
- − Repairs & maintenance
- −$2,305
- − Management
- −$2,305
- − Depreciation
- −$6,543
- Taxable income
- $2,544
- Est. tax owed @ 24.0%
- −$610
- After-tax cash flow
- $5,480/yr
For passive investors: Depreciation is non-cash, so a rental often shows a tax loss while cash-flowing — sheltering income. Rental losses are passive: they offset passive income freely, and up to $25,000/yr can offset ordinary (W-2) income if you actively participate and your MAGI is under $100k (phasing out to $0 by $150k); unused losses carry forward. On sale, claimed depreciation is recaptured at up to 25%, and gains may owe capital-gains tax (a 1031 exchange can defer both). Figures are a year-1 estimate at your 24.0% rate — not tax advice; consult a CPA.
Schools (NCES district)
- District
- St. Lucie
- NCES district ID
- 1201770
- Math proficiency
- 40% ▼ -11.00%
- Reading proficiency
- 48% ▼ -4.00%
- Median HH income
- $44,737
- Composite
- 37.28/100
- National rank
- #4449
- State rank
- #51 of 73 in FL
Livability — Vero Beach South
- Score
- 78/100
- State rank
- #163
- US rank
- #2445
Category grades
Schools grade is shown separately in the Schools card above.
Census & demographics
- County
- Saint Lucie County · 337,150 people
- Metro
- Port St. Lucie, FL
- Population (ZIP)
- 17,148
- Household income
- $63,122
- Rent vs Own
- Severe rent burden
- 140.0
Population outlook (St. Lucie County) Hauer SSP2
- Today (2025)
- 338,016 people
- By 2030
- 355,687 · +5.2%
- By 2040
- 385,521 · +14.1%
- By 2050
- 406,106 · +20.1%
- By 2075
- 441,054 · +30.5%
- By 2100
- 436,885 · +29.2%
Race, ethnicity, and origin ACS 2023
- Neighborhood character
- Predominantly White (74%)
- Race & ethnicity
- White 74% Black 13% Hispanic / Latino 8% Two or more races 7% Asian 2%
- Hispanic origin (detail)
- Mexican 2% Puerto Rican 2% Cuban 2%
- Common ancestry
- Romanian 3% Italian 2% Lithuanian 2%
- Foreign-born
- 10% · Canada, Jamaica, Vietnam
- Languages at home
- 88% English-only · Spanish 7% French/Haitian/Cajun 3% Vietnamese 1%
Political lean MEDSL · St. Lucie
- 2024 margin
- Lean R (+9.1) · D 45.1% · R 54.2%
- 2008→2024 swing
- -21.2pp toward R · 2008: 12.1pp · 2024: -9.1pp
- All cycles
- 2024: R+9.1 2020: R+1.6 2016: R+2.5 2012: D+7.9 2008: D+12.1
Not yet ingested
- Civics
- —
Market trends
- HPI YoY
- ▼ -106.06%
- Current HPI
- 343.1376
- Rent YoY
- —
- Metro
- Port St. Lucie, FL
- State GDP YoY
- ▲ 3.28%
- F500 in state
- 36
Industry mix (Fortune 500 HQ in FL)
| Industry | F500 HQs | Revenue |
|---|---|---|
| Industrial Technology | 2 | $29B |
|
||
| Insurance | 2 | $17B |
|
||
| Retail | 1 | $60B |
|
||
| Technology Distribution | 1 | $58B |
|
||
| Homebuilding | 1 | $35B |
|
||
| Technology Manufacturing | 1 | $35B |
|
||
Price history
-23.8% since first listed12 events — show timeline
- 2026-05-09 Listed $224,900 Beaches MLS
- 2026-04-23 Listing Removed — Beaches MLS
- 2026-02-28 Price Changed $227,900 Beaches MLS
- 2026-01-04 Price Changed $232,900 Beaches MLS
- 2025-12-06 Price Changed $234,900 Beaches MLS
- 2025-11-13 Price Changed $239,900 Beaches MLS
- 2025-10-23 Listed $245,000 Beaches MLS
- 2025-06-04 Listing Removed — Beaches MLS
- 2025-02-16 Price Changed $260,000 Beaches MLS
- 2025-02-16 Price Changed $260,000 RAIRCMLS
- 2024-10-17 Listed $295,000 RAIRCMLS
- 2024-10-17 Listed $295,000 Beaches MLS
Property tax history
+1.1%/yrLatest (2025): $1,396 · +4.2% YoY. Source: county tax records.
Cash-flow waterfall
monthlySold comps — $/sqft
last 12 mo · ≤1 miLoading sold comps…