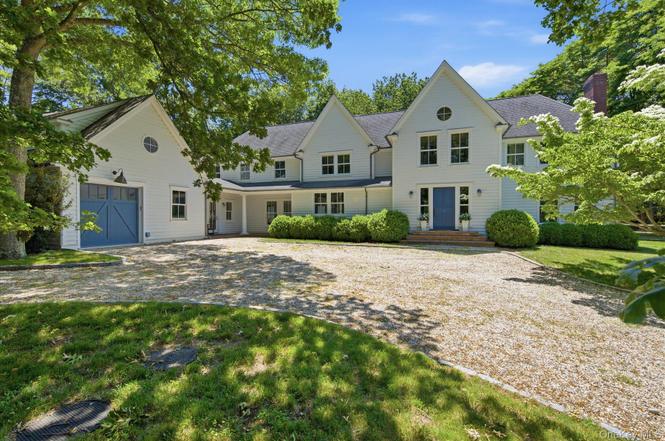
43 Gardiners Bay Dr · Shelter Island, NY
Flood risk No data
- FEMA flood zone
- —
- Chance of flooding over 30 yrs
- —
- Est. flood insurance / yr
- —
Fire risk No data
- Est. fire insurance / yr
- —
Heat risk No data
- Hot days now (above threshold)
- —
- Hot days in 30 yrs
- —
Wind risk No data
- Chance of severe wind over 30 yrs
- —
Air-quality risk No data
- Unhealthy air days now
- —
- Unhealthy air days in 30 yrs
- —
Risk factors via First Street. Map © Google.
Why this score? — see what drove the B+ grade
The composite is a weighted blend of 9 inputs, each scored 0–100. Each bar is that input's sub-score; the figure is the points it added to the 100-point composite (weight × sub-score).
- Cash flow +30.0/30.0
- 1% rule +10.0/10.0
- DSCR +10.0/10.0
- ARV discount +7.5/15.0
- Appreciation +6.0/10.0
- Schools +4.1/10.0
- Livability +3.0/5.0
- Rent growth +2.5/5.0
- Condition / age +2.5/5.0
$3,625,000
🖨 Deal sheet (PDF) 📄 Offer letter ✓ Due diligence
Listing remarks MLS
Shy Acre On A Rise With A Spacious Main House As Well As Separate Guest Cottage With Living Room, Bath & 2Brs. Circular Drive, Oak Floors, Outside Shower, Vaulted Ceilings. Very Close To Beaches, Golf And Country Club. New Roof And 5 Year Old Furnace. An Ideal Summer Get-Away Or Year Round Residence., Additional information: Appearance:Excellent,Separate Hotwater Heater:Y
Key facts
- Firelit living room
- Exquisite millwork
- Light-filled foyer
Tags
Property features AI
Finance
- Other: Living area reported from public records; Additional equipment includes compressor, fuel tank(s), and pool equipment/cover
Exterior
- Parking: Driveway; Garage (1 car)
- Security: Smoke detectors
- Utilities: Electric service by PSEG; Water connected; Sewer via cesspool/septic tank; Propane available; Cable available; Electricity connected
- Home design: Single family residence; Updated/remodeled condition; Two levels; Basement: full, partially finished with walk-out access; Attic access via scuttle
- Construction: Clapboard exterior; Concrete perimeter foundation; Year built/upgrades not specified
- Exterior features: In-ground outdoor pool with cover; Pool equipment and cover provided; Lighting; Playground; Rain gutters; Back yard and front yard landscaping; Corner and interior lot aspects; Level and sloped areas; Private setting with views; Stone/brick wall; Back yard fencing
Interior
- Kitchen: Chef's kitchen with cooktop; Kitchen island; Marble counters; Pantry; Eat-in kitchen; Dishwasher
- Bedrooms: Total rooms include bedrooms on two levels
- Flooring: Hardwood; Ceramic tile; Concrete; Other flooring
- Bathrooms: Four full bathrooms; One half bathroom; Primary bathroom with double vanity and soaking tub
- Heating & cooling: Central air conditioning; Forced air heating; Hot water heating; Oil heating
- Interior features: Built-in features; Cathedral ceilings; Ceiling fans; Chef's kitchen; Double vanity; Eat-in kitchen; Entertainment cabinets; Entrance foyer; High ceilings; Kitchen island; Marble counters; Natural woodwork; Open floorplan; Open kitchen; Pantry; Primary bathroom; Recessed lighting; Soaking tub; Speakers; Walk-in closets; New windows; Window screens; Covered patio and porch
- Laundry & utility: Dedicated laundry room; Washer/dryer hookups (dryer listed); Compressor and fuel tank(s)
Neighborhood map
What this means for you Summary
Snapshot
- This is a 5-bed/4.5-bath single-family listed at $3.62M.
Deal economics
- At list price, monthly cash flow is $34k ($410k/yr) — positive.
- The deal already cash-flows at list — no discount required.
- Meets the 1% rule at list price ($75k rent vs $3.62M).
Location & tenants
- Location reads 60/100 on livability (#998 in NY) — a middle-class / working-renter tenant base. Strengths: crime A+, employment A+; Watch: amenities F, commute F, cost of living F.
- Shelter Island Union Free School District (rural): math 40% / reading 45% proficiency, ranked #546 of 755 in NY (top 72%) — families likely to look elsewhere, expect single-tenant / working-renter base with shorter leases; only 16% free/reduced lunch — higher-income household profile.
- Market conditions: 40 active listings in the ZIP; 1 comparable units currently listed for rent nearby; 1,366 units permitted in Suffolk County in 2024 (216 in 5+ unit buildings).
Forward outlook
- In year one you build about $96k of equity ($25k loan paydown + $71k appreciation (2.0% local appreciation)).
- Suffolk County population projected to shrink 5% by 2050 — rents likely to lag national; underwrite the cash flow, not the appreciation.
- At projected returns (2.0% appreciation + 3.0% rent growth), your $1.01M cash investment doubles in ~2 years — after that, you're playing with house money.
- By year 3, paydown + projected appreciation supports a ~$245k cash-out refi (75% LTV) — recoverable capital for the next deal without selling this one.
Negotiation context
- Only 5 days on market — expect competitive offers; lowballing is unlikely to land.
- 3 sale attempts since 13y ago with the ask held roughly flat each time — persistent listings suggest the price (not the market) is what's stuck; bring a comps-based counter.
- Current owner paid $815k; list at $3.62M implies a 345% gain — meaningful room to come down on a strong offer.
Questions for the listing agent
- Is there a deadline driving the sale (1031 exchange, divorce, estate, relocation)? That informs how much negotiation room exists.
- What's the average days-on-market for RENTAL listings here right now (not sales)? A rising rental-DOM trend means longer vacancies and softer asking-rent achievability than the comps imply.
- What's the recent tenant-quality profile in this submarket — average credit score on applications, eviction rate, late-payment / NSF rate, and stable-employment percentage? A property-management company in the area should have these aggregated.
- How much new for-sale + rental construction is in the pipeline within 1–3 miles? Heavy new supply typically softens prices + rents 12–24 months out; constrained supply supports both.
Investment metrics
- 1% rule
- 2.07% ✓
- Cap rate
- 17.61%
- Cash-on-cash
- 40.43%
- DSCR
- 2.80
- GRM
- 4.0
CMA / ARV
No comps found within radius.
Projected returns pro-forma
1.97% appreciation · 3.0% rent growth · sell at horizon
- IRR
- 44.4%
- Equity multiple
- 3.39×
- Total profit
- $2,422,056
- Equity at exit
- $1,423,705
- IRR
- 45.2%
- Equity multiple
- 6.74×
- Total profit
- $5,823,561
- Equity at exit
- $2,045,489
Cash invested: $1,015,000 (down + closing). Projections, not guarantees.
Landlord ↔ Tenant lean methodology
- Overall (STATE)
- 15 Strongly Tenant-Friendly
- State New York
- 15 Strongly Tenant-Friendly · D+10
- County
- — inherits STATE
- City
- — inherits STATE
ZIP-level market 11964
- Home prices YoY
- 0.4%
- Active inventory
- 40
- Price-to-rent
- 4.0×
Monthly cashflow live
- Estimated rent
- $75,000 medium interval (Pro) →
- Mortgage (P&I)
- −$19,010
- Tax est. 1.5%
- −$4,531 /mo · $54,375/yr
- Insurance
- −$1,510
- HOA
- −$0
- Vacancy / Maint / Mgmt
- −$15,750
- Net cashflow
- $34,198
Break-even live
Sensitivity live
| Price | -10% $36,704 | -5% $35,451 | +0% $34,198 | +5% $32,946 | +10% $31,693 |
|---|---|---|---|---|---|
| Rent | -10% $28,273 | -5% $31,236 | +0% $34,198 | +5% $37,161 | +10% $40,123 |
| Rate | -1.0pp $36,024 | -0.5pp $35,120 | base $34,198 | +0.5pp $33,259 | +1.0pp $32,303 |
UW: 25.0% down · 7.5% · 30yr · 1.5% tax · 5.0% vac · 8.0% maint · 8.0% mgmt
Financing live
Cash to close
- Down payment
- $906,250
- Closing costs
- $108,750
- Reserves months
- —
- Total cash needed
- —
Loan-product check · same deal, 3 products live
Conventional
25% down · 7.5% · 30yr
- Down + closing
- —
- Monthly P&I
- —
- Monthly cashflow
- —
- DSCR
- —
- Eligible?
- —
Personal DTI + credit; lowest rate.
DSCR
20% down · 8.5% · 30yr
- Down + closing
- —
- Monthly P&I
- —
- Monthly cashflow
- —
- DSCR
- —
- Eligible?
- —
No personal income docs; deal must DSCR.
Hard money
10% down · 12.0% · 12mo
- Down + closing
- —
- Monthly P&I
- —
- Monthly cashflow
- —
- DSCR
- —
- Eligible?
- —
Short-term bridge; refi at stabilization.
Rent comps 1 comps
| Address | Beds | Baths | Sqft | Rent | $/sqft | DOM | Units | Dist |
|---|---|---|---|---|---|---|---|---|
| 15 Montclair Ave Shelter Island, NY | 6.0 | 4.5 | 4600 | $75,000 | $16.30 | 23d | 1 | 1.40mi |
Listing history 4 events
-
2026-06-21days on market $3,625,000 Active 5 DOM
-
2026-06-18days on market $3,625,000 Active 2 DOM
-
2026-06-17remarks 687-char remark
-
2026-06-17$3,625,000 Active 1 DOM
ⓘ Source: listings_history table (triggers on properties + properties_extension) + one-shot
backfill from property_details.listing_events for pre-trigger history.
Nearby sold comps map
Loading sold comps map…
Walkable amenities ~0.75 mi
Loading nearby amenities…
Taxation est. · year 1
- Rental income
- $900,000
- − Mortgage interest
- −$203,056
- − Property taxes
- −$54,375
- − Insurance
- −$18,125
- − Repairs & maintenance
- −$72,000
- − Management
- −$72,000
- − Depreciation
- −$105,455
- Taxable income
- $374,989
- Est. tax owed @ 24.0%
- −$89,997
- After-tax cash flow
- $320,384/yr
For passive investors: Depreciation is non-cash, so a rental often shows a tax loss while cash-flowing — sheltering income. Rental losses are passive: they offset passive income freely, and up to $25,000/yr can offset ordinary (W-2) income if you actively participate and your MAGI is under $100k (phasing out to $0 by $150k); unused losses carry forward. On sale, claimed depreciation is recaptured at up to 25%, and gains may owe capital-gains tax (a 1031 exchange can defer both). Figures are a year-1 estimate at your 24.0% rate — not tax advice; consult a CPA.
Schools (NCES district)
- District
- Shelter Island Union Free School District
- NCES district ID
- 3626640
- Math proficiency
- 40% ▼ -15.00%
- Reading proficiency
- 45% ▼ -15.00%
- Median HH income
- $75,456
- Composite
- 41.31/100
- National rank
- #7365
- State rank
- #546 of 755 in NY
Livability — Shelter Island
- Score
- 60/100
- State rank
- #998
- US rank
- #19481
Category grades
Schools grade is shown separately in the Schools card above.
Census & demographics
- Census place
- Shelter Island, NY
- Population (ZIP)
- 2,858
Population outlook (Suffolk County) Hauer SSP2
- Today (2025)
- 1,505,262 people
- By 2030
- 1,498,318 · -0.5%
- By 2040
- 1,471,101 · -2.3%
- By 2050
- 1,424,848 · -5.3%
- By 2075
- 1,337,157 · -11.2%
- By 2100
- 1,217,720 · -19.1%
Race, ethnicity, and origin ACS 2023
- Neighborhood character
- Diverse neighborhood (Simpson 0.57)
- Race & ethnicity
- White 62% Hispanic / Latino 21% Native American 15% Two or more races 7% Asian 6%
- Hispanic origin (detail)
- Mexican 16%
- Common ancestry
- Italian 13% Romanian 5% Portuguese 1%
- Foreign-born
- 15% · Canada
- Languages at home
- 78% English-only · Spanish 18% Other Indo-European 3%
Political lean MEDSL · Suffolk
- 2024 margin
- Lean R (+10.0) · D 45.0% · R 55.0%
- 2008→2024 swing
- -16.0pp toward R · 2008: 6.0pp · 2024: -10.0pp
- All cycles
- 2024: R+10.0 2020: R+0.0 2016: R+8.2 2012: D+2.9 2008: D+6.0
Not yet ingested
- Civics
- —
Market trends
- HPI YoY
- ▲ 1.97%
- Current HPI
- 476.2348
- Rent YoY
- —
- Metro
- —
- State GDP YoY
- ▲ 2.60%
- F500 in state
- 92
Industry mix (Fortune 500 HQ in NY)
| Industry | F500 HQs | Revenue |
|---|---|---|
| Financial Services | 10 | $950B |
|
||
| Consumer Goods | 9 | $162B |
|
||
| Insurance | 4 | $225B |
|
||
| Telecommunications | 2 | $144B |
|
||
| Pharmaceuticals | 2 | $112B |
|
||
| Media / Entertainment | 2 | $69B |
|
||
Price history
+322.0% since first listed7 events — show timeline
- 2026-06-15 Listed $3,625,000 OneKey® MLS as Distributed by MLS Grid
- 2014-04-28 Sold (MLS) $815,000 MLSLI
- 2014-04-28 Sold (MLS) $815,000 OneKey® MLS as Distributed by MLS Grid
- 2014-03-13 Pending — MLSLI
- 2013-10-20 Price Changed $859,000 MLSLI
- 2013-06-06 Listed $885,000 MLSLI
- 2013-06-06 Listed $859,000 OneKey® MLS as Distributed by MLS Grid
Cash-flow waterfall
monthlySold comps — $/sqft
last 12 mo · ≤1 miLoading sold comps…