 Multi-family
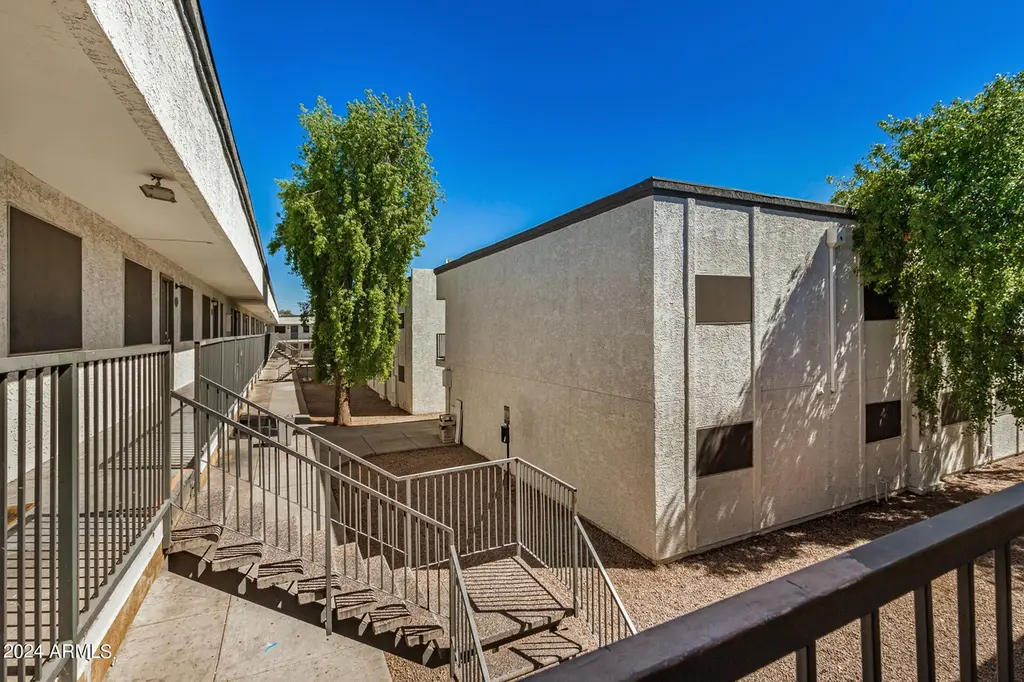
18202 Cave Creek Rd Unit 5 units · Phoenix, AZ
Flood risk 1/10 · Minimal
- FEMA flood zone
- X (shaded)
- Chance of flooding over 30 yrs
- 0.0%
- Est. flood insurance / yr
- $507 – $1,088
Fire risk 4/10 · Minor
- Est. fire insurance / yr
- $610 – $1,132
Heat risk 8/10 · Major
- Hot days now (above 110°F)
- 5 days/yr
- Hot days in 30 yrs
- 14 days/yr
Wind risk 1/10 · Minimal
- Chance of severe wind over 30 yrs
- —
Air-quality risk 3/10 · Minor
- Unhealthy air days now
- 3 days/yr
- Unhealthy air days in 30 yrs
- 5 days/yr
Risk factors via First Street. Map © Google.
Why this score? — see what drove the C grade
The composite is a weighted blend of 9 inputs, each scored 0–100. Each bar is that input's sub-score; the figure is the points it added to the 100-point composite (weight × sub-score).
- Cash flow +26.3/30.0
- DSCR +8.9/10.0
- 1% rule +7.0/10.0
- Condition / age +4.0/5.0
- Schools +3.8/10.0
- Livability +3.8/5.0
- Rent growth +2.1/5.0
- ARV discount +1.1/15.0
- Appreciation +0.0/10.0
$700,000
🖨 Deal sheet 📄 Offer letter ✓ Due diligence
Multi-family units
County records classify this as Multi-Family (2-4 Unit). Listing-text estimate: 1 unit. estimate disagrees with records
Listing remarks MLS
This exclusive property package is perfect for both seasoned investors looking to expand their portfolio and newcomers wanting to start their investment journey. The selection of 5 fully renovated 2 bed (1 bedroom+den) units offers a great opportunity for investors of all levels to enter the real estate market or diversify their existing portfolio. With a strong history of occupancy and the potential to increase rental income, these units provide a stable and reliable income stream. The convenient location and amenities make these units highly desirable for tenants, ensuring a steady flow of rental income for investors. Whether you're just starting out or looking to grow your investment portfolio, this property package offers a smart and lucrative opportunity for investors of all levels.
Key facts
- Convenient location
- 5 parking spots
- Pool
Tags
Neighborhood map
What this means for you Summary
Snapshot
- This is a 5-bed/5.0-bath multifamily listed at $700k. Condition is rated good.
Deal economics
- At list price, monthly cash flow is $2k ($22k/yr) — positive.
- The deal already cash-flows at list — no discount required.
- Meets the 1% rule at list price ($8k rent vs $700k).
- Recommended offer: $616k (12.0% below list) — sets the bar for market timing.
- Cap rate 9.4% vs local median 3.3% in Phoenix — top-decile yield for the area; either an underpriced asset or a hidden risk that comps aren't pricing in. Stress-test before assuming the spread holds.
Location & tenants
- Location reads 75/100 on livability (#16 in AZ, #3,924 nationally) — a middle-class / working-renter tenant base. Strengths: amenities A+, commute A+, housing A+; Watch: health & safety C-, crime F.
- Paradise Valley Unified District (4241) (urban): math 39% / reading 46% proficiency, ranked #56 of 249 in AZ (top 22%) — families likely to look elsewhere, expect single-tenant / working-renter base with shorter leases.
- Market conditions: Rents soft (-1.5%/yr); 337 active listings in the ZIP; 18 comparable units currently listed for rent nearby; rentals at typical pace (median 15d on market — plan ~3-4 weeks tenant-placement turnaround); solid renter incomes; 36,011 units permitted in Maricopa County in 2024 (12,801 in 5+ unit buildings).
- At $8,414/mo this rent would consume 128% of the median local household income ($79k/yr) (locally 2887% of renters already pay >50% of income on rent) — very limited rent-growth headroom before tenants either downsize or default.
Forward outlook
- Local home prices are declining (-3.0%/yr); year-one equity from $5k of loan paydown is wiped out by about $21k of value loss. Plan a longer hold.
- Maricopa County population projected at +38% by 2050 — long-run rental-demand tailwind backs the buy-and-hold thesis.
Negotiation context
- It's been on market 615 days — a 12% lower offer ($616k) is reasonable based on typical stale-listing flexibility.
- 2 sale attempts since 2y ago; this cycle's ask has dropped $125k (15%) from the opening price — seller is motivated, your offer sets the floor, not the list.
Risks & watch-outs
- Climate carrying-cost: extreme-heat days projected 5→14/yr by 2055 (HVAC capex compounding) — expect insurance premiums to compound above CPI over the hold.
Questions for the listing agent
- It's been on market 615 days. Have you received any prior offers? Is the seller open to a 12% concession, seller financing, or rate buy-down credit?
- Why hasn't it sold? Are there any deal-killer items the seller is aware of (foundation, flood, title, zoning, code violations)?
- Is there a deadline driving the sale (1031 exchange, divorce, estate, relocation)? That informs how much negotiation room exists.
- Crime grade is F in this area — have there been break-ins, vandalism, or insurance claims at this property in the last 3 years? What carrier currently insures it and at what premium?
- What's the average days-on-market for RENTAL listings here right now (not sales)? A rising rental-DOM trend means longer vacancies and softer asking-rent achievability than the comps imply.
- What's the recent tenant-quality profile in this submarket — average credit score on applications, eviction rate, late-payment / NSF rate, and stable-employment percentage? A property-management company in the area should have these aggregated.
- How much new apartment / multifamily construction is in the pipeline within 1–3 miles? Heavy new supply (>2% of stock underway) typically softens rents 12–24 months out; light construction supports rent growth.
Investment metrics
- 1% rule
- 1.20% ✓
- Cap rate
- 9.39%
- Cash-on-cash
- 11.08%
- DSCR
- 1.49
- GRM
- 6.9
CMA / ARV
- ARV (median comp)
- $613,353
- List price
- $700,000
- Delta
- 14.13%
- Verdict
- OVERPRICED
- Comps
- 2 within 2.0 mi
Projected returns pro-forma
-3.0% appreciation · 0.0% rent growth · sell at horizon
- IRR
- -3.2%
- Equity multiple
- 0.88×
- Total profit
- $-22,712
- Equity at exit
- $104,372
- IRR
- 2.8%
- Equity multiple
- 1.17×
- Total profit
- $33,846
- Equity at exit
- $60,523
Cash invested: $196,000 (down + closing). Projections, not guarantees.
Landlord ↔ Tenant lean methodology
- Overall (STATE)
- 87 Strongly Landlord-Friendly
- State Arizona
- 87 Strongly Landlord-Friendly · R+3
- County
- — inherits STATE
- City
- — inherits STATE
ZIP-level market 85032
- Rents YoY
- -1.5%
- Active inventory
- 337
- Price-to-rent
- 33.4×
Monthly cashflow live
- Estimated rent
- $8,414 high interval (Pro) →
- Mortgage (P&I)
- −$3,671
- Tax est. 1.5%
- −$875 /mo · $10,500/yr
- Insurance
- −$292
- HOA
- −$0
- Vacancy / Maint / Mgmt
- −$1,767
- Net cashflow
- $1,810
Break-even live
5-unit breakdown (identical units grouped — click to expand)
| Units | Beds | Baths | Est. rent |
|---|---|---|---|
| 4× units | 2 | 1 | $6,984 |
| #1 | 2 | 1 | $1,746 |
| #2 | 2 | 1 | $1,746 |
| #3 | 2 | 1 | $1,746 |
| #4 | 2 | 1 | $1,746 |
| 1× unit | 1 | 1 | $1,429 |
| Total (5 units) | $8,414 | ||
UW: 25.0% down · 7.5% · 30yr · 1.5% tax · 5.0% vac · 8.0% maint · 8.0% mgmt
Financing live
Cash to close
- Down payment
- $175,000
- Closing costs
- $21,000
- Reserves months
- —
- Total cash needed
- —
Loan-product check · same deal, 3 products live
Conventional
25% down · 7.5% · 30yr
- Down + closing
- —
- Monthly P&I
- —
- Monthly cashflow
- —
- DSCR
- —
- Eligible?
- —
Personal DTI + credit; lowest rate.
DSCR
20% down · 8.5% · 30yr
- Down + closing
- —
- Monthly P&I
- —
- Monthly cashflow
- —
- DSCR
- —
- Eligible?
- —
No personal income docs; deal must DSCR.
Hard money
10% down · 12.0% · 12mo
- Down + closing
- —
- Monthly P&I
- —
- Monthly cashflow
- —
- DSCR
- —
- Eligible?
- —
Short-term bridge; refi at stabilization.
Rent comps 18 comps
| Address | Beds | Baths | Sqft | Rent | $/sqft | DOM | Units | Dist |
|---|---|---|---|---|---|---|---|---|
| 17833 N 26th St Phoenix, AZ | 4.0 | 2.0 | 1220 | $2,397 | $1.96 | 1d | 1 | 0.39mi |
| 1935 E Campo Bello Dr Phoenix, AZ | 5.0 | 2.0 | 1904 | $2,395 | $1.26 | 24d | 1 | 0.73mi |
| 18626 N 29th Pl Phoenix, AZ | 4.0 | 2.0 | 1600 | $2,995 | $1.87 | 8d | 1 | 0.77mi |
| 17640 N 17th St Phoenix, AZ | 4.0 | 2.5 | 2352 | $2,800 | $1.19 | 24d | 1 | 0.86mi |
| 19460 N 27th Pl Phoenix, AZ | 4.0 | 2.0 | 1598 | $3,300 | $2.07 | 44d | 1 | 0.91mi |
| 19532 N 27th Pl Phoenix, AZ | 5.0 | 3.5 | 2033 | $3,200 | $1.57 | 15d | 1 | 0.97mi |
| 18031 N 15th Pl Phoenix, AZ | 4.0 | 2.5 | 2329 | $3,500 | $1.50 | 3d | 1 | 0.97mi |
| 2104 E Behrend Dr Phoenix, AZ | 4.0 | 2.5 | 2070 | $2,975 | $1.44 | 3d | 1 | 1.01mi |
| 17226 N 17th St Phoenix, AZ | 4.0 | 2.0 | 2650 | $2,600 | $0.98 | 5d | 1 | 1.02mi |
| 1510 E Charleston Ave Phoenix, AZ | 4.0 | 2.5 | 2329 | $2,795 | $1.20 | 8d | 1 | 1.03mi |
| 2022 E Wahalla Ln Phoenix, AZ | 5.0 | 3.0 | 2178 | $3,500 | $1.61 | 24d | 1 | 1.10mi |
| 19246 N 31st St Phoenix, AZ | 4.0 | 2.0 | 1370 | $2,375 | $1.73 | 8d | 1 | 1.17mi |
| 20053 N 21st Pl Phoenix, AZ | 4.0 | 2.0 | 1754 | $3,300 | $1.88 | 24d | 1 | 1.20mi |
| 16227 N 21st St Phoenix, AZ | 5.0 | 3.0 | 2600 | $2,949 | $1.13 | 15d | 1 | 1.24mi |
| 2220 E Beardsley Rd Phoenix, AZ | 4.0 | 1.0–2.0 | 855 | $2,233 | $2.61 | 3d | 62 | 1.27mi |
| 1615 E Aire Libre Ave Phoenix, AZ | 4.0 | 2.5 | 2500 | $2,400 | $0.96 | 24d | 1 | 1.38mi |
| 16825 N 14th St #49 Phoenix, AZ | 4.0 | 3.0 | 1787 | $2,175 | $1.22 | 4d | 1 | 1.47mi |
| 2248 E Ottawa Ln Phoenix, AZ | 5.0 | 4.5 | 3063 | $4,000 | $1.31 | 44d | 1 | 1.50mi |
Listing history 19 events
-
2026-06-18days on market $700,000 Active 615 DOM
-
2026-06-17days on market $700,000 Active 614 DOM
-
2026-06-16days on market $700,000 Active 613 DOM
-
2026-06-15days on market $700,000 Active 612 DOM
-
2026-06-13days on market $700,000 Active 610 DOM
-
2026-06-13days on market $700,000 Active 609 DOM
-
2026-06-09days on market $700,000 Active 606 DOM
-
2026-06-08days on market $700,000 Active 605 DOM
-
2026-06-07days on market $700,000 Active 604 DOM
-
2026-06-04days on market $700,000 Active 601 DOM
-
2026-06-03days on market $700,000 Active 600 DOM
-
2026-06-02days on market $700,000 Active 599 DOM
-
2026-06-01days on market $700,000 Active 598 DOM
-
2026-05-31days on market $700,000 Active 597 DOM
-
2025-10-10status Active 798-char remark
Show marketing remark (798 chars)
This exclusive property package is perfect for both seasoned investors looking to expand their portfolio and newcomers wanting to start their investment journey. The selection of 5 fully renovated 2 bed (1 bedroom+den) units offers a great opportunity for investors of all levels to enter the real estate market or diversify their existing portfolio. With a strong history of occupancy and the potential to increase rental income, these units provide a stable and reliable income stream. The convenient location and amenities make these units highly desirable for tenants, ensuring a steady flow of rental income for investors. Whether you're just starting out or looking to grow your investment portfolio, this property package offers a smart and lucrative opportunity for investors of all levels.
-
2025-10-10historical 798-char remark
Show marketing remark (798 chars)
This exclusive property package is perfect for both seasoned investors looking to expand their portfolio and newcomers wanting to start their investment journey. The selection of 5 fully renovated 2 bed (1 bedroom+den) units offers a great opportunity for investors of all levels to enter the real estate market or diversify their existing portfolio. With a strong history of occupancy and the potential to increase rental income, these units provide a stable and reliable income stream. The convenient location and amenities make these units highly desirable for tenants, ensuring a steady flow of rental income for investors. Whether you're just starting out or looking to grow your investment portfolio, this property package offers a smart and lucrative opportunity for investors of all levels.
-
2025-06-13price $700,000 798-char remark
Show marketing remark (798 chars)
This exclusive property package is perfect for both seasoned investors looking to expand their portfolio and newcomers wanting to start their investment journey. The selection of 5 fully renovated 2 bed (1 bedroom+den) units offers a great opportunity for investors of all levels to enter the real estate market or diversify their existing portfolio. With a strong history of occupancy and the potential to increase rental income, these units provide a stable and reliable income stream. The convenient location and amenities make these units highly desirable for tenants, ensuring a steady flow of rental income for investors. Whether you're just starting out or looking to grow your investment portfolio, this property package offers a smart and lucrative opportunity for investors of all levels.
-
2025-03-07price $800,000 798-char remark
Show marketing remark (798 chars)
This exclusive property package is perfect for both seasoned investors looking to expand their portfolio and newcomers wanting to start their investment journey. The selection of 5 fully renovated 2 bed (1 bedroom+den) units offers a great opportunity for investors of all levels to enter the real estate market or diversify their existing portfolio. With a strong history of occupancy and the potential to increase rental income, these units provide a stable and reliable income stream. The convenient location and amenities make these units highly desirable for tenants, ensuring a steady flow of rental income for investors. Whether you're just starting out or looking to grow your investment portfolio, this property package offers a smart and lucrative opportunity for investors of all levels.
-
2024-10-09$825,000 Active 798-char remark
Show marketing remark (798 chars)
This exclusive property package is perfect for both seasoned investors looking to expand their portfolio and newcomers wanting to start their investment journey. The selection of 5 fully renovated 2 bed (1 bedroom+den) units offers a great opportunity for investors of all levels to enter the real estate market or diversify their existing portfolio. With a strong history of occupancy and the potential to increase rental income, these units provide a stable and reliable income stream. The convenient location and amenities make these units highly desirable for tenants, ensuring a steady flow of rental income for investors. Whether you're just starting out or looking to grow your investment portfolio, this property package offers a smart and lucrative opportunity for investors of all levels.
ⓘ Source: listings_history table (triggers on properties + properties_extension) + one-shot
backfill from property_details.listing_events for pre-trigger history.
Climate risk First Street
- Flood 1/10 Low FEMA zone X (shaded) · 0% chance over 30 yrs
- Wildfire 4/10 Moderate
- Heat 8/10 Severe 5 d/yr ≥110°F today · 14 d/yr by 30 yrs out
- Wind 1/10 Low
- Air quality 3/10 Moderate 3 unhealthy d/yr today · 5 by 30 yrs out
Nearby sold comps map
Loading sold comps map…
Walkable amenities ~0.75 mi
Loading nearby amenities…
Taxation est. · year 1
- Rental income
- $100,968
- − Mortgage interest
- −$39,211
- − Property taxes
- −$10,500
- − Insurance
- −$3,500
- − Repairs & maintenance
- −$8,077
- − Management
- −$8,077
- − Depreciation
- −$20,364
- Taxable income
- $11,239
- Est. tax owed @ 24.0%
- −$2,697
- After-tax cash flow
- $19,017/yr
For passive investors: Depreciation is non-cash, so a rental often shows a tax loss while cash-flowing — sheltering income. Rental losses are passive: they offset passive income freely, and up to $25,000/yr can offset ordinary (W-2) income if you actively participate and your MAGI is under $100k (phasing out to $0 by $150k); unused losses carry forward. On sale, claimed depreciation is recaptured at up to 25%, and gains may owe capital-gains tax (a 1031 exchange can defer both). Figures are a year-1 estimate at your 24.0% rate — not tax advice; consult a CPA.
Condition & rehab AI · 13 photos
This multi-family property is in good condition with cosmetic updates needed. It offers a great opportunity for investors looking to diversify their portfolio.
Value-add opportunities
- Both Painting exterior walls — Enhances curb appeal and resale value
- Both Landscaping and curb appeal improvements — Improves curb appeal and rental value
- Both Upgrading window treatments — Enhances curb appeal and rental value
- Both Upgrading flooring in common areas — Enhances curb appeal and rental value
Renovation cost estimate screening
Value-add ROI direction
- Both Painting exterior walls — Enhances curb appeal and resale value ↑
- Both Landscaping and curb appeal improvements — Improves curb appeal and rental value ↑
- Both Upgrading window treatments — Enhances curb appeal and rental value ↑
- Both Upgrading flooring in common areas — Enhances curb appeal and rental value ↑
ⓘ Cost ranges are severity-bucket heuristics (US national rule-of-thumb). Get contractor quotes + a written scope before underwriting a rehab budget.
Schools (NCES district)
- District
- Paradise Valley Unified District (4241)
- NCES district ID
- 0405930
- Math proficiency
- 39% ▼ -11.00%
- Reading proficiency
- 46% ▼ -7.00%
- Median HH income
- $64,106
- Composite
- 37.89/100
- National rank
- #4316
- State rank
- #56 of 249 in AZ
Livability — Phoenix
- Score
- 75/100
- State rank
- #16
- US rank
- #3924
Category grades
Schools grade is shown separately in the Schools card above.
Census & demographics
- Census place
- Phoenix, AZ
- County
- Maricopa County · 4,537,380 people
- City population
- 1,500,198
- Metro
- Phoenix-Mesa-Chandler, AZ
- Population (ZIP)
- 70,839
- Household income
- $78,643
- Rent vs Own
- Severe rent burden
- 2887.0
Population outlook (Maricopa County) Hauer SSP2
- Today (2025)
- 4,979,203 people
- By 2030
- 5,378,229 · +8.0%
- By 2040
- 6,156,598 · +23.6%
- By 2050
- 6,872,376 · +38.0%
- By 2075
- 8,401,270 · +68.7%
- By 2100
- 9,247,439 · +85.7%
Race, ethnicity, and origin ACS 2023
- Neighborhood character
- Diverse neighborhood (Simpson 0.57)
- Race & ethnicity
- White 59% Hispanic / Latino 29% Two or more races 17% Asian 4% Black 3% Native American 2%
- Hispanic origin (detail)
- Mexican 25%
- Common ancestry
- Romanian 2% Slovak 2% Portuguese 2%
- Foreign-born
- 18% · Canada, China
- Languages at home
- 71% English-only · Spanish 21% Russian/Polish/Slavic 2% Other Indo-European 1%
Political lean MEDSL · Maricopa
- 2024 margin
- Toss-up / Even · D 47.7% · R 51.2% · Other 1.1%
- 2008→2024 swing
- +7.1pp toward D · 2008: -10.6pp · 2024: -3.5pp
- All cycles
- 2024: R+3.5 2020: D+2.2 2016: R+3.5 2012: R+12.0 2008: R+10.6
Not yet ingested
- Civics
- —
Market trends
- HPI YoY
- ▼ -488.65%
- Current HPI
- 339.4181
- Rent YoY
- ▼ -1.46%
- Metro
- Phoenix-Mesa-Chandler, AZ
- State GDP YoY
- ▲ 4.54%
- F500 in state
- 20
Industry mix (Fortune 500 HQ in AZ)
| Industry | F500 HQs | Revenue |
|---|---|---|
| Technology | 2 | $13B |
|
||
| Mining / Metals | 1 | $23B |
|
||
| Environmental Services | 1 | $16B |
|
||
| Metals / Steel | 1 | $14B |
|
||
| Technology Distribution | 1 | $9B |
|
||
| Homebuilding | 1 | $8B |
|
||
Price history
-15.2% since first listed5 events — show timeline
- 2025-10-10 Relisted — ARMLS
- 2025-10-10 Listing Removed — ARMLS
- 2025-06-13 Price Changed $700,000 ARMLS
- 2025-03-07 Price Changed $800,000 ARMLS
- 2024-10-09 Listed $825,000 ARMLS
Cash-flow waterfall
monthlySold comps — $/sqft
last 12 mo · ≤1 miLoading sold comps…