0 N Pfister Ave N #3 · Sierra Vista, AZ
Flood risk 1/10 · Minimal
- FEMA flood zone
- X (unshaded)
- Chance of flooding over 30 yrs
- 0.0%
- Est. flood insurance / yr
- $507 – $1,088
Fire risk 7/10 · Major
- Est. fire insurance / yr
- $610 – $1,132
Heat risk 5/10 · Moderate
- Hot days now (above 97°F)
- 7 days/yr
- Hot days in 30 yrs
- 19 days/yr
Wind risk 1/10 · Minimal
- Chance of severe wind over 30 yrs
- —
Air-quality risk 1/10 · Minimal
- Unhealthy air days now
- 0 days/yr
- Unhealthy air days in 30 yrs
- 0 days/yr
Risk factors via First Street. Map © Google.
Why this score? — see what drove the F grade
The composite is a weighted blend of 9 inputs, each scored 0–100. Each bar is that input's sub-score; the figure is the points it added to the 100-point composite (weight × sub-score).
- ARV discount +7.5/15.0
- Livability +4.0/5.0
- Schools +2.9/10.0
- Rent growth +2.5/5.0
- Condition / age +2.2/5.0
- Cash flow +0.0/30.0
- 1% rule +0.0/10.0
- DSCR +0.0/10.0
- Appreciation +0.0/10.0
$450,000
🖨 Deal sheet 📄 Offer letter ✓ Due diligence
Listing remarks MLS
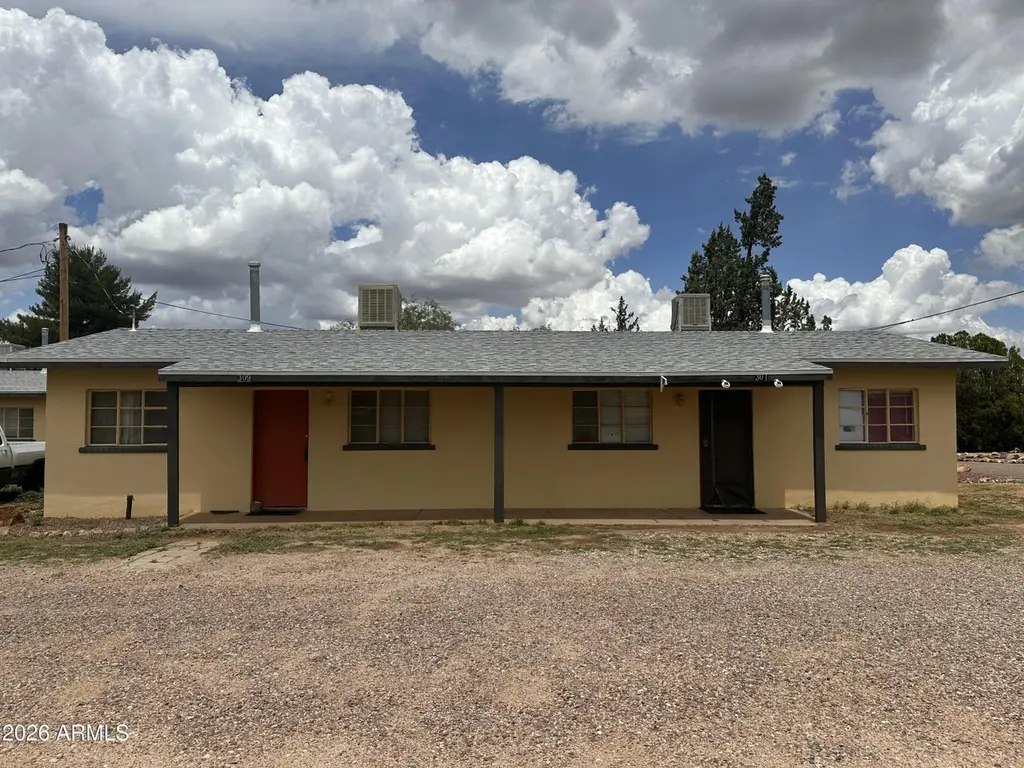
Excellent investment opportunity in Sierra Vista's West End! Three duplexes on a 2/3-acre lot near Ft. Huachuca's main gate. Property includes six 1-bed/1-bath units, approx. 650 sq.ft. each, CBS construction. Features gas heating/cooking, evap cooling, city water, front/rear covered porches, and private off-street parking. Total under-roof: 3,900 sq.ft. Fully occupied with tenants on 6-month leases. Recent gas line upgrades, all coolers serviced, desert landscaping maintained. Quiet area next to Soldier Park. No-pets policy in place. Priced at $450,000 ($115/sq.ft.)!
Key facts
- Gas heating
- Desert landscaping
- Three duplexes
Tags
Neighborhood map
What this means for you Summary
Snapshot
- This is a condo listed at $450k. Condition is rated fair.
Deal economics
- At list price, monthly cash flow is $-2k ($-28k/yr) — negative.
- To cash-flow at today's rent, offer at most $113k (74.8% below list).
- To meet the 1% rule (rent ≥ 1% of price), the offer needs to be $99k (77.9% below list).
- Recommended offer: $99k (77.9% below list) — sets the bar for 1% rule.
- Cap rate 0.1% vs local median 4.3% in Sierra Vista — below-typical yield; the buyer is paying a premium for something (appreciation thesis, condition, location) that the cap rate doesn't capture.
Location & tenants
- Location reads 80/100 on livability (#5 in AZ, #1,805 nationally) — a professional / high-income tenant draw. Strengths: commute A+, housing A+, health & safety A+; Watch: amenities F.
- Sierra Vista Unified District (4175) (urban): math 27% / reading 39% proficiency, ranked #93 of 249 in AZ (top 37%) — families likely to look elsewhere, expect single-tenant / working-renter base with shorter leases.
- Market conditions: Rents flat; 176 active listings in the ZIP; 20 comparable units currently listed for rent nearby; rentals lingering (median 44d on market — plan ~5-8 weeks vacancy on turnover, expect pricing pressure); 60% of comp listings sitting > 30 days — soft ceiling on asking rent; 437 units permitted in Cochise County in 2024 (6 in 5+ unit buildings).
Forward outlook
- Local home prices are declining (-3.0%/yr); year-one equity from $3k of loan paydown is wiped out by about $14k of value loss. Plan a longer hold.
- Cochise County population projected at -30% by 2050 — secular population decline; favor cash flow + early exit over multi-decade hold.
Negotiation context
- It's been on market 92 days — a 9% lower offer ($410k) is reasonable based on typical stale-listing flexibility.
Risks & watch-outs
- Watch-outs: built in 1956 — expect roof / HVAC / electrical / plumbing capex.
- Climate carrying-cost: major wildfire risk; extreme-heat days projected 7→19/yr by 2055 (HVAC capex compounding) — expect insurance premiums to compound above CPI over the hold.
Questions for the listing agent
- What do current leases actually rent for vs. the listed asking? Can we see a recent rent roll and the last 12 months of T-12 income?
- It's been on market 92 days. Have you received any prior offers? Is the seller open to a 78% concession, seller financing, or rate buy-down credit?
- Have any recent inspections been done? Can we get a copy of the seller's disclosures and any deferred-maintenance estimates?
- Built in 1956 — when were the roof, HVAC, electrical panel, plumbing, and water heater last replaced?
- Any open or pending special assessments — roof, HVAC, plumbing, elevator, façade? What's the per-unit balance and payoff schedule, and is the seller paying it off at close or rolling it to the buyer?
- Why hasn't it sold? Are there any deal-killer items the seller is aware of (foundation, flood, title, zoning, code violations)?
- Is there a deadline driving the sale (1031 exchange, divorce, estate, relocation)? That informs how much negotiation room exists.
- The area grade is low — what's the realistic commute time and amenity access for the typical tenant pool here? Any planned neighborhood developments (good or bad) we should know about?
- What's the average days-on-market for RENTAL listings here right now (not sales)? A rising rental-DOM trend means longer vacancies and softer asking-rent achievability than the comps imply.
- What's the recent tenant-quality profile in this submarket — average credit score on applications, eviction rate, late-payment / NSF rate, and stable-employment percentage? A property-management company in the area should have these aggregated.
- How much new apartment / multifamily construction is in the pipeline within 1–3 miles? Heavy new supply (>2% of stock underway) typically softens rents 12–24 months out; light construction supports rent growth.
Investment metrics
- 1% rule
- 0.22% ✗
- Cap rate
- 0.09%
- Cash-on-cash
- -22.15%
- DSCR
- 0.01
- GRM
- 37.8
CMA / ARV
No comps found within radius.
Show comp detail 1 sale within ~0.75 mi
| Address | Dist | Beds/Ba | Sqft | Sold | Price | $/sf | Match |
|---|---|---|---|---|---|---|---|
| 532 Graham Dr #524 | 0.10mi | —/— | — | 9mo | $225,000 | — | 75 |
Match score weights: distance 35% · size 25% · config 20% · recency 20%. Top-matched comps best support the ARV.
Projected returns pro-forma
-3.0% appreciation · 0.0% rent growth · sell at horizon
- IRR
- -66.0%
- Equity multiple
- -0.78×
- Total profit
- $-223,944
- Equity at exit
- $67,096
- IRR
- —
- Equity multiple
- -2.15×
- Total profit
- $-396,928
- Equity at exit
- $38,908
Cash invested: $126,000 (down + closing). Projections, not guarantees.
Landlord ↔ Tenant lean methodology
- Overall (STATE)
- 87 Strongly Landlord-Friendly
- State Arizona
- 87 Strongly Landlord-Friendly · R+3
- County
- — inherits STATE
- City
- — inherits STATE
ZIP-level market 85635
- Home prices YoY
- -32.3%
- Rents YoY
- 0.0%
- Active inventory
- 176
- Price-to-rent
- 37.8×
Monthly cashflow live
- Estimated rent
- $992 high interval (Pro) →
- Mortgage (P&I)
- −$2,360
- Tax est. 1.5%
- −$562 /mo · $6,750/yr
- Insurance
- −$188
- HOA
- −$0
- Vacancy / Maint / Mgmt
- −$208
- Net cashflow
- $-2,326
Break-even live
UW: 25.0% down · 7.5% · 30yr · 1.5% tax · 5.0% vac · 8.0% maint · 8.0% mgmt
Financing live
Cash to close
- Down payment
- $112,500
- Closing costs
- $13,500
- Reserves months
- —
- Total cash needed
- —
Loan-product check · same deal, 3 products live
Conventional
25% down · 7.5% · 30yr
- Down + closing
- —
- Monthly P&I
- —
- Monthly cashflow
- —
- DSCR
- —
- Eligible?
- —
Personal DTI + credit; lowest rate.
DSCR
20% down · 8.5% · 30yr
- Down + closing
- —
- Monthly P&I
- —
- Monthly cashflow
- —
- DSCR
- —
- Eligible?
- —
No personal income docs; deal must DSCR.
Hard money
10% down · 12.0% · 12mo
- Down + closing
- —
- Monthly P&I
- —
- Monthly cashflow
- —
- DSCR
- —
- Eligible?
- —
Short-term bridge; refi at stabilization.
Rent comps 20 comps
| Address | Beds | Baths | Sqft | Rent | $/sqft | DOM | Units | Dist |
|---|---|---|---|---|---|---|---|---|
| 380 Taylor Dr Sierra Vista, AZ | 1.0 | 1.0 | 500 | $715 | $1.43 | 2d | 3 | 0.08mi |
| 604 Graham Dr Sierra Vista, AZ | 3.0 | 2.0 | 1120 | $995 | $0.89 | 44d | 1 | 0.11mi |
| 270 W Tacoma St Sierra Vista, AZ | 3.0 | 2.0 | 1120 | $995 | $0.89 | 44d | 1 | 0.12mi |
| 557 Graham Dr Sierra Vista, AZ | 2.0 | 1.0 | 678 | $900 | $1.33 | 44d | 1 | 0.14mi |
| 540 North Ave Unit A Sierra Vista, AZ | 3.0 | 1.0 | 800 | $950 | $1.19 | 44d | 1 | 0.16mi |
| 250 Carroll Dr Sierra Vista, AZ | 1.0 | 1.0 | 560 | $750 | $1.34 | 44d | 2 | 0.17mi |
| 201 N Garden Ave Sierra Vista, AZ | 1.0 | 1.0 | 645 | $899 | $1.39 | 44d | 1 | 0.23mi |
| 840 Fort Ave Sierra Vista, AZ | 1.0 | 1.0 | 526 | $675 | $1.28 | 2d | 2 | 0.28mi |
| 214 N Canyon Dr Unit 5 Sierra Vista, AZ | 1.0 | 1.0 | 450 | $675 | $1.50 | 44d | 1 | 0.43mi |
| 600 Charles Dr Sierra Vista, AZ | 1.0–2.0 | 1.0 | 637 | $1,589 | $2.49 | 2d | 15 | 0.76mi |
| 499 S Carmichael Ave Sierra Vista, AZ | 3.0–4.0 | 2.0 | 1163 | $1,675 | $1.44 | 2d | 5 | 0.77mi |
| 500 S Carmichael Ave Sierra Vista, AZ | 1.0 | 1.0 | 520 | $790 | $1.52 | 2d | 3 | 0.77mi |
| 420 Camino Mojado Sierra Vista, AZ | 2.0 | 2.0 | 1120 | $1,300 | $1.16 | 44d | 1 | 0.88mi |
| 355 N 7th St Sierra Vista, AZ | 2.0 | 1.0–2.0 | 600 | $965 | $1.61 | 2d | 9 | 0.92mi |
| 555 N 7th St Sierra Vista, AZ | 2.0 | 1.0–2.0 | 521 | $919 | $1.76 | 44d | 1 | 0.97mi |
| 1125 N 7th St Sierra Vista, AZ | 2.0–3.0 | 2.0 | 1000 | $973 | $0.97 | 3d | 1 | 1.00mi |
| 500 S 7th St Sierra Vista, AZ | 3.0 | 2.0 | 924 | $999 | $1.08 | 44d | 1 | 1.08mi |
| 800 S Carmichael Ave Sierra Vista, AZ | 1.0–2.0 | 1.0 | 637 | $965 | $1.51 | 2d | 16 | 1.11mi |
| 1205 Cottonwood Dr Sierra Vista, AZ | 3.0 | 2.0 | 1051 | $1,400 | $1.33 | 44d | 1 | 1.18mi |
| 800 N Lenzner Ave Sierra Vista, AZ | 3.0 | 2.0 | 1050 | $1,070 | $1.02 | 44d | 1 | 1.39mi |
HOA detail condo
- Monthly dues
- $0 · $0/yr
- Likely covers
- watergaslandscaping
- Assessments
- None detected in remarks — confirm with the listing agent.
Listing history 17 events
-
2026-06-19days on market $450,000 Active 92 DOM
-
2026-06-18days on market $450,000 Active 91 DOM
-
2026-06-17days on market $450,000 Active 90 DOM
-
2026-06-16days on market $450,000 Active 89 DOM
-
2026-06-15days on market $450,000 Active 88 DOM
-
2026-06-14days on market $450,000 Active 86 DOM
-
2026-06-12days on market $450,000 Active 85 DOM
-
2026-06-09days on market $450,000 Active 82 DOM
-
2026-06-08days on market $450,000 Active 81 DOM
-
2026-06-07days on market $450,000 Active 80 DOM
-
2026-06-05days on market $450,000 Active 77 DOM
-
2026-06-03days on market $450,000 Active 76 DOM
-
2026-06-02days on market $450,000 Active 75 DOM
-
2026-06-01days on market $450,000 Active 74 DOM
-
2026-05-31days on market $450,000 Active 73 DOM
-
2026-05-30days on market $450,000 Active 72 DOM
-
2026-03-15$450,000 Active 574-char remark
Show marketing remark (574 chars)
Excellent investment opportunity in Sierra Vista's West End! Three duplexes on a 2/3-acre lot near Ft. Huachuca's main gate. Property includes six 1-bed/1-bath units, approx. 650 sq.ft. each, CBS construction. Features gas heating/cooking, evap cooling, city water, front/rear covered porches, and private off-street parking. Total under-roof: 3,900 sq.ft. Fully occupied with tenants on 6-month leases. Recent gas line upgrades, all coolers serviced, desert landscaping maintained. Quiet area next to Soldier Park. No-pets policy in place. Priced at $450,000 ($115/sq.ft.)!
ⓘ Source: listings_history table (triggers on properties + properties_extension) + one-shot
backfill from property_details.listing_events for pre-trigger history.
Climate risk First Street
- Flood 1/10 Low FEMA zone X (unshaded) · 0% chance over 30 yrs
- Wildfire 7/10 Severe
- Heat 5/10 Major 7 d/yr ≥97°F today · 19 d/yr by 30 yrs out
- Wind 1/10 Low
- Air quality 1/10 Low 0 unhealthy d/yr today · 0 by 30 yrs out
Nearby sold comps map
Loading sold comps map…
Walkable amenities ~0.75 mi
Loading nearby amenities…
Taxation est. · year 1
- Rental income
- $11,910
- − Mortgage interest
- −$25,207
- − Property taxes
- −$6,750
- − Insurance
- −$2,250
- − Repairs & maintenance
- −$953
- − Management
- −$953
- − Depreciation
- −$13,091
- Taxable loss
- −$37,294
- Est. tax savings @ 24.0%
- +$8,950
- After-tax cash flow
- $-18,959/yr
For passive investors: Depreciation is non-cash, so a rental often shows a tax loss while cash-flowing — sheltering income. Rental losses are passive: they offset passive income freely, and up to $25,000/yr can offset ordinary (W-2) income if you actively participate and your MAGI is under $100k (phasing out to $0 by $150k); unused losses carry forward. On sale, claimed depreciation is recaptured at up to 25%, and gains may owe capital-gains tax (a 1031 exchange can defer both). Figures are a year-1 estimate at your 24.0% rate — not tax advice; consult a CPA.
Condition & rehab AI · 5 photos
This multi-family property presents as needing moderate repairs and maintenance, with potential for significant value increase through landscaping and fence improvements.
Repairs flagged
- Minor landscaping — Some areas appear dry and could benefit from irrigation
- Minor fencing — Some sections of the fence appear worn
Value-add opportunities
- Both landscaping and irrigation system — Enhances curb appeal and water efficiency
- Both fence repair — Improves property boundary and security
Renovation cost estimate screening
| Repair item | Severity | Est. cost |
|---|---|---|
| landscaping · Some areas appear dry and could benefit from irrigation | Minor | $500–3,000 |
| fencing · Some sections of the fence appear worn | Minor | $500–3,000 |
| Total estimated repair cost · 2 items | $1,000–6,000 |
Value-add ROI direction
- Both landscaping and irrigation system — Enhances curb appeal and water efficiency ↑
- Both fence repair — Improves property boundary and security ↑
ⓘ Cost ranges are severity-bucket heuristics (US national rule-of-thumb). Get contractor quotes + a written scope before underwriting a rehab budget.
Schools (NCES district)
- District
- Sierra Vista Unified District (4175)
- NCES district ID
- 0401460
- Math proficiency
- 27% ▼ -19.00%
- Reading proficiency
- 39% ▼ -10.00%
- Median HH income
- $55,463
- Composite
- 29.17/100
- National rank
- #6573
- State rank
- #93 of 249 in AZ
Livability — Sierra Vista
- Score
- 80/100
- State rank
- #5
- US rank
- #1805
Category grades
Schools grade is shown separately in the Schools card above.
Census & demographics
- Census place
- Sierra Vista, AZ
- County
- Cochise County · 49,069 people
- City population
- 49,069
- Metro
- Sierra Vista-Douglas, AZ
- Population (ZIP)
- 34,193
- Household income
- $61,580
- Rent vs Own
- Severe rent burden
- 1129.0
Population outlook (Cochise County) Hauer SSP2
- Today (2025)
- 113,402 people
- By 2030
- 106,197 · -6.4%
- By 2040
- 92,166 · -18.7%
- By 2050
- 79,805 · -29.6%
- By 2075
- 56,831 · -49.9%
- By 2100
- 35,103 · -69.0%
Race, ethnicity, and origin ACS 2023
- Neighborhood character
- Diverse neighborhood (Simpson 0.60)
- Race & ethnicity
- White 58% Hispanic / Latino 25% Two or more races 17% Black 6% Asian 4%
- Hispanic origin (detail)
- Mexican 19% Puerto Rican 1%
- Common ancestry
- Romanian 3% Lithuanian 3% Italian 2%
- Foreign-born
- 11% · Canada, South Korea
- Languages at home
- 80% English-only · Spanish 14% Korean 2% German/W. Germanic 1%
Political lean MEDSL · Cochise
- 2024 margin
- Strong R (+23.1) · D 37.8% · R 61.0% · Other 1.2%
- 2008→2024 swing
- -2.5pp toward R · 2008: -20.7pp · 2024: -23.1pp
- All cycles
- 2024: R+23.1 2020: R+19.6 2016: R+22.6 2012: R+24.0 2008: R+20.7
Not yet ingested
- Civics
- —
Market trends
- HPI YoY
- ▼ -83.93%
- Current HPI
- 175.5821
- Rent YoY
- ▬ 0.00%
- Metro
- Sierra Vista-Douglas, AZ
- State GDP YoY
- ▲ 4.54%
- F500 in state
- 20
Industry mix (Fortune 500 HQ in AZ)
| Industry | F500 HQs | Revenue |
|---|---|---|
| Technology | 2 | $13B |
|
||
| Mining / Metals | 1 | $23B |
|
||
| Environmental Services | 1 | $16B |
|
||
| Metals / Steel | 1 | $14B |
|
||
| Technology Distribution | 1 | $9B |
|
||
| Homebuilding | 1 | $8B |
|
||
Price history
1 event — show timeline
- 2026-03-15 Listed $450,000 ARMLS
Cash-flow waterfall
monthlySold comps — $/sqft
last 12 mo · ≤1 miLoading sold comps…