 Duplex
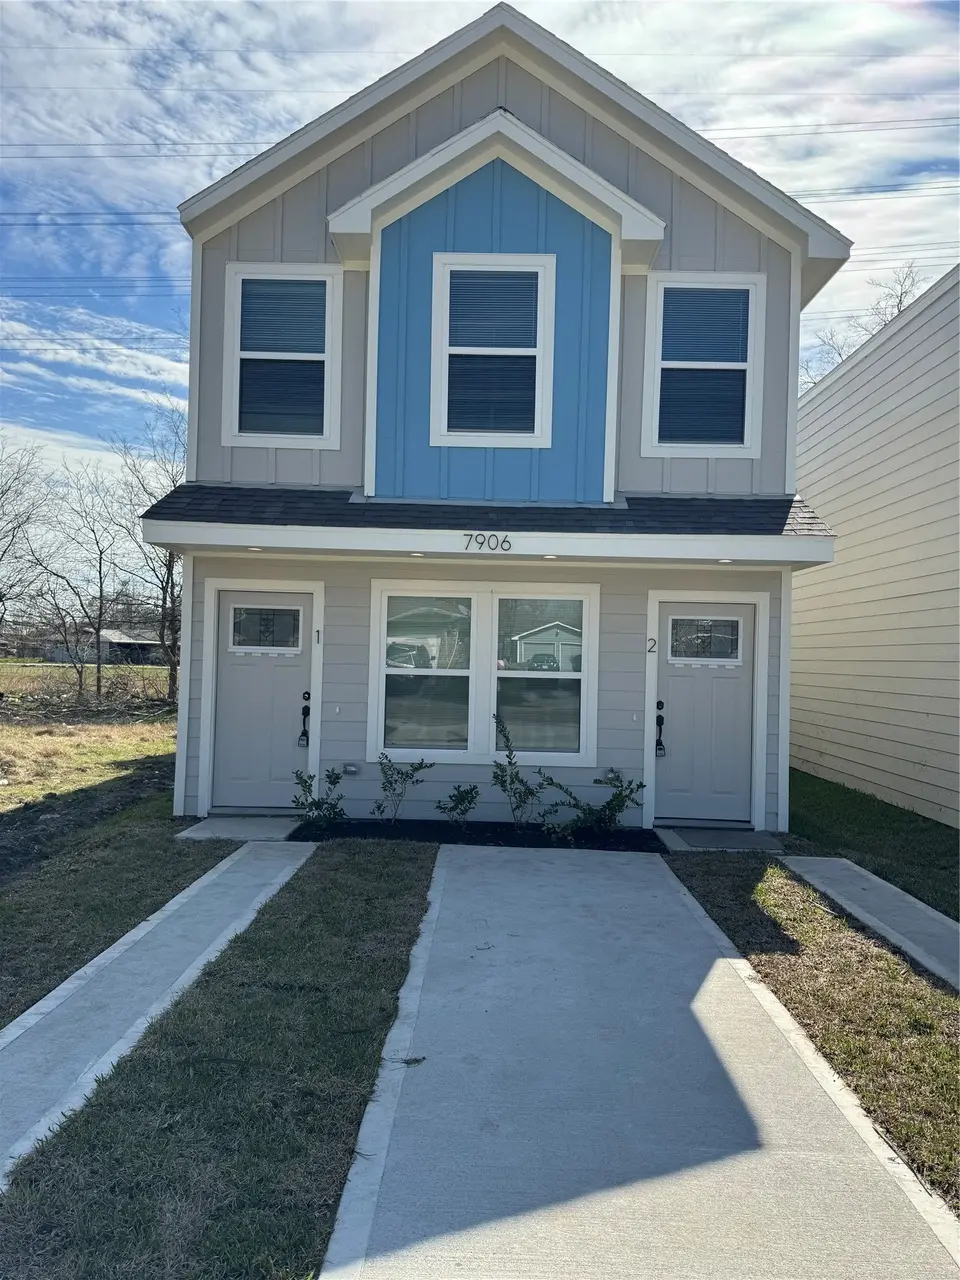
7906 Sexton St · Houston, TX
Flood risk 4/10 · Minor
- FEMA flood zone
- X (unshaded)
- Chance of flooding over 30 yrs
- 0.2%
- Est. flood insurance / yr
- $507 – $1,088
Fire risk 1/10 · Minimal
- Est. fire insurance / yr
- $1,222 – $2,270
Heat risk 9/10 · Severe
- Hot days now (above 110°F)
- 6 days/yr
- Hot days in 30 yrs
- 21 days/yr
Wind risk 9/10 · Severe
- Chance of severe wind over 30 yrs
- 99.0%
Air-quality risk 3/10 · Minor
- Unhealthy air days now
- 2 days/yr
- Unhealthy air days in 30 yrs
- 3 days/yr
Risk factors via First Street. Map © Google.
Why this score? — see what drove the C grade
The composite is a weighted blend of 9 inputs, each scored 0–100. Each bar is that input's sub-score; the figure is the points it added to the 100-point composite (weight × sub-score).
- Cash flow +15.5/30.0
- ARV discount +10.7/15.0
- Appreciation +7.6/10.0
- DSCR +4.8/10.0
- 1% rule +4.6/10.0
- Condition / age +4.0/5.0
- Livability +3.7/5.0
- Schools +2.7/10.0
- Rent growth +2.1/5.0
$399,000
🖨 Deal sheet 📄 Offer letter ✓ Due diligence
Multi-family units
County records classify this as Multi-Family (2-4 Unit). Listing-text estimate: 2 units. confirmed
Listing remarks MLS
Welcome to this stunning 3 bedroom, 2 Bath duplex. Offering modern finished, Features open-concept living area. Beautiful kitchen with soft close cabinets, granite countertops and stainless steel appliances. Close to 610, 59 and hardy toll. Just 15 minutes from downtown Houston.
Key facts
- Soft close cabinets
- Granite countertops
- 2,890 sq ft lot
Tags
Neighborhood map
What this means for you Summary
Snapshot
- This is a 2 × 3-bed/2.0-bath units multifamily listed at $399k. Condition is rated good.
Deal economics
- At list price, monthly cash flow is $159 ($2k/yr) — positive. Per door: $80/mo.
- The deal already cash-flows at list — no discount required.
- To meet the 1% rule (rent ≥ 1% of price), the offer needs to be $382k (4.3% below list).
- Recommended offer: $363k (9.0% below list) — sets the bar for market timing.
- Cap rate 6.8% vs local median 3.2% in Houston — top-decile yield for the area; either an underpriced asset or a hidden risk that comps aren't pricing in. Stress-test before assuming the spread holds.
Location & tenants
- Location reads 74/100 on livability (#184 in TX, #4,771 nationally) — a middle-class / working-renter tenant base. Strengths: amenities A+, cost of living A+, housing A+; Watch: schools D, crime F.
- Houston ISD (urban): math 27% / reading 35% proficiency, ranked #593 of 826 in TX (top 72%) — families likely to look elsewhere, expect single-tenant / working-renter base with shorter leases; 71% free/reduced lunch — lower-income household profile, screen leases tightly.
- Market conditions: Rents soft (-1.6%/yr); 353 active listings in the ZIP; lower-income renter base — watch delinquency; 29,883 units permitted in Harris County in 2024 (8,621 in 5+ unit buildings).
- At $3,817/mo this rent would consume 119% of the median local household income ($38k/yr) (locally 1177% of renters already pay >50% of income on rent) — very limited rent-growth headroom before tenants either downsize or default.
Forward outlook
- In year one you build about $24k of equity ($3k loan paydown + $21k appreciation (5.2% local appreciation)).
- Harris County population projected at +47% by 2050 — long-run rental-demand tailwind backs the buy-and-hold thesis.
- At projected returns (5.2% appreciation + 0.0% rent growth), your $112k cash investment doubles in ~5 years — after that, you're playing with house money.
- By year 2, paydown + projected appreciation supports a ~$38k cash-out refi (75% LTV) — recoverable capital for the next deal without selling this one.
Negotiation context
- It's been on market 109 days — a 9% lower offer ($363k) is reasonable based on typical stale-listing flexibility.
Risks & watch-outs
- Climate carrying-cost: severe wind risk, 99% chance of damaging wind over 30y; extreme-heat days projected 6→21/yr by 2055 (HVAC capex compounding) — expect insurance premiums to compound above CPI over the hold.
Questions for the listing agent
- It's been on market 109 days. Have you received any prior offers? Is the seller open to a 9% concession, seller financing, or rate buy-down credit?
- Can we see the unit-by-unit rent roll, current vacancy, and any below-market leases? What's the average tenancy length?
- What capital expenditures (roof, boiler, parking lot, exteriors) have been made in the last 5 years, and what's planned in the next 2?
- Why hasn't it sold? Are there any deal-killer items the seller is aware of (foundation, flood, title, zoning, code violations)?
- Is there a deadline driving the sale (1031 exchange, divorce, estate, relocation)? That informs how much negotiation room exists.
- Schools are D-rated, which usually means shorter tenancies and higher turnover. Who's the typical renter profile here, and what's been the actual vacancy rate?
- Crime grade is F in this area — have there been break-ins, vandalism, or insurance claims at this property in the last 3 years? What carrier currently insures it and at what premium?
- What's the average days-on-market for RENTAL listings here right now (not sales)? A rising rental-DOM trend means longer vacancies and softer asking-rent achievability than the comps imply.
- What's the recent tenant-quality profile in this submarket — average credit score on applications, eviction rate, late-payment / NSF rate, and stable-employment percentage? A property-management company in the area should have these aggregated.
- How much new apartment / multifamily construction is in the pipeline within 1–3 miles? Heavy new supply (>2% of stock underway) typically softens rents 12–24 months out; light construction supports rent growth.
Investment metrics
- 1% rule
- 0.96% ✗
- Cap rate
- 6.77%
- Cash-on-cash
- 1.71%
- DSCR
- 1.08
- GRM
- 8.7
CMA / ARV
- ARV (median comp)
- $429,884
- List price
- $399,000
- Delta
- -7.18%
- Verdict
- FAIR
- Comps
- 20 within 1.0 mi
Show comp detail 3 sales within ~0.75 mi
| Address | Dist | Beds/Ba | Sqft | Sold | Price | $/sf | Match |
|---|---|---|---|---|---|---|---|
| 7830 Booker Street A-b | 0.15mi | 6/— | 2,524 (+3%) | 15mo | $447,500 | $177 | 76 |
| 7921 Bonaire St Unit A and B | 0.25mi | 6/2.0 | 2,581 (+5%) | 17mo | $465,000 | $180 | 58 |
| 6112 Fairchild St | 0.70mi | 6/2.0 | 2,452 (-0%) | 14mo | $412,000 | $168 | 47 |
Match score weights: distance 35% · size 25% · config 20% · recency 20%. Top-matched comps best support the ARV.
Projected returns pro-forma
5.25% appreciation · 0.0% rent growth · sell at horizon
- IRR
- 13.6%
- Equity multiple
- 1.87×
- Total profit
- $96,650
- Equity at exit
- $232,070
- IRR
- 13.2%
- Equity multiple
- 3.35×
- Total profit
- $262,000
- Equity at exit
- $405,539
Cash invested: $111,720 (down + closing). Projections, not guarantees.
Landlord ↔ Tenant lean methodology
- Overall (STATE)
- 87 Strongly Landlord-Friendly
- State Texas
- 87 Strongly Landlord-Friendly · R+5
- County
- — inherits STATE
- City
- — inherits STATE
ZIP-level market 77028
- Home prices YoY
- 2.0%
- Rents YoY
- -1.6%
- Active inventory
- 353
- Price-to-rent
- 17.4×
Monthly cashflow live
- Estimated rent
- $3,817 high interval (Pro) →
- Mortgage (P&I)
- −$2,092
- Tax from tax record
- −$597 /mo · $7,169/yr
- Insurance
- −$166
- HOA
- −$0
- Vacancy / Maint / Mgmt
- −$802
- Net cashflow
- $159
Break-even live
2-unit breakdown (identical units grouped — click to expand)
| Units | Beds | Baths | Est. rent |
|---|---|---|---|
| 2× units | 3 | 2 | $3,818 |
| #1 | 3 | 2 | $1,909 |
| #2 | 3 | 2 | $1,909 |
| Total (2 units) | $3,817 | ||
UW: 25.0% down · 7.5% · 30yr · 1.5% tax · 5.0% vac · 8.0% maint · 8.0% mgmt
Financing live
Cash to close
- Down payment
- $99,750
- Closing costs
- $11,970
- Reserves months
- —
- Total cash needed
- —
Loan-product check · same deal, 3 products live
Conventional
25% down · 7.5% · 30yr
- Down + closing
- —
- Monthly P&I
- —
- Monthly cashflow
- —
- DSCR
- —
- Eligible?
- —
Personal DTI + credit; lowest rate.
DSCR
20% down · 8.5% · 30yr
- Down + closing
- —
- Monthly P&I
- —
- Monthly cashflow
- —
- DSCR
- —
- Eligible?
- —
No personal income docs; deal must DSCR.
Hard money
10% down · 12.0% · 12mo
- Down + closing
- —
- Monthly P&I
- —
- Monthly cashflow
- —
- DSCR
- —
- Eligible?
- —
Short-term bridge; refi at stabilization.
Listing history 12 events
-
2026-06-18days on market $399,000 Active 109 DOM
-
2026-06-17days on market $399,000 Active 108 DOM
-
2026-06-16days on market $399,000 Active 107 DOM
-
2026-06-15days on market $399,000 Active 106 DOM
-
2026-06-13days on market $399,000 Active 104 DOM
-
2026-06-10days on market $399,000 Active 100 DOM
-
2026-06-08days on market $399,000 Active 99 DOM
-
2026-06-07pricedays on market $399,000 Active 98 DOM
-
2026-06-04days on market $410,000 Active 95 DOM
-
2026-06-01days on market $410,000 Active 92 DOM
-
2026-05-31days on market $410,000 Active 91 DOM
-
2026-03-01$410,000 Active 279-char remark
Show marketing remark (279 chars)
Welcome to this stunning 3 bedroom, 2 Bath duplex. Offering modern finished, Features open-concept living area. Beautiful kitchen with soft close cabinets, granite countertops and stainless steel appliances. Close to 610, 59 and hardy toll. Just 15 minutes from downtown Houston.
ⓘ Source: listings_history table (triggers on properties + properties_extension) + one-shot
backfill from property_details.listing_events for pre-trigger history.
Tax reassessment forecast TX · Resets to sale price
- Current annual tax
- $7,169 · $597/mo
- Projected year-2 tax
- $7,302 · $608/mo
- Expected delta
- +$133/yr (+$11/mo · 1.9%)
ⓘ Screening estimate from a state-policy table — verify with the county assessor before closing.
Climate risk First Street
- Flood 4/10 Moderate FEMA zone X (unshaded) · 20% chance over 30 yrs
- Wildfire 1/10 Low
- Heat 9/10 Extreme 6 d/yr ≥110°F today · 21 d/yr by 30 yrs out
- Wind 9/10 Extreme 99% chance of damaging wind over 30 yrs
- Air quality 3/10 Moderate 2 unhealthy d/yr today · 3 by 30 yrs out
Nearby sold comps map
Loading sold comps map…
Walkable amenities ~0.75 mi
Loading nearby amenities…
Taxation est. · year 1
- Rental income
- $45,804
- − Mortgage interest
- −$22,350
- − Property taxes
- −$7,169
- − Insurance
- −$1,995
- − Repairs & maintenance
- −$3,664
- − Management
- −$3,664
- − Depreciation
- −$11,607
- Taxable loss
- −$4,646
- Est. tax savings @ 24.0%
- +$1,115
- After-tax cash flow
- $3,027/yr
For passive investors: Depreciation is non-cash, so a rental often shows a tax loss while cash-flowing — sheltering income. Rental losses are passive: they offset passive income freely, and up to $25,000/yr can offset ordinary (W-2) income if you actively participate and your MAGI is under $100k (phasing out to $0 by $150k); unused losses carry forward. On sale, claimed depreciation is recaptured at up to 25%, and gains may owe capital-gains tax (a 1031 exchange can defer both). Figures are a year-1 estimate at your 24.0% rate — not tax advice; consult a CPA.
Condition & rehab AI · 12 photos
This well-maintained, modern 3-bedroom, 2-bath duplex is move-in ready with a good condition score and minimal repairs needed. Upgrades in paint, flooring, appliances, and landscaping can further enhance its value.
Value-add opportunities
- Both Painting the exterior and interior walls — Fresh paint can enhance curb appeal and interior aesthetics.
- Both Updating the flooring in the bathrooms — Modern flooring can improve the look and feel of the bathrooms.
- Both Upgrading the kitchen appliances — Newer appliances can increase the home's appeal and functionality.
- Both Adding smart home features — Smart home features can increase convenience and add value to the property.
- Both Landscaping improvements — Enhanced landscaping can improve curb appeal and add value to the property.
Renovation cost estimate screening
Value-add ROI direction
- Both Painting the exterior and interior walls — Fresh paint can enhance curb appeal and interior aesthetics. ↑
- Both Updating the flooring in the bathrooms — Modern flooring can improve the look and feel of the bathrooms. ↑
- Both Upgrading the kitchen appliances — Newer appliances can increase the home's appeal and functionality. ↑
- Both Adding smart home features — Smart home features can increase convenience and add value to the property. ↑
- Both Landscaping improvements — Enhanced landscaping can improve curb appeal and add value to the property. ↑
ⓘ Cost ranges are severity-bucket heuristics (US national rule-of-thumb). Get contractor quotes + a written scope before underwriting a rehab budget.
Schools (NCES district)
- District
- Houston ISD
- NCES district ID
- 4823640
- Math proficiency
- 27% ▼ -18.00%
- Reading proficiency
- 35% ▼ -6.00%
- Median HH income
- $46,054
- Composite
- 26.63/100
- National rank
- #7173
- State rank
- #593 of 826 in TX
Livability — Houston
- Score
- 74/100
- State rank
- #184
- US rank
- #4771
Category grades
Schools grade is shown separately in the Schools card above.
Census & demographics
- Census place
- Houston, TX
- County
- Harris County · 4,702,590 people
- City population
- 3,226,434
- Metro
- Houston-The Woodlands-Sugar Land, TX
- Population (ZIP)
- 19,109
- Household income
- $38,357
- Rent vs Own
- Severe rent burden
- 1177.0
Population outlook (Harris County) Hauer SSP2
- Today (2025)
- 5,571,493 people
- By 2030
- 6,089,821 · +9.3%
- By 2040
- 7,142,806 · +28.2%
- By 2050
- 8,185,864 · +46.9%
- By 2075
- 10,574,329 · +89.8%
- By 2100
- 12,109,958 · +117.4%
Race, ethnicity, and origin ACS 2023
- Neighborhood character
- Majority Black (57%)
- Race & ethnicity
- Black 57% Hispanic / Latino 41% Two or more races 15% White 2%
- Hispanic origin (detail)
- Mexican 36%
- Foreign-born
- 13% · Canada
- Languages at home
- 61% English-only · Spanish 38%
Political lean MEDSL · Harris
- 2024 margin
- Lean D (+5.5) · D 52.0% · R 46.4% · Other 1.6%
- 2008→2024 swing
- +3.9pp toward D · 2008: 1.6pp · 2024: 5.5pp
- All cycles
- 2024: D+5.5 2020: D+13.3 2016: D+12.4 2012: D+0.1 2008: D+1.6
Not yet ingested
- Civics
- —
Market trends
- HPI YoY
- ▲ 5.25%
- Current HPI
- 267.7798
- Rent YoY
- ▼ -1.55%
- Metro
- Houston-The Woodlands-Sugar Land, TX
- State GDP YoY
- ▲ 3.95%
- F500 in state
- 110
Industry mix (Fortune 500 HQ in TX)
| Industry | F500 HQs | Revenue |
|---|---|---|
| Energy | 16 | $1,198B |
|
||
| Technology | 5 | $198B |
|
||
| Engineering / Construction | 4 | $72B |
|
||
| Energy Services | 3 | $60B |
|
||
| Utilities | 3 | $41B |
|
||
| Healthcare | 2 | $330B |
|
||
Price history
1 event — show timeline
- 2026-03-01 Listed $410,000 HARMLS
Property tax history
+292.3%/yrLatest (2025): $7,169 · +21.9% YoY. Source: county tax records.
Cash-flow waterfall
monthlySold comps — $/sqft
last 12 mo · ≤1 miLoading sold comps…