 🏗️ New Construction
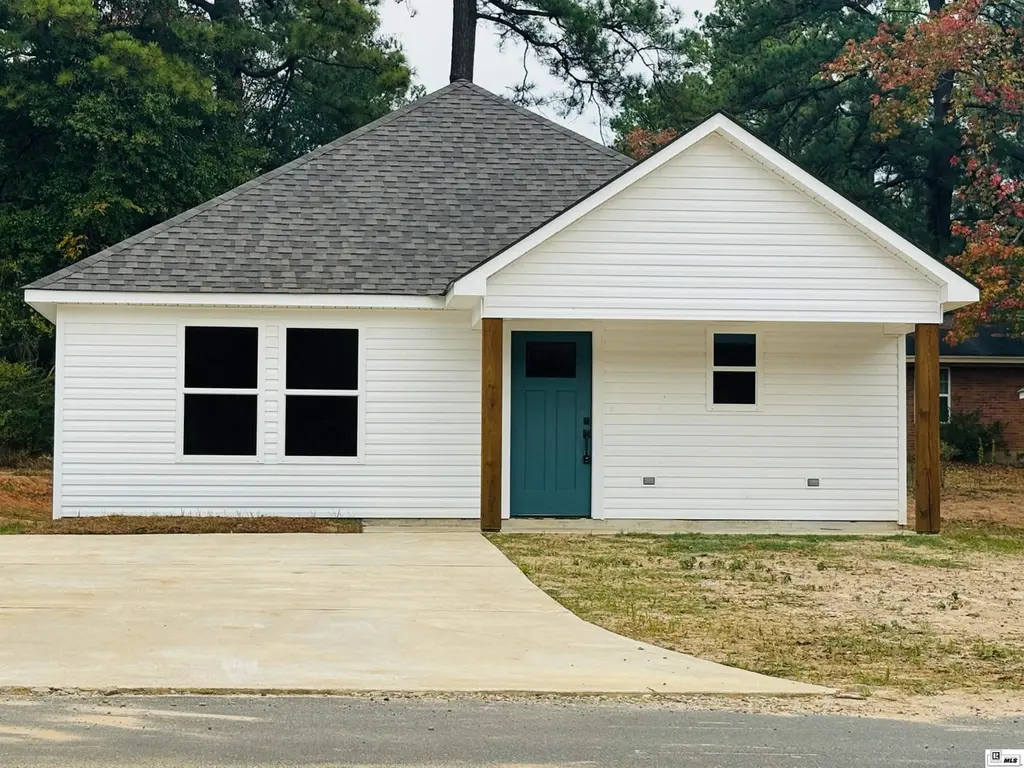
603 Nichols Pl · West Monroe, LA
Flood risk No data
- FEMA flood zone
- —
- Chance of flooding over 30 yrs
- —
- Est. flood insurance / yr
- —
Fire risk No data
- Est. fire insurance / yr
- —
Heat risk No data
- Hot days now (above threshold)
- —
- Hot days in 30 yrs
- —
Wind risk No data
- Chance of severe wind over 30 yrs
- —
Air-quality risk No data
- Unhealthy air days now
- —
- Unhealthy air days in 30 yrs
- —
Risk factors via First Street. Map © Google.
Why this score? — see what drove the D- grade
The composite is a weighted blend of 9 inputs, each scored 0–100. Each bar is that input's sub-score; the figure is the points it added to the 100-point composite (weight × sub-score).
- Cash flow +11.1/30.0
- ARV discount +7.5/15.0
- Rent growth +4.7/5.0
- Livability +3.5/5.0
- DSCR +3.2/10.0
- Schools +3.2/10.0
- 1% rule +2.6/10.0
- Condition / age +2.5/5.0
- Appreciation +0.0/10.0
$203,500
🖨 Deal sheet (PDF) 📄 Offer letter ✓ Due diligence
Listing remarks
NEW CONSTRUCTION UNDER $205K!!!! In a newly developed subdivision. This beautiful 3 bedroom, 2 bathroom Magnolia Style Farmhouse comes with an open floor concept with granite countertops throughout. The kitchen is completely equipped with a side by side refrigerator, electric range, microwave, dishwasher and a walk~in pantry. The bonus about Nichols Place Subdivision. .. .you are walking distance to the beauty of Kiroli Park – relax and experience nature's quality of life in this beautiful park~ including several playgrounds, tennis courts, a dog park, conservatory and so much more. Do not miss you opportunity to own this spectacular home!! * * Lease option now available, $1650 \ mo
Key facts
- Built 2023
- Listed 224 days
Neighborhood map
What this means for you Summary
Snapshot
- This is a 3-bed/2.0-bath single-family listed at $204k.
Deal economics
- At list price, monthly cash flow is $-84 ($-1k/yr) — negative.
- To cash-flow at today's rent, offer at most $197k (3.1% below list).
- To meet the 1% rule (rent ≥ 1% of price), the offer needs to be $161k (20.7% below list).
- Recommended offer: $161k (20.7% below list) — sets the bar for 1% rule.
Location & tenants
- Location reads 70/100 on livability (#53 in LA) — a middle-class / working-renter tenant base. Strengths: cost of living A+, health & safety A+, housing A; Watch: crime F, commute F, employment F.
- Ouachita Parish (suburban): math 31% / reading 45% proficiency, ranked #26 of 98 in LA (top 26%) — families likely to look elsewhere, expect single-tenant / working-renter base with shorter leases.
- Zoned schools: Kiroli Elementary School (math 41% / reading 64%, grade C-, #105 of 646 statewide, top 16%, 509 students, 50% FRL); Good Hope Middle School (math 35% / reading 53%, grade D, #51 of 218 statewide, top 24%, 602 students, 53% FRL); West Monroe High School (math 32% / reading 48%, grade F, #77 of 265 statewide, top 29%, 2,189 students, 58% FRL) — zoned schools at 53% FRL track the district average.
- Market conditions: Rents rising fast (+8.9%/yr); 201 active listings in the ZIP; 4 comparable units currently listed for rent nearby; rentals lingering (median 46d on market — plan ~5-8 weeks vacancy on turnover, expect pricing pressure); 75% of comp listings sitting > 30 days — soft ceiling on asking rent; 345 units permitted in Ouachita Parish in 2024 (0 in 5+ unit buildings).
Forward outlook
- Local home prices are declining (-3.0%/yr); year-one equity from $1k of loan paydown is wiped out by about $6k of value loss. Plan a longer hold.
Negotiation context
- It's been on market 224 days — a 12% lower offer ($179k) is reasonable based on typical stale-listing flexibility.
Questions for the listing agent
- What do current leases actually rent for vs. the listed asking? Can we see a recent rent roll and the last 12 months of T-12 income?
- It's been on market 224 days. Have you received any prior offers? Is the seller open to a 21% concession, seller financing, or rate buy-down credit?
- What does the HOA fee cover, when was the last increase, and are there any pending special assessments or reserve-fund shortfalls?
- Why hasn't it sold? Are there any deal-killer items the seller is aware of (foundation, flood, title, zoning, code violations)?
- Is there a deadline driving the sale (1031 exchange, divorce, estate, relocation)? That informs how much negotiation room exists.
- Schools are B-rated — typically a magnet for longer-tenancy family renters. What's the average tenant stay here, and is there a school-zone premium baked into asking?
- Crime grade is F in this area — have there been break-ins, vandalism, or insurance claims at this property in the last 3 years? What carrier currently insures it and at what premium?
- The area grade is low — what's the realistic commute time and amenity access for the typical tenant pool here? Any planned neighborhood developments (good or bad) we should know about?
- What's the average days-on-market for RENTAL listings here right now (not sales)? A rising rental-DOM trend means longer vacancies and softer asking-rent achievability than the comps imply.
- What's the recent tenant-quality profile in this submarket — average credit score on applications, eviction rate, late-payment / NSF rate, and stable-employment percentage? A property-management company in the area should have these aggregated.
- How much new for-sale + rental construction is in the pipeline within 1–3 miles? Heavy new supply typically softens prices + rents 12–24 months out; constrained supply supports both.
Investment metrics
- 1% rule
- 0.76% ✗
- Cap rate
- 5.82%
- Cash-on-cash
- -1.69%
- DSCR
- 0.92
- GRM
- 10.9
CMA / ARV
- ARV (on-the-fly)
- $211,950
- Comps found
- 12
Show comp detail 12 sales within ~0.75 mi
| Address | Dist | Beds/Ba | Sqft | Sold | Price | $/sf | Match |
|---|---|---|---|---|---|---|---|
| 615 Nichols Pl | 0.05mi | 3/2.0 | 1,360 (+1%) | 10mo | $215,000 | $158 | 88 |
| 602 Nichols Pl | 0.03mi | 3/2.0 | 1,280 (-5%) | 3mo | $212,500 | $166 | 87 |
| 101 Nichols Dr | 0.25mi | 3/1.5 | 1,377 (+2%) | 14mo | $170,000 | $123 | 71 |
| 702 Kiroli Rd | 0.40mi | 3/2.0 | 1,295 (-4%) | 14mo | $218,000 | $168 | 63 |
| 1516 Cedar St | 0.57mi | 2/1.0 (-1) | 1,381 (+2%) | 1mo | $168,370 | $122 | 60 |
| 106 Mauldin Dr | 0.68mi | 3/2.0 | 1,424 (+6%) | 1mo | $238,000 | $167 | 58 |
| 1010 Audubon Ave | 0.62mi | 3/1.5 | 1,266 (-6%) | 2mo | $188,000 | $148 | 57 |
| 147 Northwood Cir | 0.45mi | 3/2.0 | 1,485 (+10%) | 12mo | $226,500 | $153 | 52 |
| 1421 Elizabeth St | 0.55mi | 3/1.0 | 1,410 (+4%) | 13mo | $170,000 | $121 | 52 |
| 128 Tuscany Cir | 0.58mi | 2/2.0 (-1) | 1,288 (-5%) | 10mo | $202,000 | $157 | 52 |
| 120 Orleans Pl | 0.70mi | 3/2.0 | 1,296 (-4%) | 13mo | $213,000 | $164 | 50 |
| 130 Tuscany Cir | 0.59mi | 2/2.0 (-1) | 1,469 (+9%) | 14mo | $222,000 | $151 | 41 |
Match score weights: distance 35% · size 25% · config 20% · recency 20%. Top-matched comps best support the ARV.
Projected returns pro-forma
-3.0% appreciation · 8.0% rent growth · sell at horizon
- IRR
- -14.1%
- Equity multiple
- 0.47×
- Total profit
- $-31,184
- Equity at exit
- $31,602
- IRR
- 0.9%
- Equity multiple
- 1.08×
- Total profit
- $4,646
- Equity at exit
- $18,326
Cash invested: $59,346 (down + closing). Projections, not guarantees.
Landlord ↔ Tenant lean methodology
- Overall (STATE)
- 90 Strongly Landlord-Friendly
- State Louisiana
- 90 Strongly Landlord-Friendly · R+12
- County
- — inherits STATE
- City
- — inherits STATE
ZIP-level market 71291
- Home prices YoY
- -30.2%
- Rents YoY
- 8.9%
- Active inventory
- 201
- Price-to-rent
- 10.5×
Monthly cashflow live
- Estimated rent
- $1,614 medium interval (Pro) →
- Mortgage (P&I)
- −$1,111
- Tax from tax record
- −$151 /mo · $1,813/yr
- Insurance
- −$88
- HOA
- −$8
- Lot rent
- −$0
- Vacancy / Maint / Mgmt
- −$339
- Net cashflow
- $-84
Break-even live
Sensitivity live
| Price | -10% $36 | -5% $-24 | +0% $-84 | +5% $-144 | +10% $-204 |
|---|---|---|---|---|---|
| Rent | -10% $-211 | -5% $-147 | +0% $-84 | +5% $-20 | +10% $44 |
| Rate | -1.0pp $23 | -0.5pp $-30 | base $-84 | +0.5pp $-139 | +1.0pp $-194 |
UW: 25.0% down · 7.5% · 30yr · 1.5% tax · 5.0% vac · 8.0% maint · 8.0% mgmt
Financing live
Cash to close
- Down payment
- $52,988
- Closing costs
- $6,358
- Reserves months
- —
- Total cash needed
- —
Loan-product check · same deal, 3 products live
Conventional
25% down · 7.5% · 30yr
- Down + closing
- —
- Monthly P&I
- —
- Monthly cashflow
- —
- DSCR
- —
- Eligible?
- —
Personal DTI + credit; lowest rate.
DSCR
20% down · 8.5% · 30yr
- Down + closing
- —
- Monthly P&I
- —
- Monthly cashflow
- —
- DSCR
- —
- Eligible?
- —
No personal income docs; deal must DSCR.
Hard money
10% down · 12.0% · 12mo
- Down + closing
- —
- Monthly P&I
- —
- Monthly cashflow
- —
- DSCR
- —
- Eligible?
- —
Short-term bridge; refi at stabilization.
Rent comps 4 comps
| Address | Beds | Baths | Sqft | Rent | $/sqft | DOM | Units | Dist |
|---|---|---|---|---|---|---|---|---|
| 112 Fairlane Dr Unit 8 West Monroe, LA | 2.0 | 2.0 | 1050 | $1,600 | $1.52 | 23d | 1 | 0.90mi |
| 1114 Otis St West Monroe, LA | 3.0 | 2.0 | 1304 | $1,595 | $1.22 | 46d | 1 | 0.90mi |
| 2417 N 9th St West Monroe, LA | 2.0 | 1.0 | 900 | $2,000 | $2.22 | 46d | 1 | 1.06mi |
| 202 Gross St West Monroe, LA | 3.0 | 1.0 | 1100 | $1,350 | $1.23 | 46d | 1 | 1.18mi |
HOA detail
- Monthly dues
- $8 · $96/yr
- Likely covers
- electriclandscaping
Listing history 3 events
-
2024-02-19status Pending
-
2023-11-08price $203,500
-
2023-07-10$204,000 Active
ⓘ Source: listings_history table (triggers on properties + properties_extension) + one-shot
backfill from property_details.listing_events for pre-trigger history.
Tax reassessment forecast LA · Resets to sale price
- Current annual tax
- $1,813 · $151/mo
- Projected year-2 tax
- $1,813 · $151/mo
- Expected delta
- $0/yr ($0/mo · 0.0%)
ⓘ Screening estimate from a state-policy table — verify with the county assessor before closing.
Nearby sold comps map
Loading sold comps map…
Walkable amenities ~0.75 mi
Loading nearby amenities…
Taxation est. · year 1
- Rental income
- $19,371
- − Mortgage interest
- −$11,872
- − Property taxes
- −$1,813
- − Insurance
- −$1,060
- − Repairs & maintenance
- −$1,550
- − Management
- −$1,550
- − HOA
- −$96
- − Depreciation
- −$6,166
- Taxable loss
- −$4,736
- Est. tax savings @ 24.0%
- +$1,137
- After-tax cash flow
- $133/yr
For passive investors: Depreciation is non-cash, so a rental often shows a tax loss while cash-flowing — sheltering income. Rental losses are passive: they offset passive income freely, and up to $25,000/yr can offset ordinary (W-2) income if you actively participate and your MAGI is under $100k (phasing out to $0 by $150k); unused losses carry forward. On sale, claimed depreciation is recaptured at up to 25%, and gains may owe capital-gains tax (a 1031 exchange can defer both). Figures are a year-1 estimate at your 24.0% rate — not tax advice; consult a CPA.
Schools (NCES district)
- District
- Ouachita Parish
- NCES district ID
- 2201200
- Math proficiency
- 31% ▼ -38.00%
- Reading proficiency
- 45% ▼ -31.00%
- Median HH income
- $43,316
- Composite
- 32.14/100
- National rank
- #5791
- State rank
- #26 of 98 in LA
Livability — West Monroe
- Score
- 70/100
- State rank
- #53
- US rank
- #7498
Category grades
Schools grade is shown separately in the Schools card above.
Census & demographics
- County
- Ouachita Parish · 118,340 people
- City population
- 58,204
- Metro
- Monroe, LA
- Population (ZIP)
- 35,269
- Household income
- $71,639
- Rent vs Own
- Severe rent burden
- 847.0
Population outlook (Ouachita County) Hauer SSP2
- Today (2025)
- 163,370 people
- By 2030
- 165,520 · +1.3%
- By 2040
- 167,652 · +2.6%
- By 2050
- 166,699 · +2.0%
- By 2075
- 156,348 · -4.3%
- By 2100
- 134,102 · -17.9%
Race, ethnicity, and origin ACS 2023
- Neighborhood character
- Predominantly White (78%)
- Race & ethnicity
- White 78% Black 13% Hispanic / Latino 6% Two or more races 3% Asian 1%
- Hispanic origin (detail)
- Mexican 3%
- Common ancestry
- Lithuanian 3% Italian 2% Slovak 1%
- Foreign-born
- 4% · Canada
- Languages at home
- 94% English-only · Spanish 4% Other Indo-European 1%
Political lean MEDSL · Ouachita
- 2024 margin
- Strong R (+27.9) · D 35.5% · R 63.3% · Other 1.2%
- 2008→2024 swing
- -2.7pp toward R · 2008: -25.2pp · 2024: -27.9pp
- All cycles
- 2024: R+27.9 2020: R+23.6 2016: R+25.4 2012: R+20.9 2008: R+25.2
Not yet ingested
- Civics
- —
Market trends
- HPI YoY
- ▼ -95.15%
- Current HPI
- 220.1737
- Rent YoY
- ▲ 8.93%
- Metro
- Monroe, LA
- State GDP YoY
- ▲ 3.29%
- F500 in state
- 10
Industry mix (Fortune 500 HQ in LA)
| Industry | F500 HQs | Revenue |
|---|---|---|
| Telecommunications | 2 | $23B |
|
||
| Utilities | 1 | $12B |
|
||
| Wholesale / Distribution | 1 | $5B |
|
||
| Advertising | 1 | $2B |
|
||
Price history
-0.2% since first listed3 events — show timeline
- 2024-02-19 Pending — NELABOR
- 2023-11-08 Price Changed $203,500 NELABOR
- 2023-07-10 Listed $204,000 NELABOR
Property tax history
+138.8%/yrLatest (2025): $1,813 · -1.2% YoY. Source: county tax records.
Cash-flow waterfall
monthlySold comps — $/sqft
last 12 mo · ≤1 miLoading sold comps…