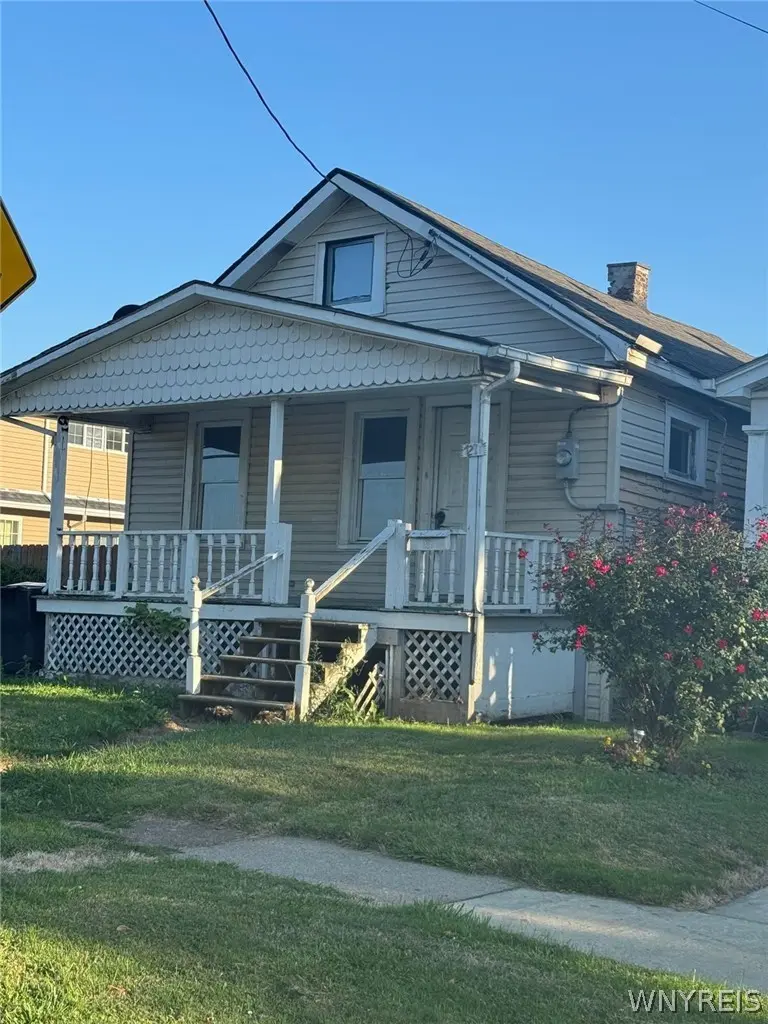
7211 Stephenson Ave · Niagara Falls, NY
Flood risk 1/10 · Minimal
- FEMA flood zone
- X (unshaded)
- Chance of flooding over 30 yrs
- 0.0%
- Est. flood insurance / yr
- $473 – $860
Fire risk 1/10 · Minimal
- Est. fire insurance / yr
- $691 – $1,283
Heat risk 2/10 · Minimal
- Hot days now (above 94°F)
- 7 days/yr
- Hot days in 30 yrs
- 14 days/yr
Wind risk 1/10 · Minimal
- Chance of severe wind over 30 yrs
- —
Air-quality risk 3/10 · Minor
- Unhealthy air days now
- 2 days/yr
- Unhealthy air days in 30 yrs
- 3 days/yr
Risk factors via First Street. Map © Google.
Why this score? — see what drove the B- grade
The composite is a weighted blend of 9 inputs, each scored 0–100. Each bar is that input's sub-score; the figure is the points it added to the 100-point composite (weight × sub-score).
- Cash flow +30.0/30.0
- 1% rule +10.0/10.0
- DSCR +10.0/10.0
- ARV discount +7.5/15.0
- Livability +3.0/5.0
- Rent growth +2.5/5.0
- Schools +2.5/10.0
- Condition / age +2.5/5.0
- Appreciation +0.0/10.0
$57,000
🖨 Deal sheet 📄 Offer letter ✓ Due diligence
Listing remarks MLS
Great Investment Opportunity or Owner-Occupied Fixer-Upper! This property offers strong potential, whether you're looking for your next investment or a home to make your own. While it recently sustained fire damage, all debris has been cleared out, and the property is ready for renovation. SELLER FINANCE is available. COULD SELL AS A PACKAGE WITH 8623 LINDBERGH AVE. , NIAGARA FALLS, NY which is not too far from this property. .. . Electric system updated: New meter, breaker box, and repaired electrical lines Exterior features: Durable vinyl siding, solid roof, and a full basement. Spacious backyard in a great neighborhood Property is being sold "as is", giving you the freedom to customize and restore to your vision. Don't miss out on this excellent opportunity to build equity or create your dream home!
Key facts
- Spacious backyard
- Renovation
- Full basement
Tags
Neighborhood map
What this means for you Summary
Snapshot
- This is a 2-bed/1.0-bath single-family listed at $57k.
Deal economics
- At list price, monthly cash flow is $351 ($4k/yr) — positive.
- The deal already cash-flows at list — no discount required.
- Meets the 1% rule at list price ($1k rent vs $57k).
- Recommended offer: $56k (1.5% below list) — sets the bar for market timing.
- Cap rate 13.7% vs local median 7.7% in Niagara Falls — top-decile yield for the area; either an underpriced asset or a hidden risk that comps aren't pricing in. Stress-test before assuming the spread holds.
Location & tenants
- Location reads 60/100 on livability (#956 in NY) — a middle-class / working-renter tenant base. Strengths: cost of living A+, housing A+; Watch: schools F, crime F, amenities F.
- Niagara Falls City School District (urban): math 26% / reading 34% proficiency, ranked #578 of 590 in NY (top 98%) — families likely to look elsewhere, expect single-tenant / working-renter base with shorter leases; 66% free/reduced lunch — lower-income household profile, screen leases tightly.
- Market conditions: 142 active listings in the ZIP; 3 comparable units currently listed for rent nearby; rentals leasing fast (median 3d on market — plan ~1-2 weeks tenant-placement turnaround); 167 units permitted in Niagara County in 2024 (0 in 5+ unit buildings).
Forward outlook
- Local home prices are declining (-3.0%/yr); year-one equity from $394 of loan paydown is wiped out by about $2k of value loss. Plan a longer hold.
- Niagara County population projected at -19% by 2050 — secular population decline; favor cash flow + early exit over multi-decade hold.
- At projected returns (-3.0% appreciation + 3.0% rent growth), your $16k cash investment doubles in ~5 years — after that, you're playing with house money.
Negotiation context
- It's been on market 15 days — a 2% lower offer ($56k) is reasonable based on typical stale-listing flexibility.
- 2 sale attempts; this cycle's ask is 4% above the opening price — seller raised mid-cycle; expect resistance to lowballs.
- Current owner paid $22k; list at $57k implies a 159% gain — meaningful room to come down on a strong offer.
Risks & watch-outs
- Watch-outs: property tax is 3.5% of price; built in 1926 — expect roof / HVAC / electrical / plumbing capex.
Questions for the listing agent
- Built in 1926 — when were the roof, HVAC, electrical panel, plumbing, and water heater last replaced?
- Property tax is high relative to price — has the assessment been appealed recently, and will the sale trigger a re-assessment?
- Is there a deadline driving the sale (1031 exchange, divorce, estate, relocation)? That informs how much negotiation room exists.
- Schools are F-rated, which usually means shorter tenancies and higher turnover. Who's the typical renter profile here, and what's been the actual vacancy rate?
- Crime grade is F in this area — have there been break-ins, vandalism, or insurance claims at this property in the last 3 years? What carrier currently insures it and at what premium?
- What's the average days-on-market for RENTAL listings here right now (not sales)? A rising rental-DOM trend means longer vacancies and softer asking-rent achievability than the comps imply.
- What's the recent tenant-quality profile in this submarket — average credit score on applications, eviction rate, late-payment / NSF rate, and stable-employment percentage? A property-management company in the area should have these aggregated.
- How much new for-sale + rental construction is in the pipeline within 1–3 miles? Heavy new supply typically softens prices + rents 12–24 months out; constrained supply supports both.
Investment metrics
- 1% rule
- 1.87% ✓
- Cap rate
- 13.69%
- Cash-on-cash
- 26.42%
- DSCR
- 2.18
- GRM
- 4.5
CMA / ARV
- ARV (median comp)
- $141,173
- List price
- $57,000
- Delta
- -61.04%
- Verdict
- UNDERPRICED
- Comps
- 20 within 1.0 mi
Show comp detail 10 sales within ~0.75 mi
| Address | Dist | Beds/Ba | Sqft | Sold | Price | $/sf | Match |
|---|---|---|---|---|---|---|---|
| 504 74th St | 0.30mi | 3/1.0 (+1) | 680 (-3%) | 3mo | $140,000 | $206 | 73 |
| 445 75th St | 0.25mi | 2/1.0 | 756 (+7%) | 9mo | $165,000 | $218 | 68 |
| 142 72nd St | 0.28mi | 2/1.0 | 748 (+6%) | 12mo | $79,000 | $106 | 67 |
| 8106 Lindbergh Ave | 0.58mi | 2/1.0 | 720 (+2%) | 5mo | $107,900 | $150 | 65 |
| 440 77th St | 0.29mi | 2/1.0 | 658 (-6%) | 16mo | $100,000 | $152 | 63 |
| 421 77th St | 0.29mi | 2/1.0 | 760 (+8%) | 18mo | $130,000 | $171 | 58 |
| 172 80th St | 0.47mi | 2/1.0 | 776 (+10%) | 7mo | $135,000 | $174 | 56 |
| 564 75th St | 0.42mi | 2/1.0 | 792 (+12%) | 7mo | $148,000 | $187 | 54 |
| 665 76th St | 0.60mi | 2/1.0 | 792 (+12%) | 9mo | $129,900 | $164 | 44 |
| 7521 Wing Ct | 0.39mi | 2/1.0 | 804 (+14%) | 20mo | $100,000 | $124 | 41 |
Match score weights: distance 35% · size 25% · config 20% · recency 20%. Top-matched comps best support the ARV.
Projected returns pro-forma
-3.0% appreciation · 3.0% rent growth · sell at horizon
- IRR
- 20.3%
- Equity multiple
- 1.83×
- Total profit
- $13,220
- Equity at exit
- $8,499
- IRR
- 28.6%
- Equity multiple
- 3.55×
- Total profit
- $40,638
- Equity at exit
- $4,928
Cash invested: $15,960 (down + closing). Projections, not guarantees.
Landlord ↔ Tenant lean methodology
- Overall (STATE)
- 15 Strongly Tenant-Friendly
- State New York
- 15 Strongly Tenant-Friendly · D+10
- County
- — inherits STATE
- City
- — inherits STATE
ZIP-level market 14304
- Active inventory
- 142
- Price-to-rent
- 4.5×
Monthly cashflow live
- Estimated rent
- $1,066 medium interval (Pro) →
- Mortgage (P&I)
- −$299
- Tax from tax record
- −$168 /mo · $2,015/yr
- Insurance
- −$24
- HOA
- −$0
- Vacancy / Maint / Mgmt
- −$224
- Net cashflow
- $351
Break-even live
UW: 25.0% down · 7.5% · 30yr · 1.5% tax · 5.0% vac · 8.0% maint · 8.0% mgmt
Financing live
Cash to close
- Down payment
- $14,250
- Closing costs
- $1,710
- Reserves months
- —
- Total cash needed
- —
Loan-product check · same deal, 3 products live
Conventional
25% down · 7.5% · 30yr
- Down + closing
- —
- Monthly P&I
- —
- Monthly cashflow
- —
- DSCR
- —
- Eligible?
- —
Personal DTI + credit; lowest rate.
DSCR
20% down · 8.5% · 30yr
- Down + closing
- —
- Monthly P&I
- —
- Monthly cashflow
- —
- DSCR
- —
- Eligible?
- —
No personal income docs; deal must DSCR.
Hard money
10% down · 12.0% · 12mo
- Down + closing
- —
- Monthly P&I
- —
- Monthly cashflow
- —
- DSCR
- —
- Eligible?
- —
Short-term bridge; refi at stabilization.
Rent comps 3 comps
| Address | Beds | Baths | Sqft | Rent | $/sqft | DOM | Units | Dist |
|---|---|---|---|---|---|---|---|---|
| 730 66th St Niagara Falls, NY | 2.0 | 1.0 | 748 | $963 | $1.29 | 1d | 1 | 0.71mi |
| 8405 Buffalo Ave Niagara Falls, NY | 2.0 | 1.0 | 706 | $850 | $1.20 | 11d | 1 | 0.72mi |
| 51 S 86th St Unit 11B Niagara Falls, NY | 2.0 | 1.0 | 720 | $1,100 | $1.53 | 2d | 1 | 0.91mi |
Listing history 16 events
-
2026-06-18days on market $57,000 Active 15 DOM
-
2026-06-17days on market $57,000 Active 14 DOM
-
2026-06-16days on market $57,000 Active 13 DOM
-
2026-06-15days on market $57,000 Active 12 DOM
-
2026-06-13days on market $57,000 Active 10 DOM
-
2026-06-13days on market $57,000 Active 9 DOM
-
2026-06-10days on market $57,000 Active 7 DOM
-
2026-06-09days on market $57,000 Active 6 DOM
-
2026-06-08days on market $57,000 Active 5 DOM
-
2026-06-07pricedays on market $57,000 Active 4 DOM
-
2026-06-01days on market $55,000 Active 91 DOM
-
2026-05-31days on market $55,000 Active 90 DOM
-
2026-03-01$55,000 Active 823-char remark
Show marketing remark (823 chars)
Great Investment Opportunity or Owner-Occupied Fixer-Upper! This property offers strong potential, whether you're looking for your next investment or a home to make your own. While it recently sustained fire damage, all debris has been cleared out, and the property is ready for renovation. SELLER FINANCE is available. COULD SELL AS A PACKAGE WITH 8623 LINDBERGH AVE. , NIAGARA FALLS, NY which is not too far from this property. .. . Electric system updated: New meter, breaker box, and repaired electrical lines Exterior features: Durable vinyl siding, solid roof, and a full basement. Spacious backyard in a great neighborhood Property is being sold "as is", giving you the freedom to customize and restore to your vision. Don't miss out on this excellent opportunity to build equity or create your dream home!
-
2025-12-29historical
-
2025-09-29$58,900 Active
-
1995-04-06soldstatus $22,000
ⓘ Source: listings_history table (triggers on properties + properties_extension) + one-shot
backfill from property_details.listing_events for pre-trigger history.
Tax reassessment forecast NY · Partial reset (capped growth)
- Current annual tax
- $2,015 · $168/mo
- Projected year-2 tax
- $2,015 · $168/mo
- Expected delta
- $0/yr ($0/mo · 0.0%)
ⓘ Screening estimate from a state-policy table — verify with the county assessor before closing.
Climate risk First Street
- Flood 1/10 Low FEMA zone X (unshaded) · 0% chance over 30 yrs
- Wildfire 1/10 Low
- Heat 2/10 Low 7 d/yr ≥94°F today · 14 d/yr by 30 yrs out
- Wind 1/10 Low
- Air quality 3/10 Moderate 2 unhealthy d/yr today · 3 by 30 yrs out
Nearby sold comps map
Loading sold comps map…
Walkable amenities ~0.75 mi
Loading nearby amenities…
Taxation est. · year 1
- Rental income
- $12,789
- − Mortgage interest
- −$3,193
- − Property taxes
- −$2,015
- − Insurance
- −$285
- − Repairs & maintenance
- −$1,023
- − Management
- −$1,023
- − Depreciation
- −$1,658
- Taxable income
- $3,592
- Est. tax owed @ 24.0%
- −$862
- After-tax cash flow
- $3,355/yr
For passive investors: Depreciation is non-cash, so a rental often shows a tax loss while cash-flowing — sheltering income. Rental losses are passive: they offset passive income freely, and up to $25,000/yr can offset ordinary (W-2) income if you actively participate and your MAGI is under $100k (phasing out to $0 by $150k); unused losses carry forward. On sale, claimed depreciation is recaptured at up to 25%, and gains may owe capital-gains tax (a 1031 exchange can defer both). Figures are a year-1 estimate at your 24.0% rate — not tax advice; consult a CPA.
Schools (NCES district)
- District
- Niagara Falls City School District
- NCES district ID
- 3620820
- Math proficiency
- 26% ▼ -10.00%
- Reading proficiency
- 34% ▲ 3.00%
- Median HH income
- $32,488
- Composite
- 24.5/100
- National rank
- #7655
- State rank
- #578 of 590 in NY
Livability — Niagara Falls
- Score
- 60/100
- State rank
- #956
- US rank
- #18749
Category grades
Schools grade is shown separately in the Schools card above.
Census & demographics
- Census place
- Niagara Falls, NY
- County
- Niagara County · 157,377 people
- City population
- 62,983
- Metro
- Buffalo-Cheektowaga, NY
- Population (ZIP)
- 29,208
- Household income
- $66,660
- Rent vs Own
- Severe rent burden
- 698.0
Population outlook (Niagara County) Hauer SSP2
- Today (2025)
- 204,149 people
- By 2030
- 197,900 · -3.1%
- By 2040
- 182,239 · -10.7%
- By 2050
- 165,198 · -19.1%
- By 2075
- 129,416 · -36.6%
- By 2100
- 96,222 · -52.9%
Race, ethnicity, and origin ACS 2023
- Neighborhood character
- Predominantly White (85%)
- Race & ethnicity
- White 85% Two or more races 6% Hispanic / Latino 4% Black 3% Asian 2%
- Common ancestry
- Romanian 10% Lithuanian 3% Slovak 2%
- Foreign-born
- 3% · Canada, China, Vietnam
- Languages at home
- 93% English-only · Spanish 3% Other Indo-European 1% Russian/Polish/Slavic 1%
Political lean MEDSL · Niagara
- 2024 margin
- R (+14.9) · D 42.5% · R 57.5%
- 2008→2024 swing
- -15.9pp toward R · 2008: 1.0pp · 2024: -14.9pp
- All cycles
- 2024: R+14.9 2020: R+9.7 2016: R+19.0 2012: D+0.6 2008: D+1.0
Not yet ingested
- Civics
- —
Market trends
- HPI YoY
- ▼ -231.77%
- Current HPI
- 280.3295
- Rent YoY
- —
- Metro
- Buffalo-Cheektowaga, NY
- State GDP YoY
- ▲ 2.60%
- F500 in state
- 92
Industry mix (Fortune 500 HQ in NY)
| Industry | F500 HQs | Revenue |
|---|---|---|
| Financial Services | 10 | $950B |
|
||
| Consumer Goods | 9 | $162B |
|
||
| Insurance | 4 | $225B |
|
||
| Telecommunications | 2 | $144B |
|
||
| Pharmaceuticals | 2 | $112B |
|
||
| Media / Entertainment | 2 | $69B |
|
||
Price history
+150.0% since first listed4 events — show timeline
- 2026-03-01 Listed $55,000 WNYREIS
- 2025-12-29 Listing Removed — WNYREIS
- 2025-09-29 Listed $58,900 WNYREIS
- 1995-04-06 Sold (Public Records) $22,000 Public Records
Property tax history
+5.8%/yrLatest (2025): $2,015 · +19.3% YoY. Source: county tax records.
Cash-flow waterfall
monthlySold comps — $/sqft
last 12 mo · ≤1 miLoading sold comps…