4335 N Fm 2276 · Henderson, TX
Flood risk 1/10 · Minimal
- FEMA flood zone
- X (unshaded)
- Chance of flooding over 30 yrs
- 0.0%
- Est. flood insurance / yr
- $507 – $1,088
Fire risk 4/10 · Minor
- Est. fire insurance / yr
- $1,222 – $2,270
Heat risk 7/10 · Major
- Hot days now (above 111°F)
- 7 days/yr
- Hot days in 30 yrs
- 24 days/yr
Wind risk 6/10 · Moderate
- Chance of severe wind over 30 yrs
- 65.0%
Air-quality risk 2/10 · Minimal
- Unhealthy air days now
- 0 days/yr
- Unhealthy air days in 30 yrs
- 1 days/yr
Risk factors via First Street. Map © Google.
Why this score? — see what drove the B+ grade
The composite is a weighted blend of 9 inputs, each scored 0–100. Each bar is that input's sub-score; the figure is the points it added to the 100-point composite (weight × sub-score).
- Cash flow +30.0/30.0
- DSCR +10.0/10.0
- 1% rule +8.8/10.0
- Appreciation +8.0/10.0
- ARV discount +7.5/15.0
- Livability +3.5/5.0
- Schools +2.8/10.0
- Rent growth +2.5/5.0
- Condition / age +2.2/5.0
$79,900
🖨 Deal sheet 📄 Offer letter ✓ Due diligence
Listing remarks MLS
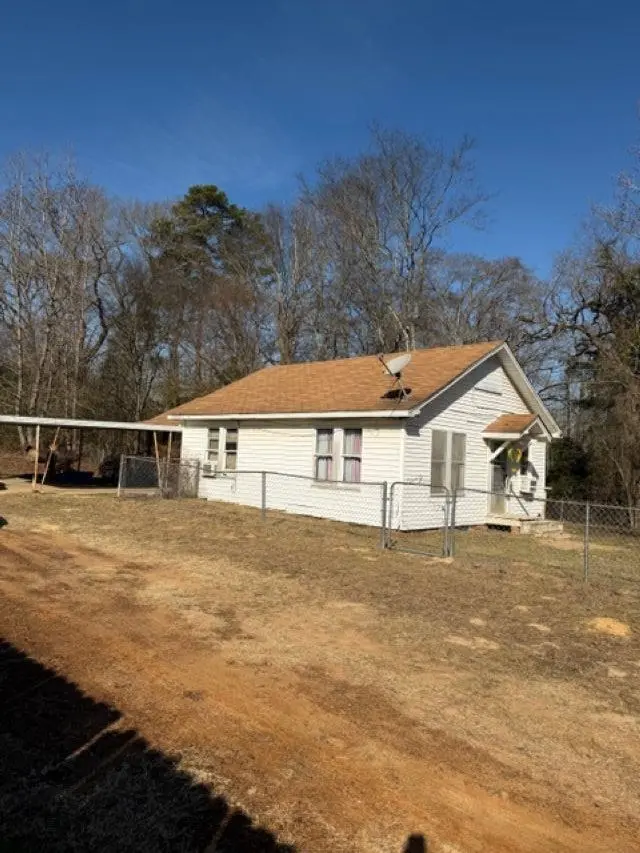
Step back in time with this cozy 944 sq ft home, full of character and opportunity. Built in 1933, this 2-bedroom, 1-bath residence sits on a generous half-acre lot, offering space, privacy, and endless possibilities. Original charm shines through, making it a perfect canvas for updates and personalization. The fully fenced yard provides room for pets, gardening, or future expansion, while the large lot offers a rare chance to enjoy country-style living with room to grow. Whether you’re an investor, renovator, or buyer looking to create your dream home, this property is brimming with potential and waiting for your vision.
Key facts
- Original charm
- Fully fenced yard
- 0.49 acre lot
Tags
Neighborhood map
What this means for you Summary
Snapshot
- This is a 2-bed/1.0-bath single-family listed at $80k. Condition is rated fair.
Deal economics
- At list price, monthly cash flow is $319 ($4k/yr) — positive.
- The deal already cash-flows at list — no discount required.
- Meets the 1% rule at list price ($1k rent vs $80k).
- Recommended offer: $70k (12.0% below list) — sets the bar for market timing.
- Cap rate 11.1% vs local median 2.9% in Henderson — top-decile yield for the area; either an underpriced asset or a hidden risk that comps aren't pricing in. Stress-test before assuming the spread holds.
Location & tenants
- Location reads 69/100 on livability (#408 in TX) — a middle-class / working-renter tenant base. Strengths: cost of living A+, housing A+, health & safety A+; Watch: employment D+, schools D-, crime F.
- Henderson ISD (town): math 30% / reading 35% proficiency, ranked #573 of 826 in TX (top 69%) — families likely to look elsewhere, expect single-tenant / working-renter base with shorter leases.
- Market conditions: 113 active listings in the ZIP; 4 units permitted in Rusk County in 2024 (0 in 5+ unit buildings).
Forward outlook
- In year one you build about $5k of equity ($552 loan paydown + $5k appreciation (6.1% local appreciation)).
- Rusk County population projected to shrink 5% by 2050 — rents likely to lag national; underwrite the cash flow, not the appreciation.
- At projected returns (6.1% appreciation + 3.0% rent growth), your $22k cash investment doubles in ~3 years — after that, you're playing with house money.
- By year 7, paydown + projected appreciation supports a ~$35k cash-out refi (75% LTV) — recoverable capital for the next deal without selling this one.
Negotiation context
- It's been on market 137 days — a 12% lower offer ($70k) is reasonable based on typical stale-listing flexibility.
Risks & watch-outs
- Watch-outs: built in 1933 — expect roof / HVAC / electrical / plumbing capex.
- Climate carrying-cost: major wind risk, 65% chance of damaging wind over 30y; extreme-heat days projected 7→24/yr by 2055 (HVAC capex compounding) — expect insurance premiums to compound above CPI over the hold.
Questions for the listing agent
- It's been on market 137 days. Have you received any prior offers? Is the seller open to a 12% concession, seller financing, or rate buy-down credit?
- Have any recent inspections been done? Can we get a copy of the seller's disclosures and any deferred-maintenance estimates?
- Built in 1933 — when were the roof, HVAC, electrical panel, plumbing, and water heater last replaced?
- Why hasn't it sold? Are there any deal-killer items the seller is aware of (foundation, flood, title, zoning, code violations)?
- Is there a deadline driving the sale (1031 exchange, divorce, estate, relocation)? That informs how much negotiation room exists.
- Schools are D-rated, which usually means shorter tenancies and higher turnover. Who's the typical renter profile here, and what's been the actual vacancy rate?
- Crime grade is F in this area — have there been break-ins, vandalism, or insurance claims at this property in the last 3 years? What carrier currently insures it and at what premium?
- What's the average days-on-market for RENTAL listings here right now (not sales)? A rising rental-DOM trend means longer vacancies and softer asking-rent achievability than the comps imply.
- What's the recent tenant-quality profile in this submarket — average credit score on applications, eviction rate, late-payment / NSF rate, and stable-employment percentage? A property-management company in the area should have these aggregated.
- How much new for-sale + rental construction is in the pipeline within 1–3 miles? Heavy new supply typically softens prices + rents 12–24 months out; constrained supply supports both.
Investment metrics
- 1% rule
- 1.38% ✓
- Cap rate
- 11.09%
- Cash-on-cash
- 17.14%
- DSCR
- 1.76
- GRM
- 6.0
CMA / ARV
No comps found within radius.
Projected returns pro-forma
6.06% appreciation · 3.0% rent growth · sell at horizon
- IRR
- 29.8%
- Equity multiple
- 2.95×
- Total profit
- $43,714
- Equity at exit
- $50,528
- IRR
- 27.7%
- Equity multiple
- 6.03×
- Total profit
- $112,608
- Equity at exit
- $91,889
Cash invested: $22,372 (down + closing). Projections, not guarantees.
Landlord ↔ Tenant lean methodology
- Overall (STATE)
- 87 Strongly Landlord-Friendly
- State Texas
- 87 Strongly Landlord-Friendly · R+5
- County
- — inherits STATE
- City
- — inherits STATE
ZIP-level market 75652
- Home prices YoY
- 1.8%
- Active inventory
- 113
- Price-to-rent
- 6.0×
Monthly cashflow live
- Estimated rent
- $1,103 medium interval (Pro) →
- Mortgage (P&I)
- −$419
- Tax est. 1.5%
- −$100 /mo · $1,198/yr
- Insurance
- −$33
- HOA
- −$0
- Vacancy / Maint / Mgmt
- −$232
- Net cashflow
- $319
Break-even live
UW: 25.0% down · 7.5% · 30yr · 1.5% tax · 5.0% vac · 8.0% maint · 8.0% mgmt
Financing live
Cash to close
- Down payment
- $19,975
- Closing costs
- $2,397
- Reserves months
- —
- Total cash needed
- —
Loan-product check · same deal, 3 products live
Conventional
25% down · 7.5% · 30yr
- Down + closing
- —
- Monthly P&I
- —
- Monthly cashflow
- —
- DSCR
- —
- Eligible?
- —
Personal DTI + credit; lowest rate.
DSCR
20% down · 8.5% · 30yr
- Down + closing
- —
- Monthly P&I
- —
- Monthly cashflow
- —
- DSCR
- —
- Eligible?
- —
No personal income docs; deal must DSCR.
Hard money
10% down · 12.0% · 12mo
- Down + closing
- —
- Monthly P&I
- —
- Monthly cashflow
- —
- DSCR
- —
- Eligible?
- —
Short-term bridge; refi at stabilization.
Listing history 18 events
-
2026-06-19days on market $79,900 Active 137 DOM
-
2026-06-18days on market $79,900 Active 136 DOM
-
2026-06-17days on market $79,900 Active 135 DOM
-
2026-06-16days on market $79,900 Active 134 DOM
-
2026-06-15days on market $79,900 Active 133 DOM
-
2026-06-14days on market $79,900 Active 131 DOM
-
2026-06-13days on market $79,900 Active 130 DOM
-
2026-06-10days on market $79,900 Active 128 DOM
-
2026-06-09days on market $79,900 Active 127 DOM
-
2026-06-09price $79,900 Active 126 DOM
-
2026-06-08days on market $84,500 Active 126 DOM
-
2026-06-07days on market $84,500 Active 125 DOM
-
2026-06-02days on market $84,500 Active 120 DOM
-
2026-06-01days on market $84,500 Active 119 DOM
-
2026-05-31days on market $84,500 Active 118 DOM
-
2026-05-30days on market $84,500 Active 117 DOM
-
2026-03-12price $99,000 635-char remark
Show marketing remark (635 chars)
Step back in time with this cozy 944 sq ft home, full of character and opportunity. Built in 1933, this 2-bedroom, 1-bath residence sits on a generous half-acre lot, offering space, privacy, and endless possibilities. Original charm shines through, making it a perfect canvas for updates and personalization. The fully fenced yard provides room for pets, gardening, or future expansion, while the large lot offers a rare chance to enjoy country-style living with room to grow. Whether you’re an investor, renovator, or buyer looking to create your dream home, this property is brimming with potential and waiting for your vision.
-
2026-02-02$105,000 Active 635-char remark
Show marketing remark (635 chars)
Step back in time with this cozy 944 sq ft home, full of character and opportunity. Built in 1933, this 2-bedroom, 1-bath residence sits on a generous half-acre lot, offering space, privacy, and endless possibilities. Original charm shines through, making it a perfect canvas for updates and personalization. The fully fenced yard provides room for pets, gardening, or future expansion, while the large lot offers a rare chance to enjoy country-style living with room to grow. Whether you’re an investor, renovator, or buyer looking to create your dream home, this property is brimming with potential and waiting for your vision.
ⓘ Source: listings_history table (triggers on properties + properties_extension) + one-shot
backfill from property_details.listing_events for pre-trigger history.
Climate risk First Street
- Flood 1/10 Low FEMA zone X (unshaded) · 0% chance over 30 yrs
- Wildfire 4/10 Moderate
- Heat 7/10 Severe 7 d/yr ≥111°F today · 24 d/yr by 30 yrs out
- Wind 6/10 Major 65% chance of damaging wind over 30 yrs
- Air quality 2/10 Low 0 unhealthy d/yr today · 1 by 30 yrs out
Nearby sold comps map
Loading sold comps map…
Walkable amenities ~0.75 mi
Loading nearby amenities…
Taxation est. · year 1
- Rental income
- $13,240
- − Mortgage interest
- −$4,476
- − Property taxes
- −$1,198
- − Insurance
- −$400
- − Repairs & maintenance
- −$1,059
- − Management
- −$1,059
- − Depreciation
- −$2,324
- Taxable income
- $2,724
- Est. tax owed @ 24.0%
- −$654
- After-tax cash flow
- $3,180/yr
For passive investors: Depreciation is non-cash, so a rental often shows a tax loss while cash-flowing — sheltering income. Rental losses are passive: they offset passive income freely, and up to $25,000/yr can offset ordinary (W-2) income if you actively participate and your MAGI is under $100k (phasing out to $0 by $150k); unused losses carry forward. On sale, claimed depreciation is recaptured at up to 25%, and gains may owe capital-gains tax (a 1031 exchange can defer both). Figures are a year-1 estimate at your 24.0% rate — not tax advice; consult a CPA.
Condition & rehab AI · 12 photos
This 944 sq ft home in Henderson, TX, presents as a moderate rehab project with fair condition. It offers potential for significant value increase through updates to the kitchen, bathrooms, exterior, and interior walls.
Repairs flagged
- Moderate kitchen cabinets — Older cabinets in need of replacement
- Moderate kitchen countertops — Worn countertops in need of replacement
- Minor bathroom fixtures — Basic fixtures that could be updated
- Moderate exterior siding — Worn siding that could be repainted or replaced
- Moderate interior walls — Worn paint that could be refreshed
- Moderate windows — Older windows that could be replaced with energy-efficient ones
Value-add opportunities
- Both Paint interior walls — Fresh paint can make a significant difference in the home's appearance
- Both Replace worn kitchen cabinets and countertops — New cabinets and countertops can greatly improve the kitchen's functionality and aesthetics
- Both Replace basic bathroom fixtures — Upgraded fixtures can make the bathroom more functional and appealing
- Both Paint exterior siding — Fresh paint can improve the home's curb appeal and increase its value
- Both Replace worn hardwood floors — New flooring can make the home more comfortable and increase its value
- Both Replace older windows — New windows can improve energy efficiency and increase the home's value
Renovation cost estimate screening
| Repair item | Severity | Est. cost |
|---|---|---|
| kitchen cabinets · Older cabinets in need of replacement | Moderate | $3,000–15,000 |
| kitchen countertops · Worn countertops in need of replacement | Moderate | $3,000–15,000 |
| bathroom fixtures · Basic fixtures that could be updated | Minor | $500–3,000 |
| exterior siding · Worn siding that could be repainted or replaced | Moderate | $3,000–15,000 |
| interior walls · Worn paint that could be refreshed | Moderate | $3,000–15,000 |
| windows · Older windows that could be replaced with energy-efficient ones | Moderate | $3,000–15,000 |
| Total estimated repair cost · 6 items | $15,500–78,000 |
Value-add ROI direction
- Both Paint interior walls — Fresh paint can make a significant difference in the home's appearance ↑
- Both Replace worn kitchen cabinets and countertops — New cabinets and countertops can greatly improve the kitchen's functionality and aesthetics ↑
- Both Replace basic bathroom fixtures — Upgraded fixtures can make the bathroom more functional and appealing ↑
- Both Paint exterior siding — Fresh paint can improve the home's curb appeal and increase its value ↑
- Both Replace worn hardwood floors — New flooring can make the home more comfortable and increase its value ↑
- Both Replace older windows — New windows can improve energy efficiency and increase the home's value ↑
ⓘ Cost ranges are severity-bucket heuristics (US national rule-of-thumb). Get contractor quotes + a written scope before underwriting a rehab budget.
Schools (NCES district)
- District
- Henderson ISD
- NCES district ID
- 4822970
- Math proficiency
- 30% ▼ -23.00%
- Reading proficiency
- 35% ▼ -13.00%
- Median HH income
- $46,296
- Composite
- 27.91/100
- National rank
- #6868
- State rank
- #573 of 826 in TX
Livability — Henderson
- Score
- 69/100
- State rank
- #408
- US rank
- #8434
Category grades
Schools grade is shown separately in the Schools card above.
Census & demographics
- Population (ZIP)
- 14,782
Population outlook (Rusk County) Hauer SSP2
- Today (2025)
- 52,498 people
- By 2030
- 52,093 · -0.8%
- By 2040
- 50,866 · -3.1%
- By 2050
- 49,696 · -5.3%
- By 2075
- 48,583 · -7.5%
- By 2100
- 43,265 · -17.6%
Race, ethnicity, and origin ACS 2023
- Neighborhood character
- Diverse neighborhood (Simpson 0.63)
- Race & ethnicity
- White 54% Hispanic / Latino 20% Black 20% Two or more races 16%
- Hispanic origin (detail)
- Mexican 17% Puerto Rican 1%
- Common ancestry
- Lithuanian 3% Slovak 2% Iranian 1%
- Foreign-born
- 7% · Canada
- Languages at home
- 85% English-only · Spanish 14%
Political lean MEDSL · Rusk
- 2024 margin
- Solid R (+59.4) · D 20.0% · R 79.4%
- 2008→2024 swing
- -13.2pp toward R · 2008: -46.3pp · 2024: -59.4pp
- All cycles
- 2024: R+59.4 2020: R+55.7 2016: R+56.5 2012: R+51.1 2008: R+46.3
Not yet ingested
- Civics
- —
Market trends
- HPI YoY
- ▲ 6.06%
- Current HPI
- 345.63
- Rent YoY
- —
- Metro
- —
- State GDP YoY
- ▲ 3.95%
- F500 in state
- 110
Industry mix (Fortune 500 HQ in TX)
| Industry | F500 HQs | Revenue |
|---|---|---|
| Energy | 16 | $1,198B |
|
||
| Technology | 5 | $198B |
|
||
| Engineering / Construction | 4 | $72B |
|
||
| Energy Services | 3 | $60B |
|
||
| Utilities | 3 | $41B |
|
||
| Healthcare | 2 | $330B |
|
||
Price history
-5.7% since first listed2 events — show timeline
- 2026-03-12 Price Changed $99,000 LAAR
- 2026-02-02 Listed $105,000 LAAR
Cash-flow waterfall
monthlySold comps — $/sqft
last 12 mo · ≤1 miLoading sold comps…