317 W 4th St · Erick, OK
Flood risk 1/10 · Minimal
- FEMA flood zone
- —
- Chance of flooding over 30 yrs
- 0.0%
- Est. flood insurance / yr
- —
Fire risk 5/10 · Moderate
- Est. fire insurance / yr
- $2,463 – $4,575
Heat risk 6/10 · Moderate
- Hot days now (above 105°F)
- 7 days/yr
- Hot days in 30 yrs
- 20 days/yr
Wind risk 2/10 · Minimal
- Chance of severe wind over 30 yrs
- 2.0%
Air-quality risk 1/10 · Minimal
- Unhealthy air days now
- 0 days/yr
- Unhealthy air days in 30 yrs
- 0 days/yr
Risk factors via First Street. Map © Google.
Why this score? — see what drove the A- grade
The composite is a weighted blend of 9 inputs, each scored 0–100. Each bar is that input's sub-score; the figure is the points it added to the 100-point composite (weight × sub-score).
- Cash flow +30.0/30.0
- ARV discount +15.0/15.0
- DSCR +10.0/10.0
- 1% rule +8.1/10.0
- Appreciation +7.3/10.0
- Schools +4.8/10.0
- Livability +3.2/5.0
- Rent growth +2.5/5.0
- Condition / age +2.5/5.0
$85,000
🖨 Deal sheet 📄 Offer letter ✓ Due diligence
Listing remarks MLS
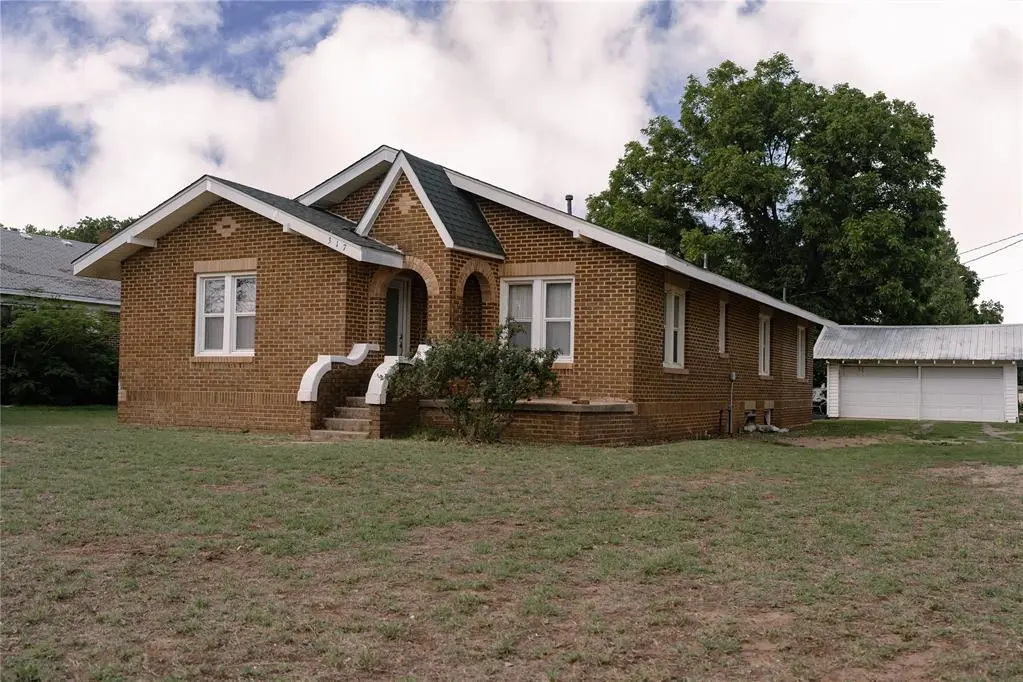
This very lovely historical home in Erick has 1,792 sq.ft. with 3 bedrooms, 2 baths, with separate living room, dining room, and family room. The large open kitchen includes a built in Whirlpool refrig, a Whirlpool gas range, dishwasher and microwave. One bedroom has a cedar closet. The large hall includes a washer and dryer. Remodeled baths. A 14'X28' basement is accessible from the kitchen. There is a ramp to the back door and a spacious detached two car garage.
Key facts
- Arched openings
- Brick home
- Single story
Tags
Property features AI
Finance
- Other: Located in Brooks Sub Div
- Financial info: Assumable loan status unknown; Loan qualification unknown
- HOA & community: No mandatory association dues
Exterior
- Parking: 2-car garage
- Utilities: No flood insurance indicated
- Home design: Single-family residence; One story; South-facing; Residential property, existing
- Construction: Brick and frame construction; Composition roof; Combination foundation; Built (existing)
- Exterior features: Infill lot; Storm shelter (other type)
Interior
- Kitchen: Range
- Bedrooms: 3 bedrooms
- Bathrooms: 2 full bathrooms
- Heating & cooling: Electric heating
- Interior features: One living area; Gas log fireplace; No dedicated study; No special interior additions (in-law plan not present)
- Laundry & utility: Combination foundation
Neighborhood map
What this means for you Summary
Snapshot
- This is a 3-bed/2.0-bath single-family listed at $85k.
Deal economics
- At list price, monthly cash flow is $359 ($4k/yr) — positive.
- The deal already cash-flows at list — no discount required.
- Meets the 1% rule at list price ($1k rent vs $85k).
Location & tenants
- Location reads 63/100 on livability (#218 in OK) — a middle-class / working-renter tenant base. Strengths: cost of living A+, crime B+, housing B+; Watch: amenities F, commute F, employment F.
- Erick (rural): math 50% / reading 60% proficiency, ranked #19 of 513 in OK (top 4%) — acceptable for families but not a draw, mixed tenant base, ~2y average lease.
- Zoned schools: Erick Es (math 52% / reading 57%, grade C, #23 of 845 statewide, top 3%, 152 students, 0% FRL); Erick Hs (math 24% / reading 24%, grade F, #150 of 447 statewide, top 48%, 57 students, 0% FRL) — zoned schools average 0% FRL vs 44% district-wide (44 pts lower); this property's tenant base skews higher-income than the district average.
- Zoned-school proficiency averages 40% at this address vs 55% district-wide (-16 pts) — the specific schools serving this property underperform the Erick average; the district grade overstates school quality for this exact location.
- Market conditions: 19 active listings in the ZIP; 16 units permitted in Beckham County in 2024 (0 in 5+ unit buildings).
Forward outlook
- In year one you build about $4k of equity ($588 loan paydown + $4k appreciation (4.6% local appreciation)).
- Beckham County population projected at +35% by 2050 — long-run rental-demand tailwind backs the buy-and-hold thesis.
- At projected returns (4.6% appreciation + 3.0% rent growth), your $24k cash investment doubles in ~3 years — after that, you're playing with house money.
- By year 8, paydown + projected appreciation supports a ~$34k cash-out refi (75% LTV) — recoverable capital for the next deal without selling this one.
Negotiation context
- Only 1 days on market — expect competitive offers; lowballing is unlikely to land.
- 2 sale attempts since 10y ago with the ask held roughly flat each time — persistent listings suggest the price (not the market) is what's stuck; bring a comps-based counter.
- Current owner paid $58k; 48% above their basis — modest negotiation headroom, anchor on the comps not their cost.
Risks & watch-outs
- Watch-outs: built in 1950 — expect roof / HVAC / electrical / plumbing capex.
- Climate carrying-cost: moderate wildfire risk; extreme-heat days projected 7→20/yr by 2055 (HVAC capex compounding) — expect insurance premiums to compound above CPI over the hold.
Questions for the listing agent
- Built in 1950 — when were the roof, HVAC, electrical panel, plumbing, and water heater last replaced?
- Is there a deadline driving the sale (1031 exchange, divorce, estate, relocation)? That informs how much negotiation room exists.
- What's the average days-on-market for RENTAL listings here right now (not sales)? A rising rental-DOM trend means longer vacancies and softer asking-rent achievability than the comps imply.
- What's the recent tenant-quality profile in this submarket — average credit score on applications, eviction rate, late-payment / NSF rate, and stable-employment percentage? A property-management company in the area should have these aggregated.
- How much new for-sale + rental construction is in the pipeline within 1–3 miles? Heavy new supply typically softens prices + rents 12–24 months out; constrained supply supports both.
Investment metrics
- 1% rule
- 1.31% ✓
- Cap rate
- 11.36%
- Cash-on-cash
- 18.11%
- DSCR
- 1.81
- GRM
- 6.4
CMA / ARV
- ARV (on-the-fly)
- $130,816
- Comps found
- 4
Show comp detail 4 sales within ~0.75 mi
| Address | Dist | Beds/Ba | Sqft | Sold | Price | $/sf | Match |
|---|---|---|---|---|---|---|---|
| 121 S Sycamore Ave | 0.62mi | 3/2.0 | 1,792 (0%) | 4mo | $130,000 | $73 | 68 |
| 600 S Maple Ave | 0.24mi | 3/1.0 | 1,728 (-4%) | 15mo | $35,000 | $20 | 67 |
| 301 E Roger Miller Blvd | 0.38mi | 3/2.0 | 1,896 (+6%) | 12mo | $74,000 | $39 | 63 |
| 302 S Highland Dr | 0.36mi | 4/2.0 (+1) | 1,632 (-9%) | 14mo | $157,000 | $96 | 51 |
Match score weights: distance 35% · size 25% · config 20% · recency 20%. Top-matched comps best support the ARV.
Projected returns pro-forma
4.57% appreciation · 3.0% rent growth · sell at horizon
- IRR
- 27.7%
- Equity multiple
- 2.70×
- Total profit
- $40,383
- Equity at exit
- $45,982
- IRR
- 26.9%
- Equity multiple
- 5.34×
- Total profit
- $103,297
- Equity at exit
- $77,607
Cash invested: $23,800 (down + closing). Projections, not guarantees.
Landlord ↔ Tenant lean methodology
- Overall (STATE)
- 83 Strongly Landlord-Friendly
- State Oklahoma
- 83 Strongly Landlord-Friendly · R+20
- County
- — inherits STATE
- City
- — inherits STATE
ZIP-level market 73645
- Home prices YoY
- 4.4%
- Active inventory
- 19
- Price-to-rent
- 6.4×
Monthly cashflow live
- Estimated rent
- $1,114 medium interval (Pro) →
- Mortgage (P&I)
- −$446
- Tax from tax record
- −$40 /mo · $481/yr
- Insurance
- −$35
- HOA
- −$0
- Vacancy / Maint / Mgmt
- −$234
- Net cashflow
- $359
Break-even live
UW: 25.0% down · 7.5% · 30yr · 1.5% tax · 5.0% vac · 8.0% maint · 8.0% mgmt
Financing live
Cash to close
- Down payment
- $21,250
- Closing costs
- $2,550
- Reserves months
- —
- Total cash needed
- —
Loan-product check · same deal, 3 products live
Conventional
25% down · 7.5% · 30yr
- Down + closing
- —
- Monthly P&I
- —
- Monthly cashflow
- —
- DSCR
- —
- Eligible?
- —
Personal DTI + credit; lowest rate.
DSCR
20% down · 8.5% · 30yr
- Down + closing
- —
- Monthly P&I
- —
- Monthly cashflow
- —
- DSCR
- —
- Eligible?
- —
No personal income docs; deal must DSCR.
Hard money
10% down · 12.0% · 12mo
- Down + closing
- —
- Monthly P&I
- —
- Monthly cashflow
- —
- DSCR
- —
- Eligible?
- —
Short-term bridge; refi at stabilization.
Listing history 2 events
-
2026-06-18remarks 693-char remark
-
2026-06-18$85,000 Active 1 DOM
ⓘ Source: listings_history table (triggers on properties + properties_extension) + one-shot
backfill from property_details.listing_events for pre-trigger history.
Tax reassessment forecast OK · Resets to sale price
- Current annual tax
- $481 · $40/mo
- Projected year-2 tax
- $765 · $64/mo
- Expected delta
- +$284/yr (+$24/mo · 59.0%)
ⓘ Screening estimate from a state-policy table — verify with the county assessor before closing.
Climate risk First Street
- Flood 1/10 Low 0% chance over 30 yrs
- Wildfire 5/10 Major
- Heat 6/10 Major 7 d/yr ≥105°F today · 20 d/yr by 30 yrs out
- Wind 2/10 Low 2% chance of damaging wind over 30 yrs
- Air quality 1/10 Low 0 unhealthy d/yr today · 0 by 30 yrs out
Nearby sold comps map
Loading sold comps map…
Walkable amenities ~0.75 mi
Loading nearby amenities…
Taxation est. · year 1
- Rental income
- $13,372
- − Mortgage interest
- −$4,761
- − Property taxes
- −$481
- − Insurance
- −$425
- − Repairs & maintenance
- −$1,070
- − Management
- −$1,070
- − Depreciation
- −$2,473
- Taxable income
- $3,093
- Est. tax owed @ 24.0%
- −$742
- After-tax cash flow
- $3,567/yr
For passive investors: Depreciation is non-cash, so a rental often shows a tax loss while cash-flowing — sheltering income. Rental losses are passive: they offset passive income freely, and up to $25,000/yr can offset ordinary (W-2) income if you actively participate and your MAGI is under $100k (phasing out to $0 by $150k); unused losses carry forward. On sale, claimed depreciation is recaptured at up to 25%, and gains may owe capital-gains tax (a 1031 exchange can defer both). Figures are a year-1 estimate at your 24.0% rate — not tax advice; consult a CPA.
Schools (NCES district)
- District
- Erick
- NCES district ID
- 4011040
- Math proficiency
- 50% ▲ 5.00%
- Reading proficiency
- 60% ▲ 5.00%
- Median HH income
- $39,189
- Composite
- 47.69/100
- National rank
- #4918
- State rank
- #19 of 513 in OK
Livability — Erick
- Score
- 63/100
- State rank
- #218
- US rank
- #15619
Category grades
Schools grade is shown separately in the Schools card above.
Census & demographics
- Census place
- Erick, OK
- Population (ZIP)
- 1,090
Population outlook (Beckham County) Hauer SSP2
- Today (2025)
- 26,564 people
- By 2030
- 28,217 · +6.2%
- By 2040
- 31,865 · +20.0%
- By 2050
- 35,862 · +35.0%
- By 2075
- 47,189 · +77.6%
- By 2100
- 55,622 · +109.4%
Race, ethnicity, and origin ACS 2023
- Neighborhood character
- Predominantly White (77%)
- Race & ethnicity
- White 77% Hispanic / Latino 12% Two or more races 10% Native American 1%
- Hispanic origin (detail)
- Mexican 12%
- Common ancestry
- Italian 5% Lithuanian 3% Slovak 1%
- Languages at home
- 96% English-only · Spanish 3%
Political lean MEDSL · Beckham
- 2024 margin
- Solid R (+70.1) · D 14.2% · R 84.3% · Other 1.4%
- 2008→2024 swing
- -14.0pp toward R · 2008: -56.1pp · 2024: -70.1pp
- All cycles
- 2024: R+70.1 2020: R+72.0 2016: R+70.8 2012: R+59.1 2008: R+56.1
Not yet ingested
- Civics
- —
Market trends
- HPI YoY
- ▲ 4.57%
- Current HPI
- 108.667
- Rent YoY
- —
- Metro
- —
- State GDP YoY
- ▲ 1.55%
- F500 in state
- 6
Industry mix (Fortune 500 HQ in OK)
| Industry | F500 HQs | Revenue |
|---|---|---|
| Energy | 3 | $48B |
|
||
Price history
+70.0% since first listed4 events — show timeline
- 2026-06-11 Listed $85,000 MLSOK
- 2017-07-13 Sold (MLS) $57,500 MLSOK
- 2016-07-07 Listed $69,000 MLSOK
- 2007-10-15 Sold (Public Records) $50,000 Public Records
Property tax history
+7.0%/yrLatest (2025): $481 · +4.8% YoY. Source: county tax records.
Cash-flow waterfall
monthlySold comps — $/sqft
last 12 mo · ≤1 miLoading sold comps…