4611 Ibis Ct · Granbury, TX
Flood risk 1/10 · Minimal
- FEMA flood zone
- X (unshaded)
- Chance of flooding over 30 yrs
- 0.0%
- Est. flood insurance / yr
- $507 – $1,088
Fire risk 6/10 · Moderate
- Est. fire insurance / yr
- $1,222 – $2,270
Heat risk 7/10 · Major
- Hot days now (above 108°F)
- 7 days/yr
- Hot days in 30 yrs
- 23 days/yr
Wind risk 6/10 · Moderate
- Chance of severe wind over 30 yrs
- 27.0%
Air-quality risk 2/10 · Minimal
- Unhealthy air days now
- 1 days/yr
- Unhealthy air days in 30 yrs
- 2 days/yr
Risk factors via First Street. Map © Google.
Why this score? — see what drove the B grade
The composite is a weighted blend of 9 inputs, each scored 0–100. Each bar is that input's sub-score; the figure is the points it added to the 100-point composite (weight × sub-score).
- Cash flow +30.0/30.0
- ARV discount +11.2/15.0
- 1% rule +10.0/10.0
- DSCR +10.0/10.0
- Schools +4.0/10.0
- Rent growth +3.8/5.0
- Livability +3.3/5.0
- Condition / age +2.5/5.0
- Appreciation +0.0/10.0
$130,000
🖨 Deal sheet 📄 Offer letter ✓ Due diligence
Listing remarks MLS
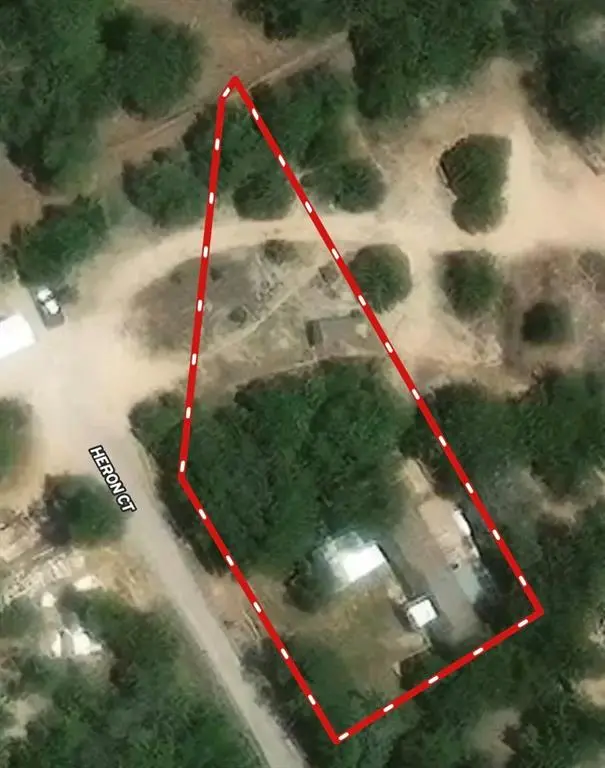
Great opportunity just minutes from the water in Granbury! This .5± acre property features a single-wide mobile home situated on a nicely treed lot, offering both privacy and shade. The backyard is fenced, making it ideal for pets or added security, and a carport provides convenient covered parking. With the ability to add a second mobile home, this property offers excellent flexibility for an investment rental, guest setup, or multi-unit income-producing property. Located near the lake and a fishing pier, the property provides easy access to outdoor recreation including boating, fishing, and relaxing on the water at Lake Granbury. Granbury is known for its charming small-town feel paired with strong growth, featuring a vibrant historic downtown square, local dining, shopping, and year-round community events. Its proximity to Fort Worth—just under an hour away—makes it an attractive destination for both full-time residents and weekend visitors. With continued new development in the area and increasing demand for affordable housing and rental properties, this tract presents a great opportunity to invest in one of North Texas’ most desirable lake communities. Whether you’re looking to expand your rental portfolio or create a flexible living setup.
Key facts
- Lake communities
- Carport
- Fenced backyard
Tags
Neighborhood map
What this means for you Summary
Snapshot
- This is a 4-bed/2.0-bath land listed at $130k.
Deal economics
- At list price, monthly cash flow is $680 ($8k/yr) — positive.
- The deal already cash-flows at list — no discount required.
- Meets the 1% rule at list price ($2k rent vs $130k).
- Recommended offer: $122k (6.0% below list) — sets the bar for market timing.
- Cap rate 12.6% vs local median 3.8% in Granbury — top-decile yield for the area; either an underpriced asset or a hidden risk that comps aren't pricing in. Stress-test before assuming the spread holds.
Location & tenants
- Location reads 66/100 on livability (#628 in TX) — a middle-class / working-renter tenant base. Strengths: cost of living A+, housing A+, health & safety A+; Watch: employment C-, crime D+, schools D.
- Granbury ISD (town): math 46% / reading 46% proficiency, ranked #237 of 826 in TX (top 29%) — families likely to look elsewhere, expect single-tenant / working-renter base with shorter leases.
- Market conditions: Rents rising fast (+5.2%/yr); 690 active listings in the ZIP; solid renter incomes; 125 units permitted in Hood County in 2024 (0 in 5+ unit buildings).
Forward outlook
- Local home prices are declining (-3.0%/yr); year-one equity from $899 of loan paydown is wiped out by about $4k of value loss. Plan a longer hold.
- Hood County population projected at +29% by 2050 — long-run rental-demand tailwind backs the buy-and-hold thesis.
- At projected returns (-3.0% appreciation + 5.2% rent growth), your $36k cash investment doubles in ~5 years — after that, you're playing with house money.
Negotiation context
- It's been on market 66 days — a 6% lower offer ($122k) is reasonable based on typical stale-listing flexibility.
Risks & watch-outs
- Climate carrying-cost: major wind risk, 27% chance of damaging wind over 30y; major wildfire risk; extreme-heat days projected 7→23/yr by 2055 (HVAC capex compounding) — expect insurance premiums to compound above CPI over the hold.
Questions for the listing agent
- It's been on market 66 days. Have you received any prior offers? Is the seller open to a 6% concession, seller financing, or rate buy-down credit?
- Why hasn't it sold? Are there any deal-killer items the seller is aware of (foundation, flood, title, zoning, code violations)?
- Is there a deadline driving the sale (1031 exchange, divorce, estate, relocation)? That informs how much negotiation room exists.
- Schools are D-rated, which usually means shorter tenancies and higher turnover. Who's the typical renter profile here, and what's been the actual vacancy rate?
- Crime grade is D in this area — have there been break-ins, vandalism, or insurance claims at this property in the last 3 years? What carrier currently insures it and at what premium?
- What's the average days-on-market for RENTAL listings here right now (not sales)? A rising rental-DOM trend means longer vacancies and softer asking-rent achievability than the comps imply.
- What's the recent tenant-quality profile in this submarket — average credit score on applications, eviction rate, late-payment / NSF rate, and stable-employment percentage? A property-management company in the area should have these aggregated.
- How much new for-sale + rental construction is in the pipeline within 1–3 miles? Heavy new supply typically softens prices + rents 12–24 months out; constrained supply supports both.
Investment metrics
- 1% rule
- 1.54% ✓
- Cap rate
- 12.57%
- Cash-on-cash
- 22.43%
- DSCR
- 2.00
- GRM
- 5.4
CMA / ARV
- ARV (median comp)
- $141,750
- List price
- $130,000
- Delta
- -8.29%
- Verdict
- FAIR
- Comps
- 5 within 1.0 mi
Projected returns pro-forma
-3.0% appreciation · 5.2% rent growth · sell at horizon
- IRR
- 17.7%
- Equity multiple
- 1.74×
- Total profit
- $26,820
- Equity at exit
- $19,383
- IRR
- 27.7%
- Equity multiple
- 3.71×
- Total profit
- $98,683
- Equity at exit
- $11,240
Cash invested: $36,400 (down + closing). Projections, not guarantees.
Landlord ↔ Tenant lean methodology
- Overall (STATE)
- 87 Strongly Landlord-Friendly
- State Texas
- 87 Strongly Landlord-Friendly · R+5
- County
- — inherits STATE
- City
- — inherits STATE
ZIP-level market 76049
- Home prices YoY
- -26.8%
- Rents YoY
- 5.2%
- Active inventory
- 690
- Price-to-rent
- 5.4×
Monthly cashflow live
- Estimated rent
- $1,998 medium interval (Pro) →
- Mortgage (P&I)
- −$682
- Tax est. 1.5%
- −$162 /mo · $1,950/yr
- Insurance
- −$54
- HOA
- −$0
- Vacancy / Maint / Mgmt
- −$420
- Net cashflow
- $680
Break-even live
UW: 25.0% down · 7.5% · 30yr · 1.5% tax · 5.0% vac · 8.0% maint · 8.0% mgmt
Financing live
Cash to close
- Down payment
- $32,500
- Closing costs
- $3,900
- Reserves months
- —
- Total cash needed
- —
Loan-product check · same deal, 3 products live
Conventional
25% down · 7.5% · 30yr
- Down + closing
- —
- Monthly P&I
- —
- Monthly cashflow
- —
- DSCR
- —
- Eligible?
- —
Personal DTI + credit; lowest rate.
DSCR
20% down · 8.5% · 30yr
- Down + closing
- —
- Monthly P&I
- —
- Monthly cashflow
- —
- DSCR
- —
- Eligible?
- —
No personal income docs; deal must DSCR.
Hard money
10% down · 12.0% · 12mo
- Down + closing
- —
- Monthly P&I
- —
- Monthly cashflow
- —
- DSCR
- —
- Eligible?
- —
Short-term bridge; refi at stabilization.
Listing history 18 events
-
2026-06-18days on market $130,000 Active 66 DOM
-
2026-06-17days on market $130,000 Active 65 DOM
-
2026-06-16days on market $130,000 Active 64 DOM
-
2026-06-15days on market $130,000 Active 63 DOM
-
2026-06-13days on market $130,000 Active 61 DOM
-
2026-06-09days on market $130,000 Active 57 DOM
-
2026-06-08days on market $130,000 Active 56 DOM
-
2026-06-07days on market $130,000 Active 55 DOM
-
2026-06-04days on market $130,000 Active 52 DOM
-
2026-06-03days on market $130,000 Active 51 DOM
-
2026-06-02days on market $130,000 Active 50 DOM
-
2026-06-02days on market $130,000 Active 49 DOM
-
2026-05-31days on market $130,000 Active 48 DOM
-
2026-04-13$130,000 Active 1298-char remark
Show marketing remark (1298 chars)
Great opportunity just minutes from the water in Granbury! This .5± acre property features a single-wide mobile home situated on a nicely treed lot, offering both privacy and shade. The backyard is fenced, making it ideal for pets or added security, and a carport provides convenient covered parking. With the ability to add a second mobile home, this property offers excellent flexibility for an investment rental, guest setup, or multi-unit income-producing property. Located near the lake and a fishing pier, the property provides easy access to outdoor recreation including boating, fishing, and relaxing on the water at Lake Granbury. Granbury is known for its charming small-town feel paired with strong growth, featuring a vibrant historic downtown square, local dining, shopping, and year-round community events. Its proximity to Fort Worth—just under an hour away—makes it an attractive destination for both full-time residents and weekend visitors. With continued new development in the area and increasing demand for affordable housing and rental properties, this tract presents a great opportunity to invest in one of North Texas’ most desirable lake communities. Whether you’re looking to expand your rental portfolio or create a flexible living setup.
-
2016-01-13soldstatus
-
2005-04-25soldstatus
-
2004-04-15soldstatus
-
2002-09-08soldstatus
ⓘ Source: listings_history table (triggers on properties + properties_extension) + one-shot
backfill from property_details.listing_events for pre-trigger history.
Climate risk First Street
- Flood 1/10 Low FEMA zone X (unshaded) · 0% chance over 30 yrs
- Wildfire 6/10 Major
- Heat 7/10 Severe 7 d/yr ≥108°F today · 23 d/yr by 30 yrs out
- Wind 6/10 Major 27% chance of damaging wind over 30 yrs
- Air quality 2/10 Low 1 unhealthy d/yr today · 2 by 30 yrs out
Nearby sold comps map
Loading sold comps map…
Walkable amenities ~0.75 mi
Loading nearby amenities…
Taxation est. · year 1
- Rental income
- $23,982
- − Mortgage interest
- −$7,282
- − Property taxes
- −$1,950
- − Insurance
- −$650
- − Repairs & maintenance
- −$1,919
- − Management
- −$1,919
- − Depreciation
- −$3,782
- Taxable income
- $6,481
- Est. tax owed @ 24.0%
- −$1,555
- After-tax cash flow
- $6,609/yr
For passive investors: Depreciation is non-cash, so a rental often shows a tax loss while cash-flowing — sheltering income. Rental losses are passive: they offset passive income freely, and up to $25,000/yr can offset ordinary (W-2) income if you actively participate and your MAGI is under $100k (phasing out to $0 by $150k); unused losses carry forward. On sale, claimed depreciation is recaptured at up to 25%, and gains may owe capital-gains tax (a 1031 exchange can defer both). Figures are a year-1 estimate at your 24.0% rate — not tax advice; consult a CPA.
Schools (NCES district)
- District
- Granbury ISD
- NCES district ID
- 4821390
- Math proficiency
- 46% ▬ 0.00%
- Reading proficiency
- 46% ▲ 4.00%
- Median HH income
- $55,856
- Composite
- 40.04/100
- National rank
- #3820
- State rank
- #237 of 826 in TX
Livability — Granbury
- Score
- 66/100
- State rank
- #628
- US rank
- #11998
Category grades
Schools grade is shown separately in the Schools card above.
Census & demographics
- County
- Hood County · 58,506 people
- City population
- 58,506
- Metro
- Granbury, TX
- Population (ZIP)
- 31,506
- Household income
- $104,967
- Rent vs Own
- Severe rent burden
- 235.0
Population outlook (Hood County) Hauer SSP2
- Today (2025)
- 63,502 people
- By 2030
- 67,459 · +6.2%
- By 2040
- 74,958 · +18.0%
- By 2050
- 81,922 · +29.0%
- By 2075
- 98,872 · +55.7%
- By 2100
- 107,796 · +69.8%
Race, ethnicity, and origin ACS 2023
- Neighborhood character
- Predominantly White (82%)
- Race & ethnicity
- White 82% Hispanic / Latino 14% Two or more races 9%
- Hispanic origin (detail)
- Mexican 11%
- Common ancestry
- Slovak 3% Serbian 2% Italian 2%
- Foreign-born
- 5% · Canada
- Languages at home
- 91% English-only · Spanish 8%
Political lean MEDSL · Hood
- 2024 margin
- Solid R (+66.0) · D 16.6% · R 82.6%
- 2008→2024 swing
- -11.9pp toward R · 2008: -54.0pp · 2024: -66.0pp
- All cycles
- 2024: R+66.0 2020: R+64.1 2016: R+66.5 2012: R+64.7 2008: R+54.0
Not yet ingested
- Civics
- —
Market trends
- HPI YoY
- ▼ -100.09%
- Current HPI
- 273.1293
- Rent YoY
- ▲ 5.20%
- Metro
- Granbury, TX
- State GDP YoY
- ▲ 3.95%
- F500 in state
- 110
Industry mix (Fortune 500 HQ in TX)
| Industry | F500 HQs | Revenue |
|---|---|---|
| Energy | 16 | $1,198B |
|
||
| Technology | 5 | $198B |
|
||
| Engineering / Construction | 4 | $72B |
|
||
| Energy Services | 3 | $60B |
|
||
| Utilities | 3 | $41B |
|
||
| Healthcare | 2 | $330B |
|
||
Price history
5 events — show timeline
- 2026-04-13 Listed $130,000 NTREIS
- 2016-01-13 Sold (Public Records) — Public Records
- 2005-04-25 Sold (Public Records) — Public Records
- 2004-04-15 Sold (Public Records) — Public Records
- 2002-09-08 Sold (Public Records) — Public Records
Property tax history
+6.8%/yrLatest (2025): $85 · +0.9% YoY. Source: county tax records.
Cash-flow waterfall
monthlySold comps — $/sqft
last 12 mo · ≤1 miLoading sold comps…